

Research Report Excerpt #1
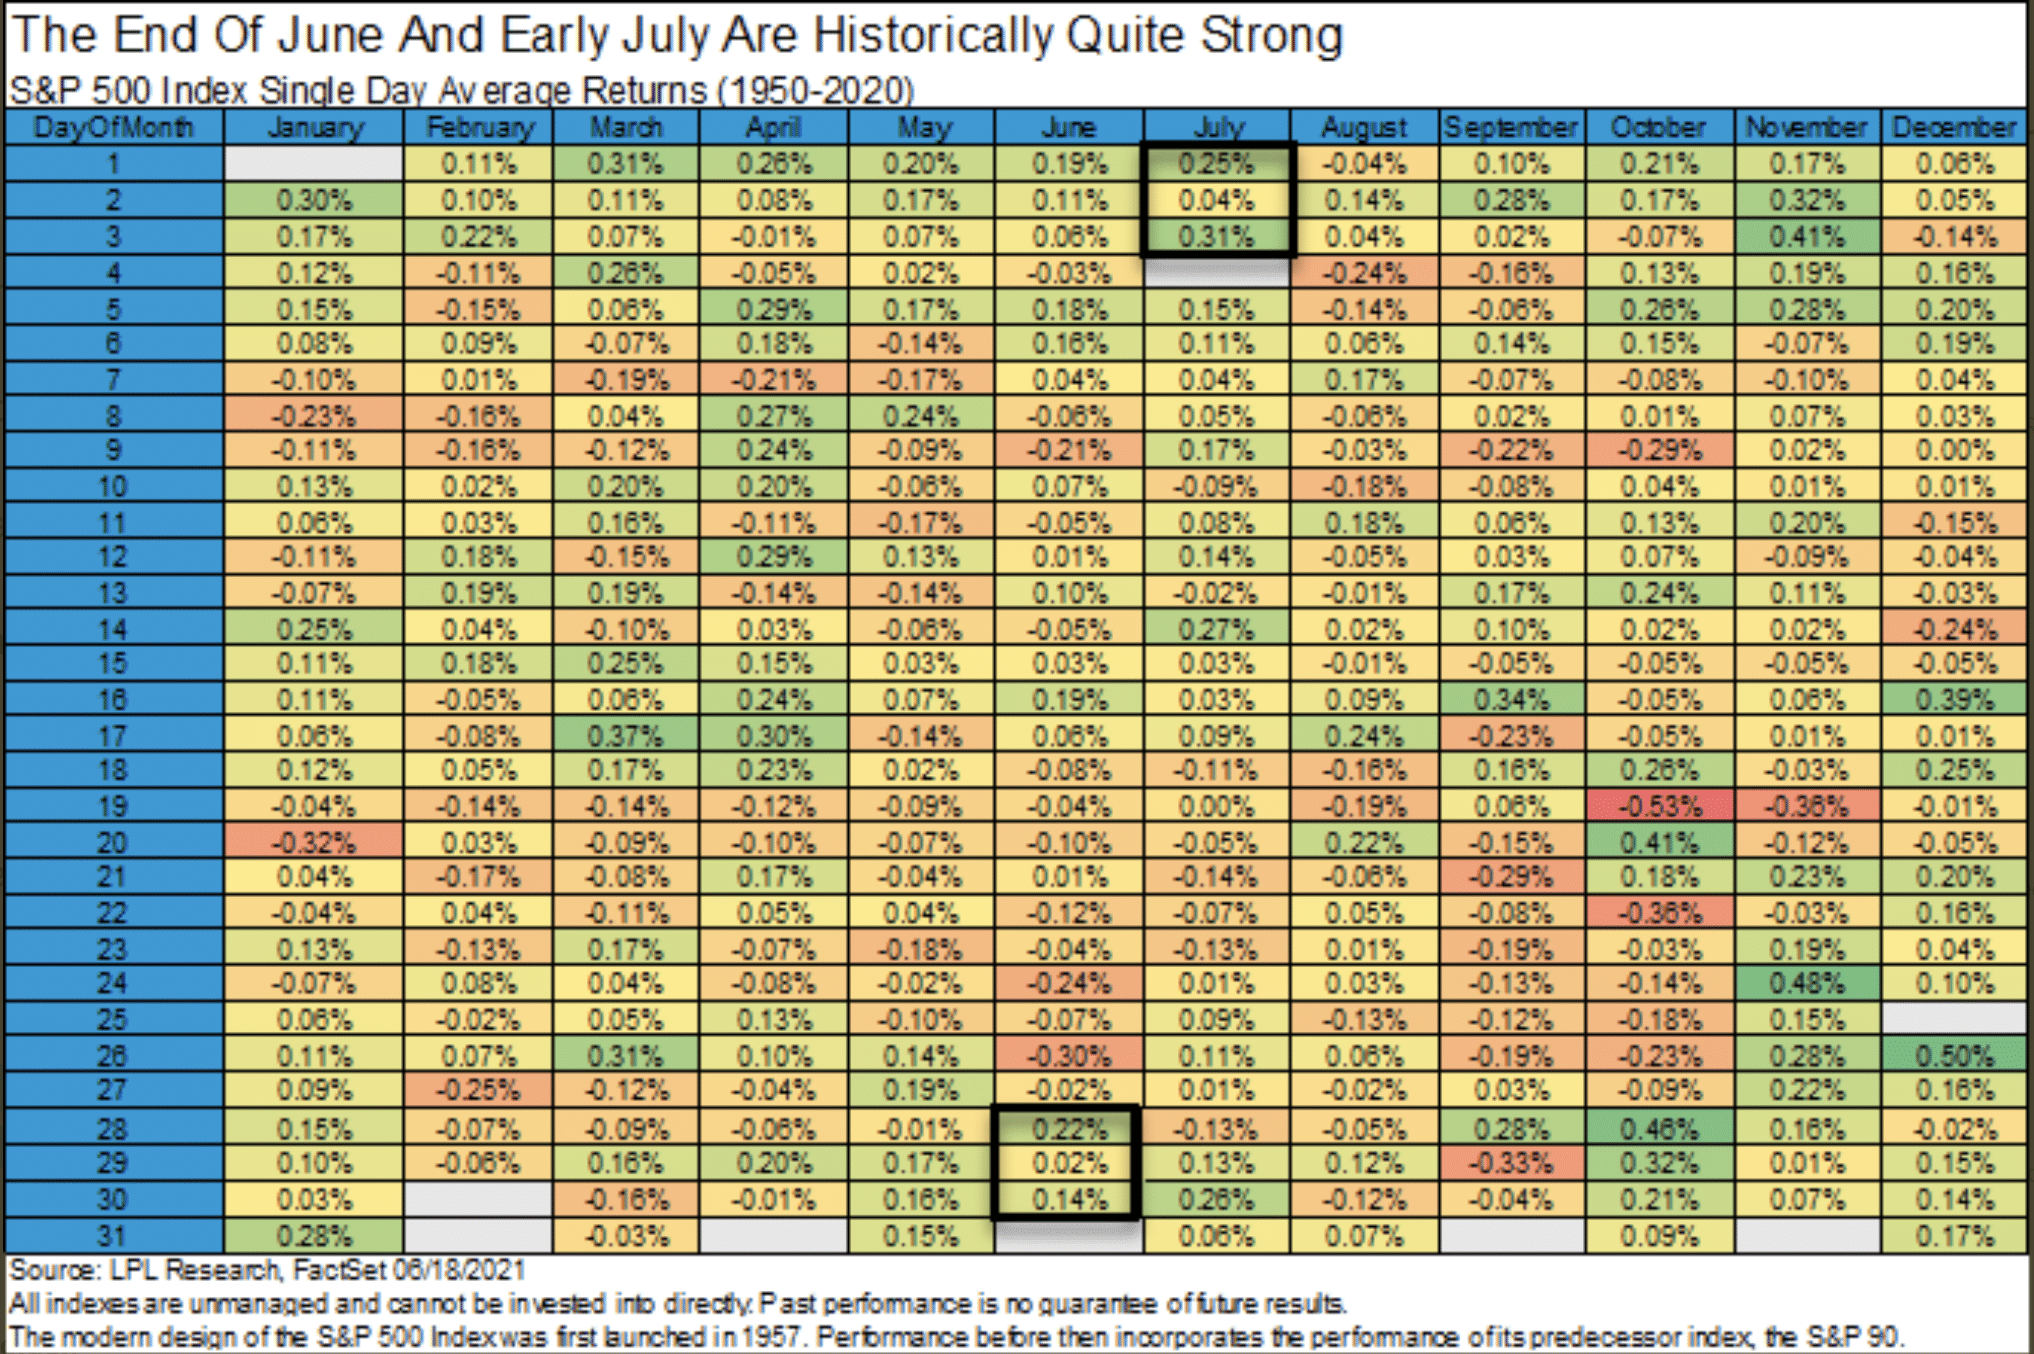
Early July started well once again, but now the market has hit the typical consolidation portion of July, where price action proves less favorable or mixed. In the final 2 weeks of July trading we’ll find out just how much repeating or rhyming the market expresses.
Research Report Excerpt #2
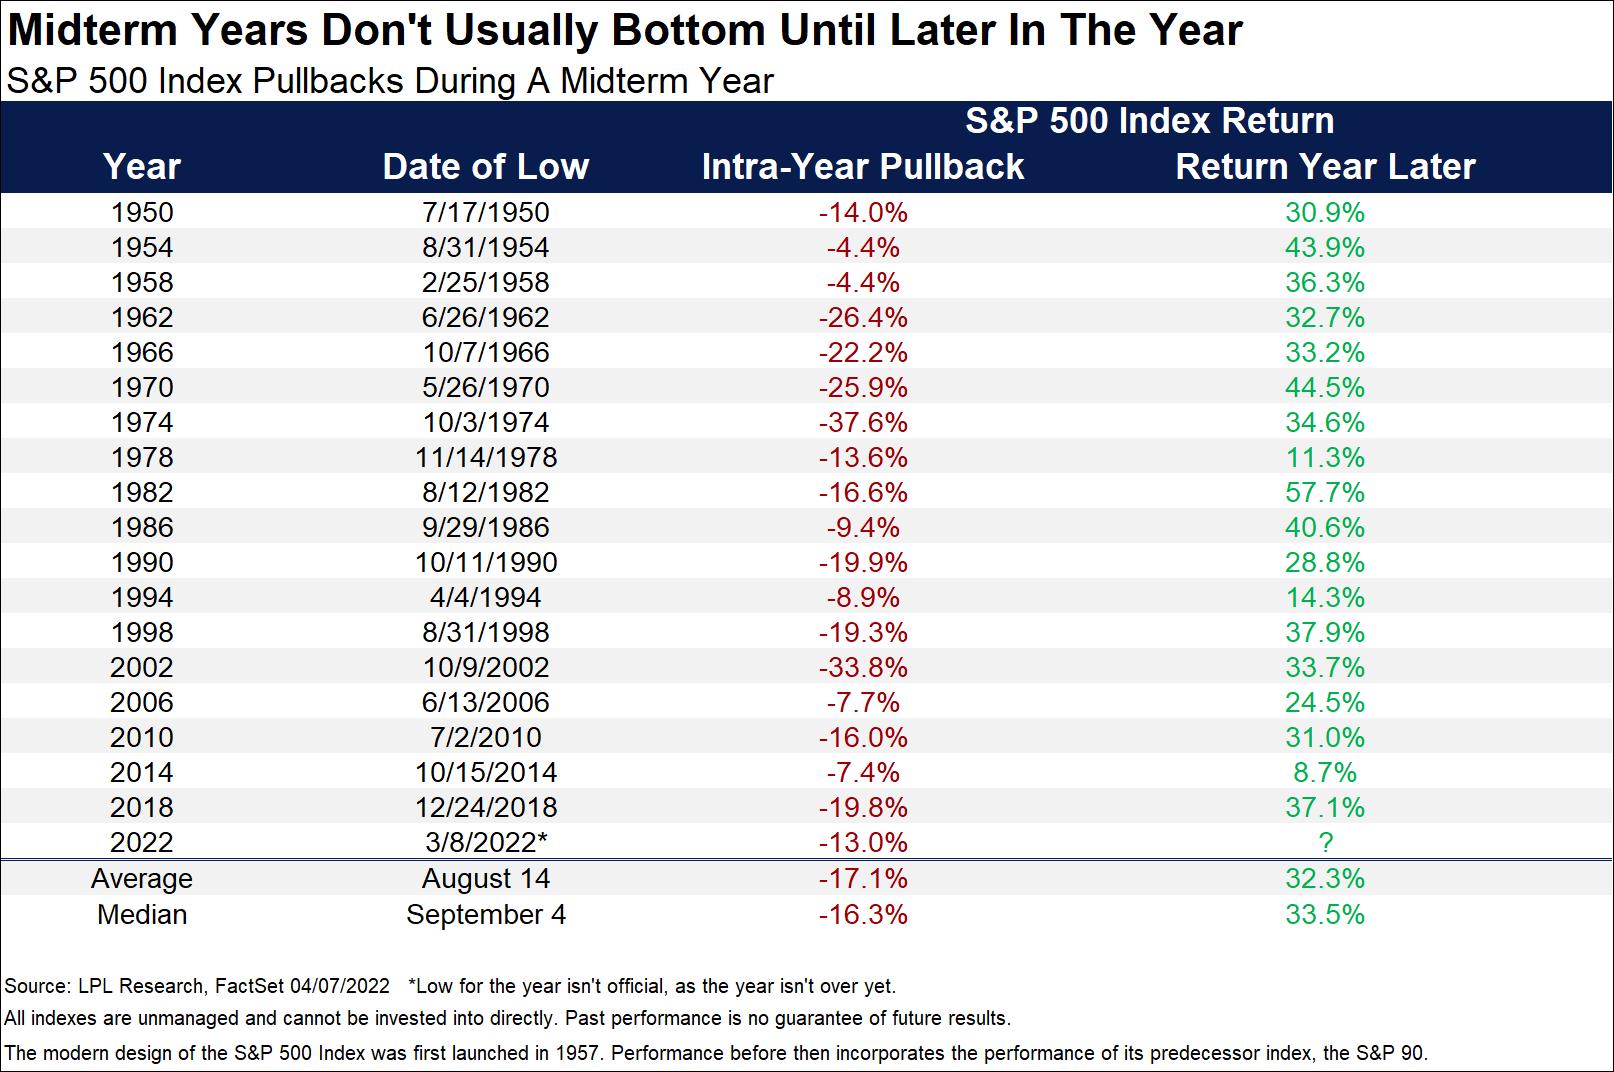
It’s hard to say this aloud, but if the S&P 500 and peer indices have already fashioned their bear market lows and trend higher, we would appreciate that, but probably not as much as we’d appreciate a touch of 3,500 first. For many months we had suggested and anticipated lower-lows correctly and in accordance with midterm election’s history (table above from LPL Financial).
Research Report Excerpt #3
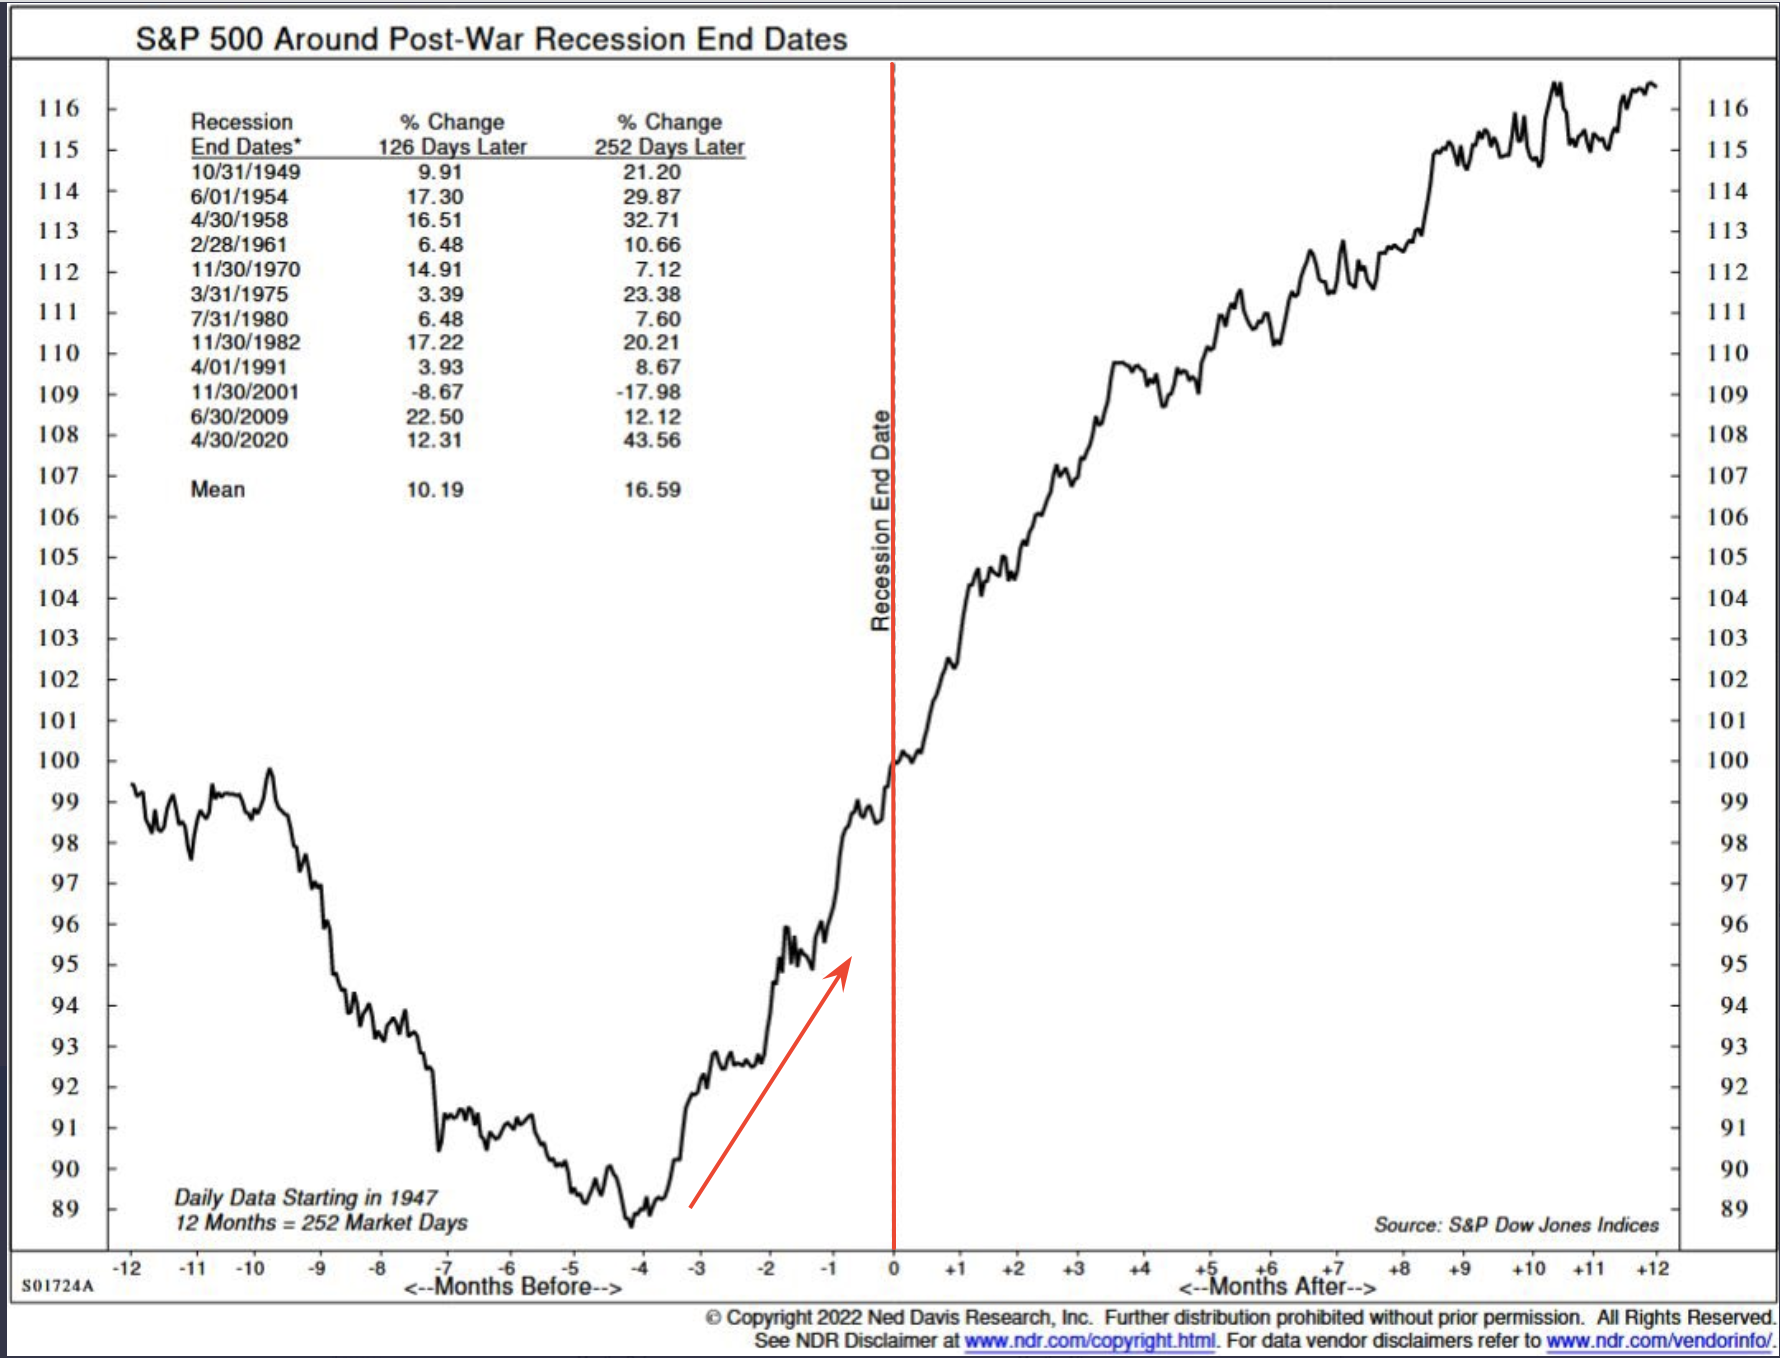
As we can see in the chart above, the S&P 500 typically bottoms 4 months (X-axis) ahead of the recession end date (vertical line in red). By waiting until the recession has been declared ended, the average investor is missing out on a roughly 25% rebound in price from the lows, which defines the OPPORTUNITY COST previously outlined.
Research Report Excerpt #4
But let’s be realistic, the economy may produce back-to-back quarters of contracting/negative GDP, while growing jobs at roughly 350K a month through the first half of 2022. If that’s not confusing and unprecedented, I don’t know what confusing and unprecedented looks like.
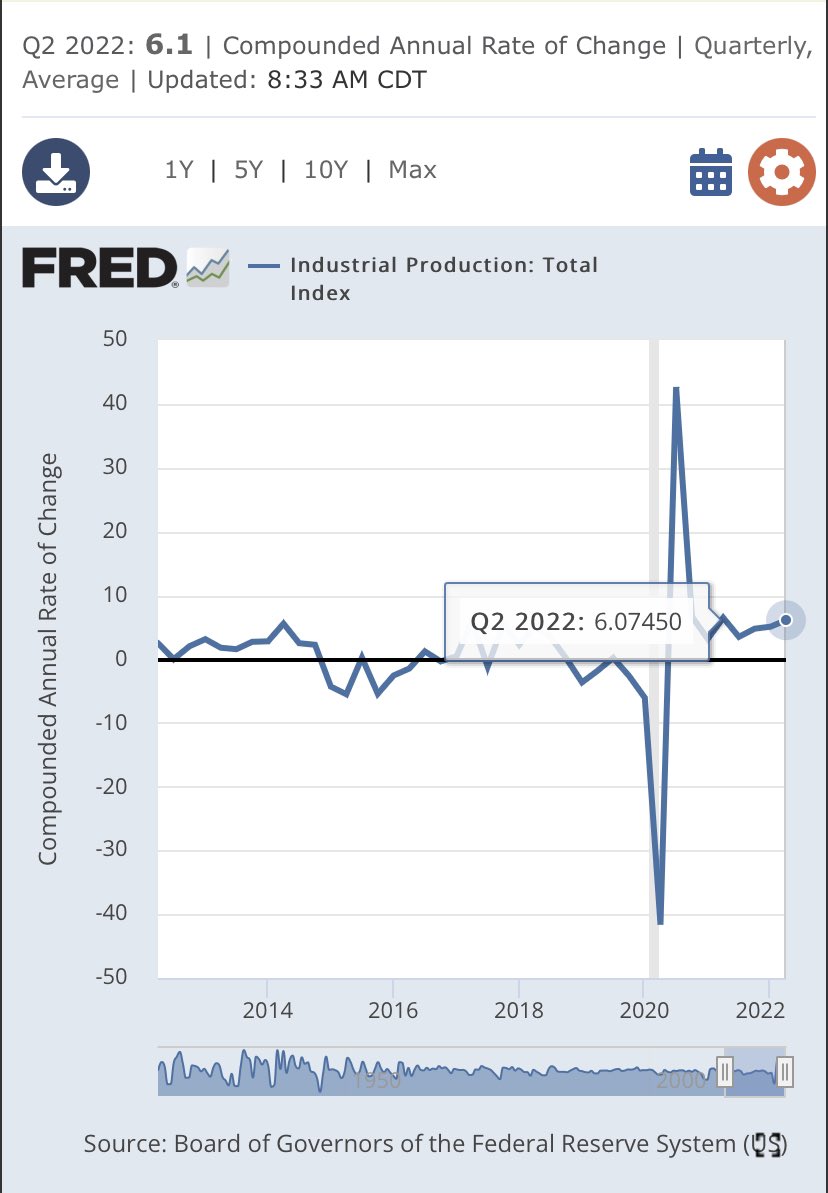
In addition to job growth, we just cycled two of the fastest quarters of growth for Industrial Production with negative GDP growth. Unprecedented! Anybody suggesting they know that the economy is in or will be in a recession given this job and manufacturing market/industry is expressing an opinion and not an ability to predict the future.
Research Report Excerpt #5
As we had previously outlined in our July 7, 2022 State of the Market, 5-year breakeven inflation rates tumbled in early June, and have remained in a downtrend ever since. Typically CPI closely tracks the 5-year breakeven inflation trend and we anticipate that correlation to materialize within the July CPI to come.
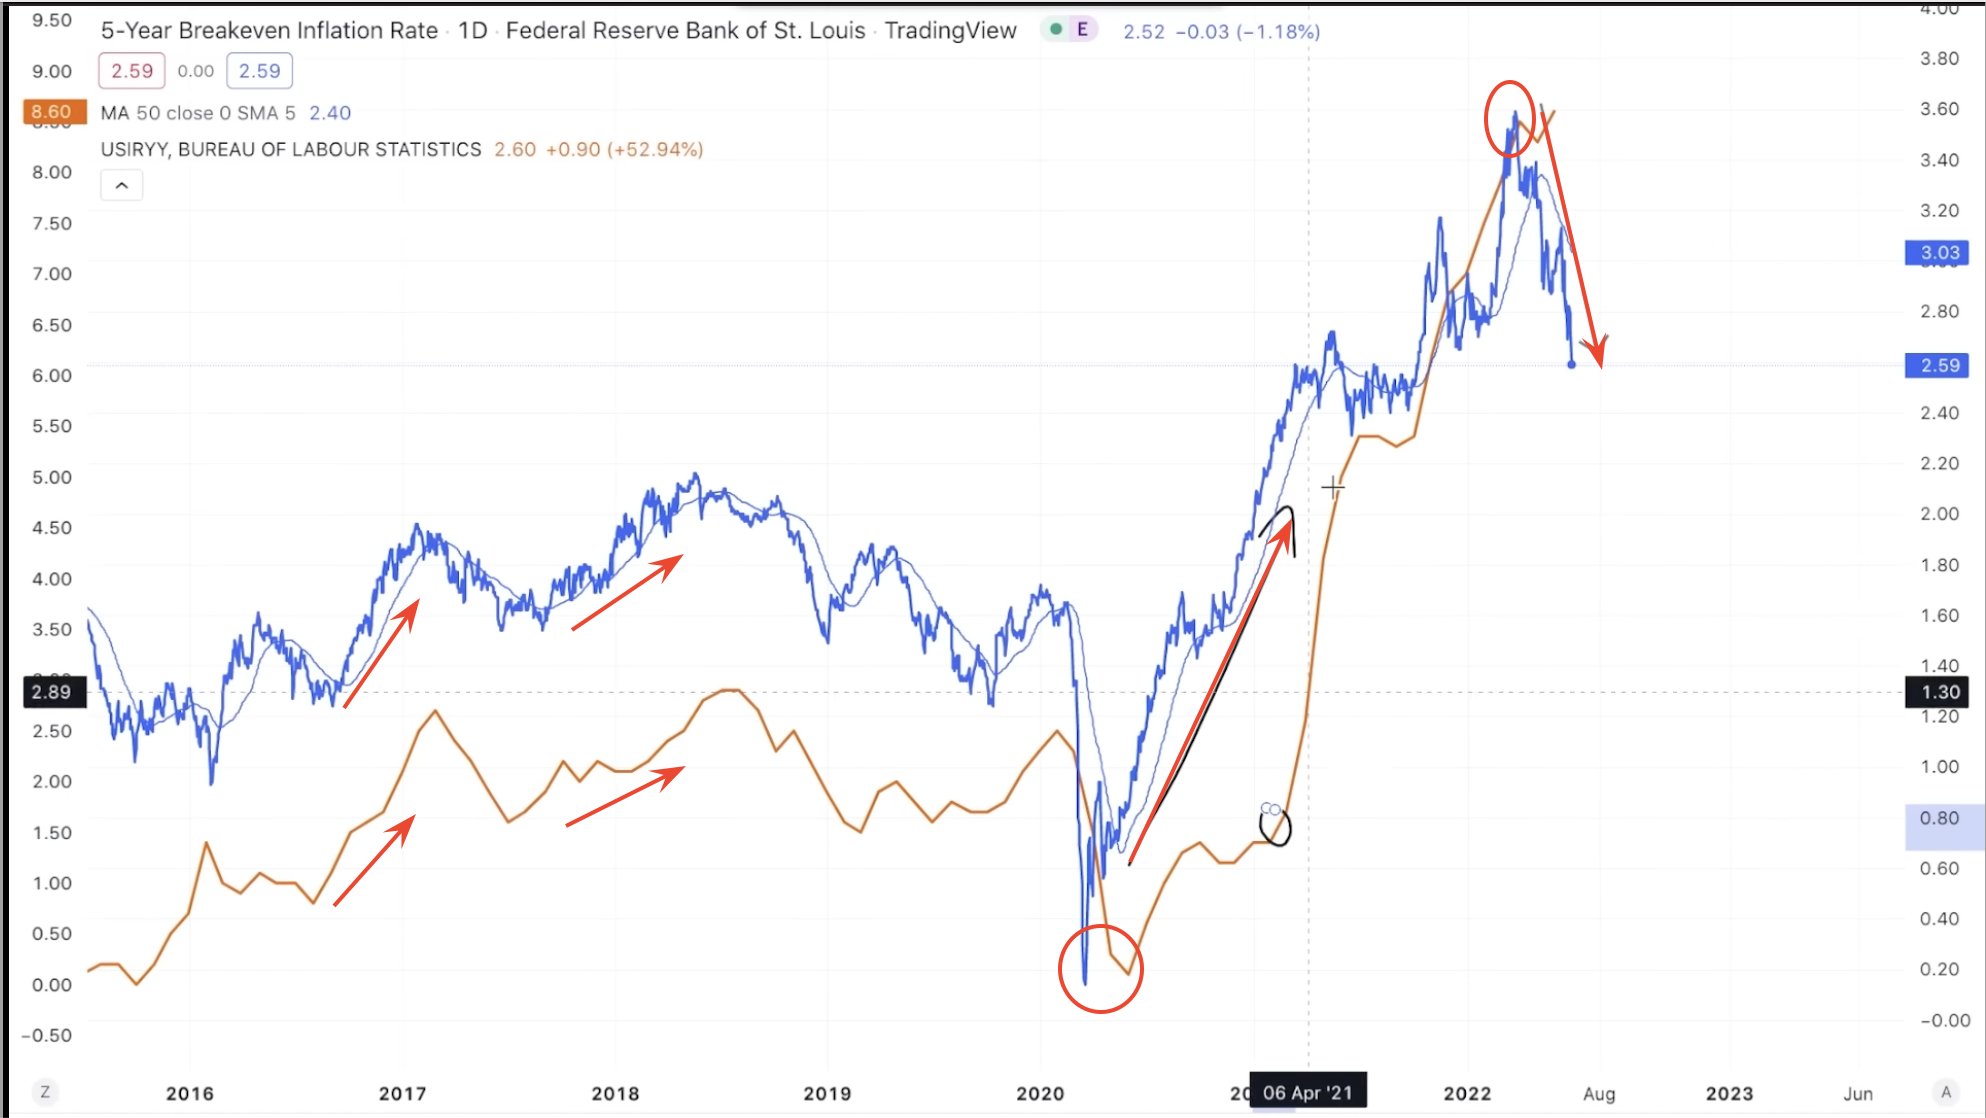
- One way to measure the market’s expectations for inflation is to look at breakeven rates (the rate that makes an investor indifferent between nominal-yielding bonds and inflation-protected bonds of a similar maturity). Even though we want to see these fall further, inflation expectations have already fallen considerably over 2-, 5-, and 10-year horizons.
- 5-yr breakevens have rolled over BIG TIME
- 5-yr breakevens lead inflation or the Consumer Price Index historically. So when we see the 5-yr breakevens spike or cascade lower, it is typically a good signal of where to anticipate CPI heading in the near-term.
- If we are not on the cusp of a disinflationary cycle, this would be a unique plunge in the 5-yr breakevens that doesn’t foreshadow lower inflation.
Research Report Excerpt #6
More importantly was the fact that inflation expectations finally rolled over in the UofM Consumer Sentiment report. (chart below) The 5-10-year inflation expectations actually fell a lot, down to 2.8%, the lowest since mid-2021.
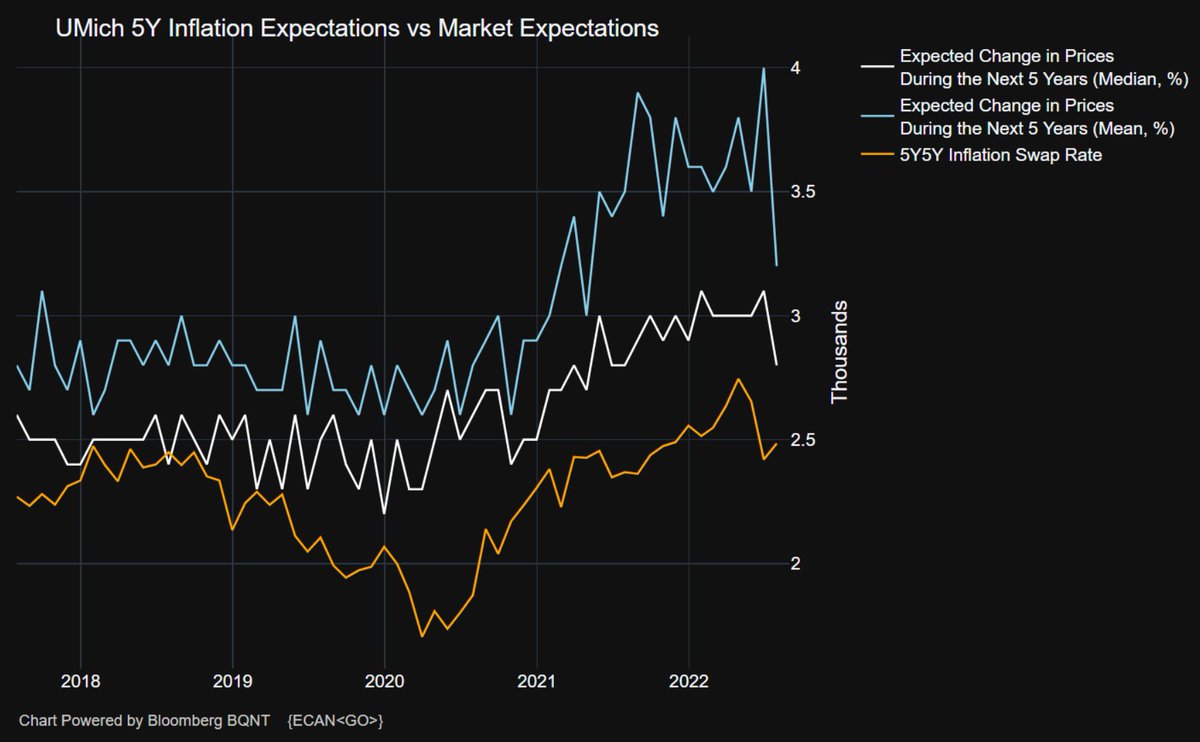
This is consistent with the lower gasoline prices consumers have seen since mid-June and has likely been the cause of the overall depressed sentiment readings since the New Year.
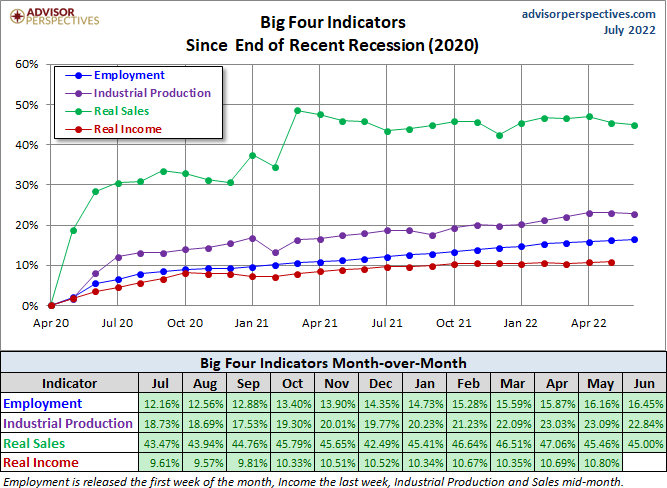
Research Report Excerpt #7
The chart and table below illustrate the performance of the generic Big Four with an overlay of a simple average of the four since the end of the most recent recession (2020). The data points show the cumulative percent change from a zero starting point for April 2020. It’s clear to see that the Big 4 remain in a long-term uptrend, even if expressing moderating growth in 2022.
Research Report Excerpt #8
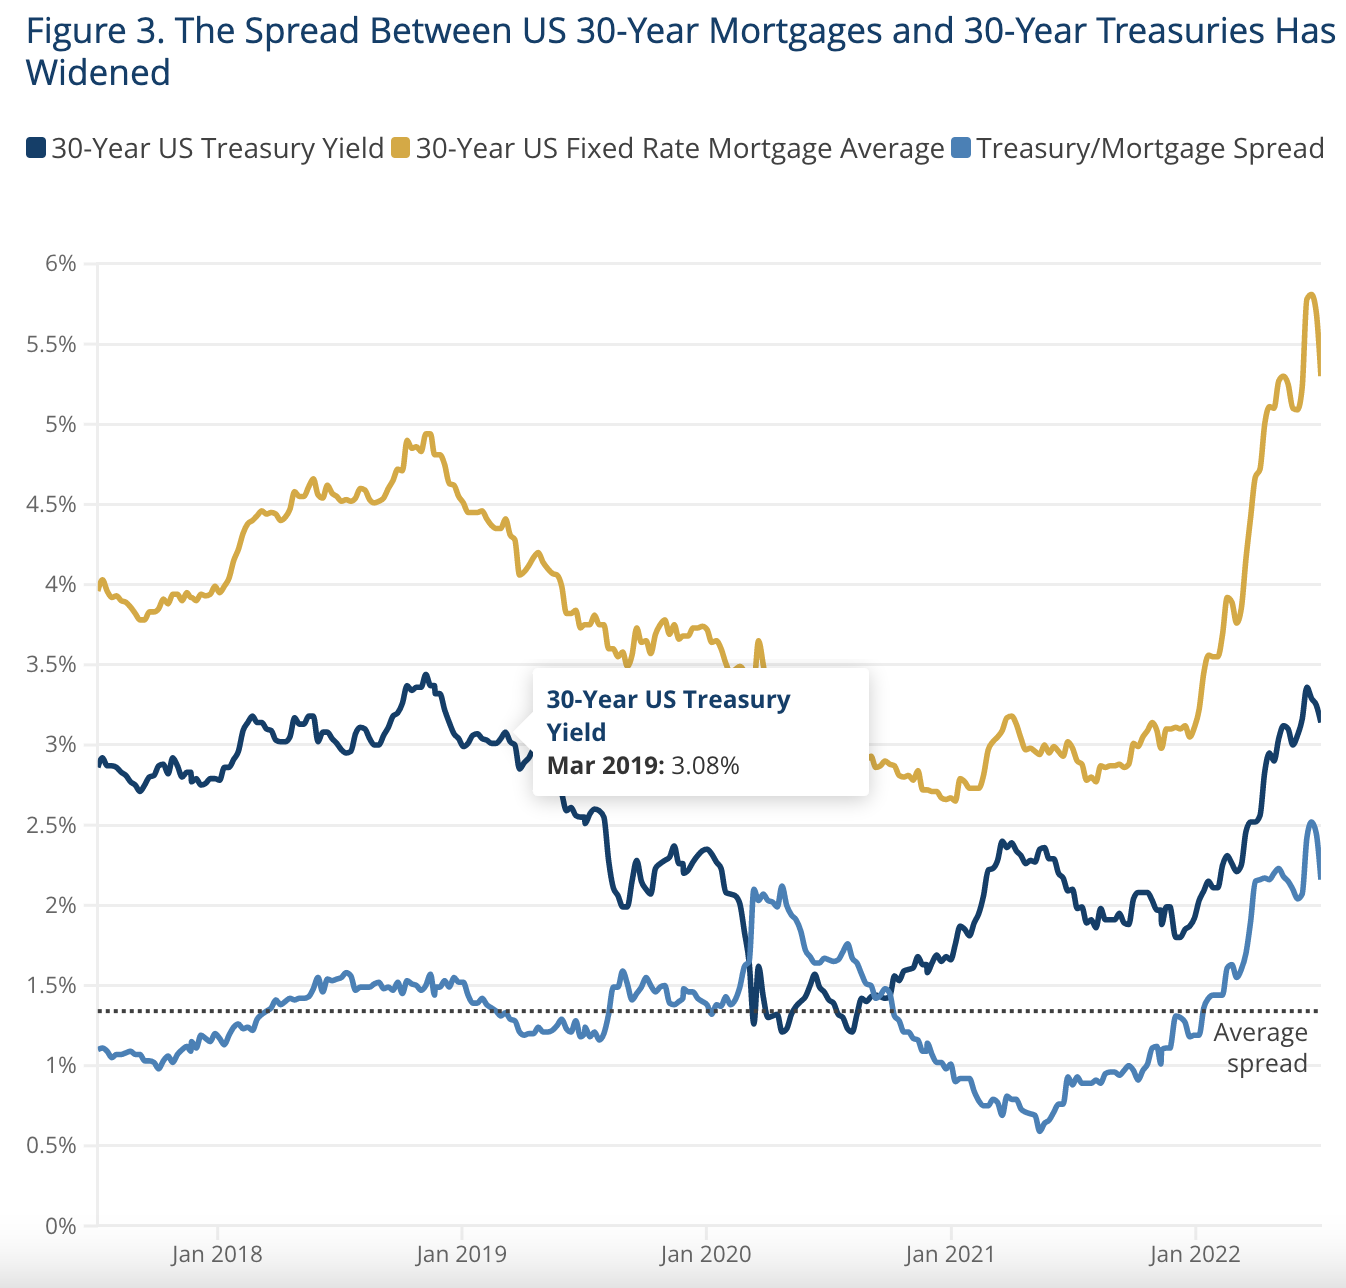
The current spread between mortgages and equivalent-duration U.S. Treasuries is at a historical high of circa 250 basis points. Assuming some stabilization in U.S. Treasuries, history would suggest that there is potentially 100-150 basis points of downside to mortgage rates – without Treasury yields necessarily needing to budge.
Research Report Excerpt #9

The clustered table and data sets above comes from Oppenheimer’s Ari Wald. Recall that we first looked at this data back in mid-May, and after heavy selling pressure hit stocks hard, but not hard enough. Market internals weakened further, but not further enough. At the time, more than 25% of stocks were above their 50-DMA within the broad NYSE index. We typically see NYSE % of stocks above their 200-DMA drop below 20% before the bottom in the market is achieved.
- Once this does occur, historically the forward S&P 500 returns are quite strong.
- 1-month = 3.7%
- 3-months = 8.6%
- 6-month = 12.2%
- 12-month = 16.6%
NYSE stocks trading above their long-term 200-DMA fell below 20% on June 13, 2022. On that day, the S&P 500 closed at 3,749. Since then the index rose to 3,900 and still holding a positive return one month after the breadth signal, as of Friday’s close. Historically, the 3-month, 6-month and 12-month returns are all favorable.


