The narrative surrounding inflation, or “reflation” as I recognize it to be, is pretty compelling. The financial media does a stand-up job of driving a fearful story that introduces many negative consequences from inflationary prices. History suggests that such fears are, indeed, overblown and generally only produce momentary equity market consequences. So before you get overly concerned about the impacts from a “reflationary” period…
Ben Carlson recently addressed one of the key concerns surrounding inflation from the perspective of rising prices and its correlation with rates. Interest rates and inflation do have a strong relationship over time but it’s not a foregone conclusion that higher prices would lead to higher borrowing rates.
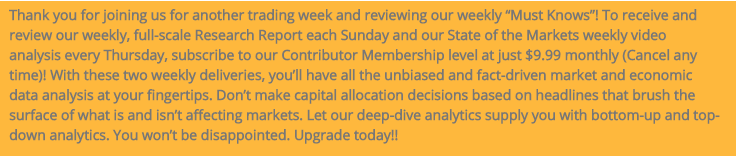
“I keep coming back to the WWII scenario because that’s really the only time we’ve experienced debt levels on par with this crisis. All of that wartime spending did lead to a surge in prices as inflation hit nearly 20% in the years following the war:
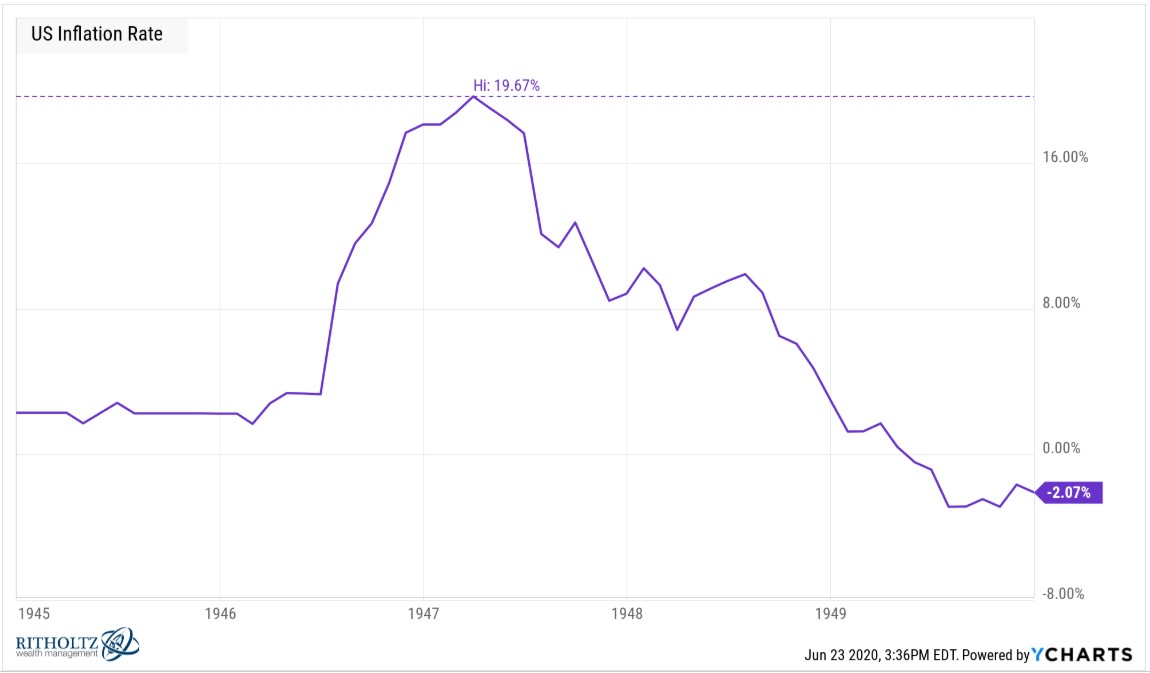
“But borrowing rates didn’t budge. In fact, there were three separate inflationary spikes in and around the war years and none of them led to an increase in rates. Here is the trailing 12 month inflation rate along with the 10 year treasury yield from 1939-1959:
Rates were unfazed by that huge post-WWII price spike because the government essentially put a cap on them. Rates didn’t start rising until the late-1950s, long after this spending had worked its way through the system. That inflation was also accompanied by robust economic growth and higher wages for the lower and middle class.”
There is a lesson here for economists, strategists and investors alike: Where there is a “problem”, there is always a solution”. As an investor, you don’t want to find yourself in a position whereby the narrative populated by the financial media, which is largely pessimistic and critical of the central banks, leads you to focus on the problem and without recognizing the history of central bank intervention, problem solving skills. Generally, the market forces central bank action, it’s just a matter of the market speaking loudly enough. That speech by the market often takes the shape of a brief, yet steep downturn. The savvy investor desires this downturn, but approaches it from the perspective of optimism given the aforementioned problem solving skills of the central bankers. With this in mind, let’s discuss today’s survival playbook. What do we aim to survive? The popularIZED and fearful INFLATION narrative, of course!
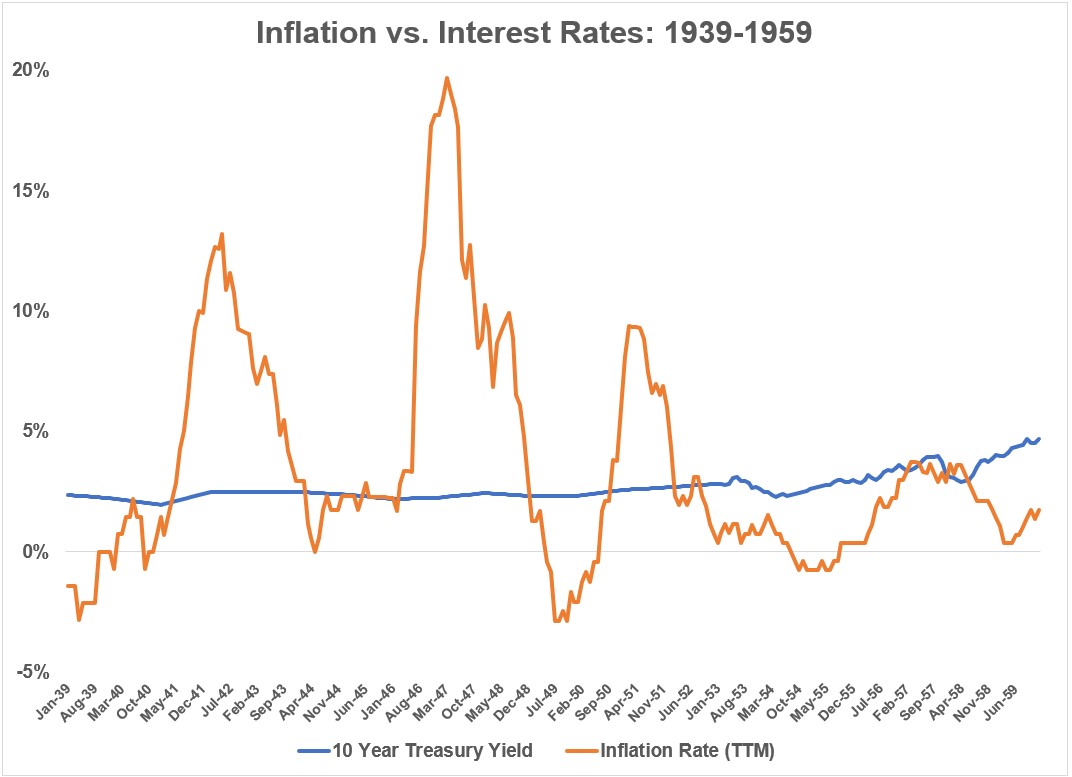
Every week, Finom Group disseminates a weekly Research Report for subscribers. In last week’s Report we prepared subscribers/investors for the likely base effect, inflation reports from the April Consumer and Producer Price Index. Below is a snapshot of that dissemination:
- Finom Group is anticipating strong rises in the PPI and CPI readings this coming week. We also believe that is the majority expectation, and as such, surges in prices should be recognized as commonplace and part of the typical “base effect” previously discussed. We should expect the base effects of Consumer Price inflation over the coming 3-5 month period to show up in CPI. The chart above identifies the clear inverse from the 2020 trough (even negative CPI) in 2021 forecast.
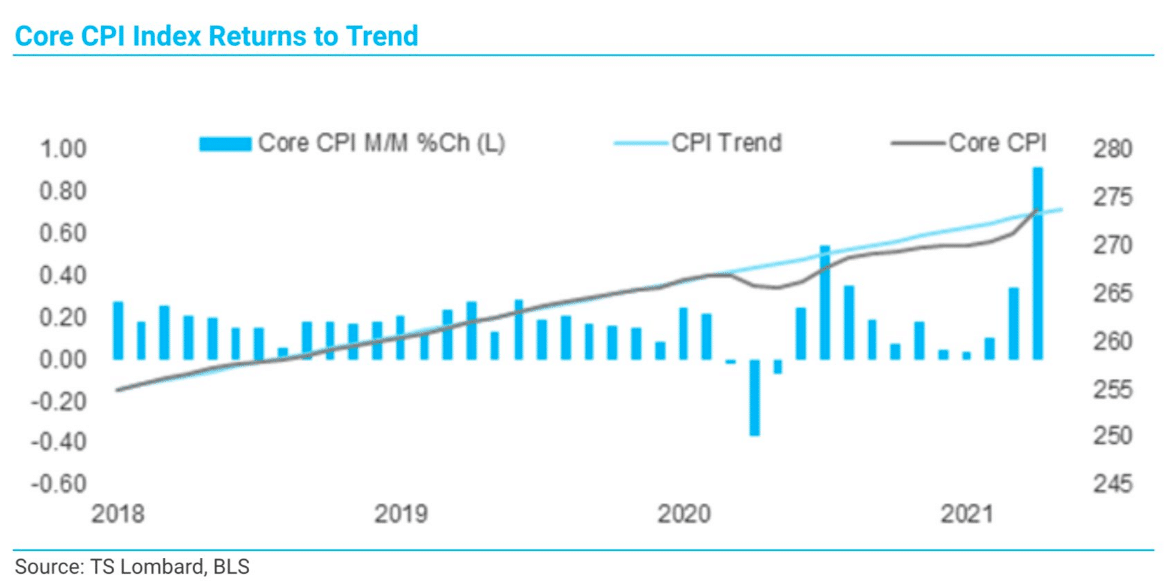
Moreover and before we get into a less fearful and evidence-based rational as to why the inflation boogyman shouldn’t be feared, the CPI pop in April was certainly large, but just as GDP is returning to pre-pandemic levels, core CPI is simply getting back to 2018-2019 trend line. (graph below)
From an investors/investing perspective, holding the appropriate economic and corporate growth expectations can go a long way toward remaining rational when markets react negatively to the momentary and weekly data points. This is the goal of Finom Group’s Research Reports, offering strong analysis that helps investors prepare for likely outcomes in order to make savvy investing decisions. Now that we know what to expect from the CPI and PPI data in the coming months and why it is less demonstrative than the incessantly hyperbolized and fear-driving financial media narratives surrounding inflation, let’s better offer a counter argument to the fearful inflation narrative with a look at how the consumer aims to combat the normal and to-be-expected inflationary period. And yes, Finom Group aligns with the Federal Reserves consensus belief that the inflationary period will prove TRANSITORY!
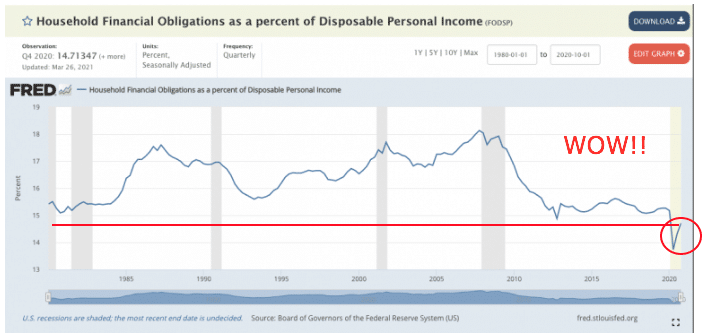
Wow indeed! The average household balance sheet, despite the Covid-19 economic shutdown and germinating reopening, is in the best shape since the 1970s. There are at least 2 reasons that Household Financial Obligations as a percent of Disposable Personal Income are recognized to express the best balance sheet for households/consumers since this metric has been tracked:
- Cares Act and subsequent fiscal policy measures
- The Great Deleveraging period
In order to understand this metric displayed in the chart above, its most importation to also dismiss with the notion that debt is inherently a bad thing. Therefore, it’s also important to recognize that the size of the debt is not to be feared, but calculated. What do we mean by this? For the average household and a growing population, we understand that the AMOUNT of collective debt will grow alongside a growing population of working age adults. Subsequently, the size of the debt is less relevant than the serviceability of that debt. In other words, it doesn’t necessarily matter whether the debt is $100 or $10,000, if the debt can’t be serviced for either debt amount. What matters is whether or not the average household can service either debt amount. At the Federal level, the same is true and serves as a reminder that while the fiscal debt has incrementally grown over the last 20 years to combat 9-11 recession, the Great Recession and the recent self-induced, pandemic recession, historically low rates aid in the ability of the Federal government to service that growing debt and regardless of the economic output. This reminds us that the Central Banks partnership with the Federal government is necessary to support an economic recovery as Central Banks dip into their toolbox of monetary policy to combat rising rates as they did during the WWII era. Bottom line reminder: It’s not the size of the debt, but the serviceability of the debt that matters most.
Referring to the Household Financial Obligations as a percent of Disposable Personal Income chart above, we can recognize the deleveraging period that commenced during and since the Great Financial Crisis (GFC). We can recognize that the average household essentially learned a valuable lesson from the GFC. They determined that debt was still acceptable, but within the confines of being able to pay down the outstanding debt on a monthly basis while still having a reasonable, if not substantial, amount of disposable income to support economic growth through consumer spending habits. Both fiscal and monetary policies implemented to combat the latest recessionary period only served to benefit the household balance sheet. So while the current “reflationary” period is to-be-expected, consumer balance sheets appear to be able to withstand the momentary reflation.
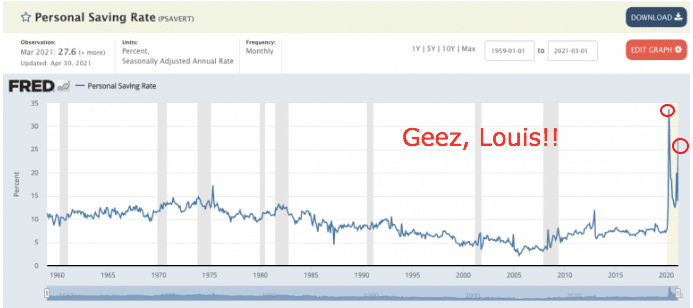
As shown in the chart above, the Persona Savings Rate is at near-record levels and multiples of where it has averaged for decades. Like the Household Financial Obligations as a percent of Disposable Personal Income referenced previously, this metric aids in the average household/consumer’s ability to combat near-term and momentary inflation. The consumer, is essentially flush with cash due to the Cares Act and subsequent government transfer payments. Having said that, the reality is that the Personal Savings Rate was rising well before the pandemic and the government transfer payments issued through fiscal legislation i.e. multiple Cares Act iterations. In fact, the previous decade-long expansion cycle proved the only expansion cycle since the 1970s whereby the Personal Savings Rate actually ROSE during the expansionary period. Take a careful look at the chart above. The gray lines represent recessions and the blue line tracks the Personal Savings Rate. For the most part and since the 1980s, for each expansionary cycle, the Personal Savings Rate is downward trending… until the 2009 post-GFC expansion cycle where it rose.
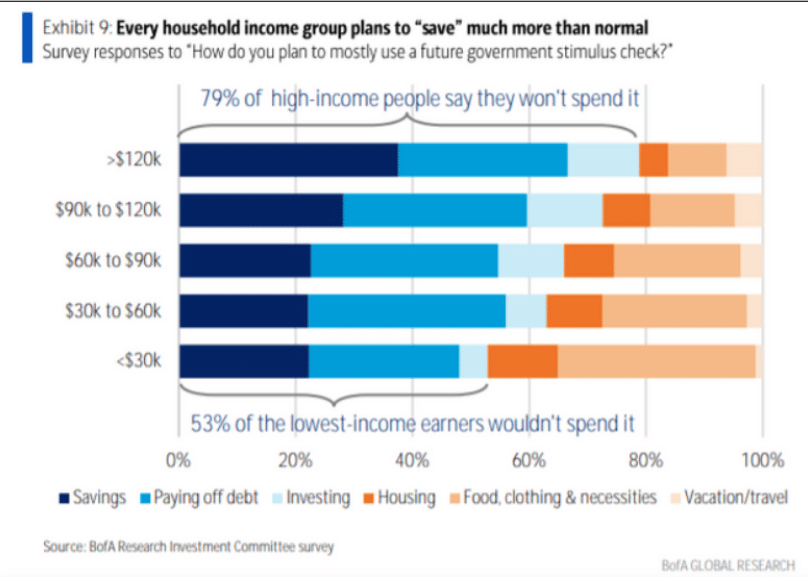
BofA: Surveyed >3,000 people to ask how they would spend new stimulus checks back in March. Even in the lowest-income category, 53% say they plan to save, pay off debts or invest. With the survey in-hand and recognizing the already abundant Personal Savings rate, fear not! What respondents to such surveys say and do in a consumer-based economy are often 2 different things. While Finom Group would anticipate continued fiscal household disciplines, we also recognize there is an exceptional amount of disposable income to facilitate growing consumer spending.
If you’re thinking the consumer only benefits from fiscal policy initiatives and will need them going forward and through the newly forming expansionary cycle… sorry not sorry! So while the current “reflationary” period is to-be-expected, consumer balance sheets, facilitated by record-level Personal Savings Rates, appear to be able to withstand the momentary reflation.
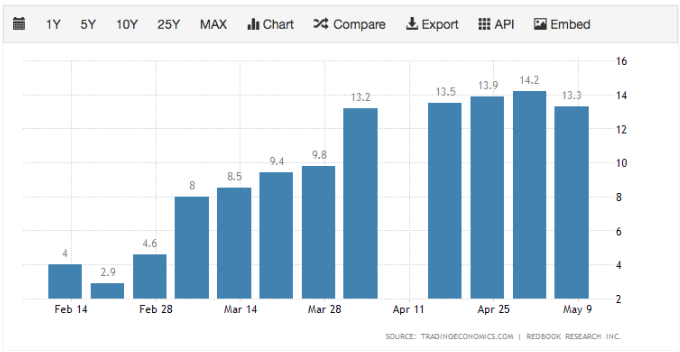
The bar chart above is a snapshot of how the Personal Savings Rate and Household Financial Obligations as a percent of Disposable Personal Income are currently working within the economy and through retail sales. In a pandemic or post-pandemic world, high-frequency retail data such as that provided by the Johnson’s Redbook retail sales weekly reporting becomes highly relevant. The Census Bureau reports a more collective and broad-based picture of monthly retail sales, but in between that report economists, strategists and investors can stay up-to-date with the strength of retail or consumption data by way of Redbook weekly retail sales. Given the strength of the household balance sheet, even as the reflationary period ensues, it’s clear that the impact is void on the consumer, and we know why.
On Friday, the latest monthly retail sales data will be delivered by the Census Bureau and most economists expect another record level retail sales print. As a reminder, below is a snapshot from the March Census Bureau retail sales report, whereby YoY retail sales grew almost 28% and MoM retail sales grew almost 10 percent.
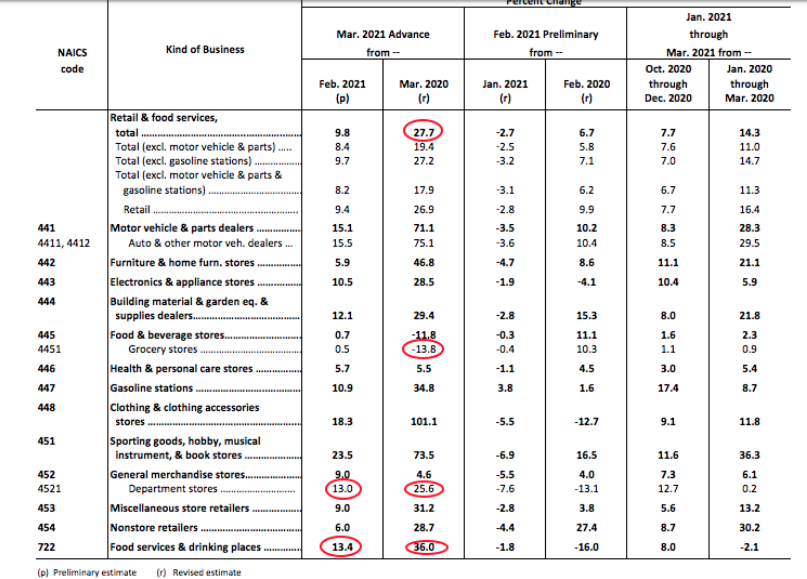
While we would usually focus on the YoY retail sales figure, it’s important to recognize the outsized growth compares to a period whereby the economy was shutdown and stay-at-home orders were in place. Therefore, the MoM numbers that headline the retail sales report, will largely remain front-and-center amongst market participants. Putting all the aforementioned puzzle pieces together…
…the fearful inflation narrative that drives clicks and viewership amongst the financial media is understood to be a product of the business model necessary to drive advertising dollars. The more fearful a narrative they produce, the more likely market participants are to “tune in”, which further drives advertising revenues. It’s the job of an investor to discern for themselves the realities beyond the fearful narrative. Admittedly, we shouldn’t dismiss inflation out-of-hand just yet. We should be knowledgeable about inflation conditions and monitor the incoming data over the next few months, as the Fed determines it to be transitory or potentially having some lingering effects by year’s end. Until that time period, however, we also know that the consumer should prove resilient and aiding the economic recover, as well as the earnings recovery. All of the aforementioned metrics that prove to benefit the consumer, also have proven to benefit corporate net margins.
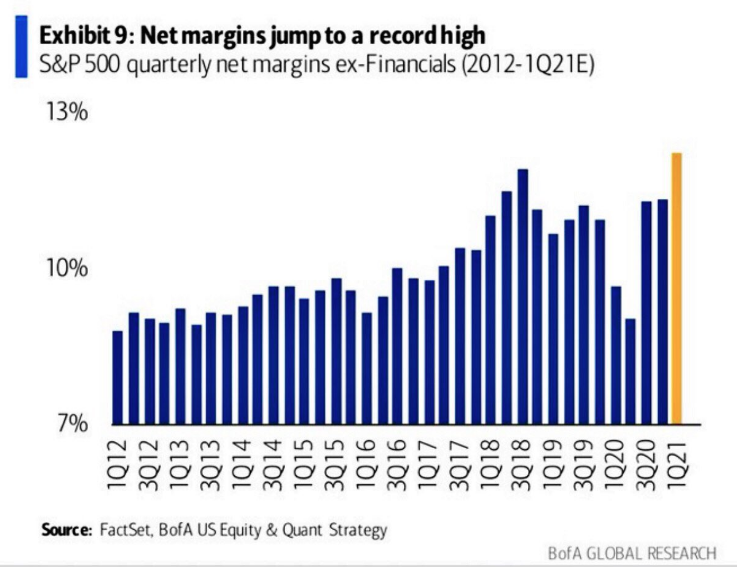
- Cutting costs and boosting prices for products seems to be working well for companies already.
- Net margins (ex-Financials) have jumped to a record high thus far.
- It’s clear that commodity cost impacts are NOT negatively reflected in margins, as they are largely offset by deleveraging costs elsewhere.