
Unless you were watching the tech-heavy Nasdaq (NDX) or the small cap Russell 2000 (RUT)… or Grubhub (GRUB), nothing happened in the market on Tuesday. Volume was extremely light again on what proved to be a very flat day for the Dow Jones Industrial Average (DJIA -.07%) or the S&P 500 (SPX -.05%). Investors aren’t willing to step into the market at all-time highs, with Q3 GDP, ADP private sector payroll report an FOMC rate announcement/press conference and earnings from Facebook (FB), Starbucks (SBUX) and Apple (AAPL) all on the docket Wednesday. That’s one heck of a docket!
As of the closing bell Tuesday, the bull market that began on March 9, 2009 is now 3,885 days old. While this is an interesting statistic, there are those who don’t believe in its accuracy, suggesting the bull market actually ended in 2018. The S&P 500 fell 19.8% from peak to trough in Q4 2018. The text book definition of a bear market is a drop of 20 percent. The drop of 19.8% would be close enough for those who now believe we are in a new bull market that actually began after the the Q4 2018 period. One such strategist who is of that opinion is Canaccord Genuity’s chief market strategist Tony Dwyer. In his latest interview with Josh Brown, Dwyer discusses why he is of the belief that despite weakening economic data, the bull market will live on through 2020 and find his upwardly revised S&P 500 price target of 3,200. Dwyer also points to a rally in the market through year-end.
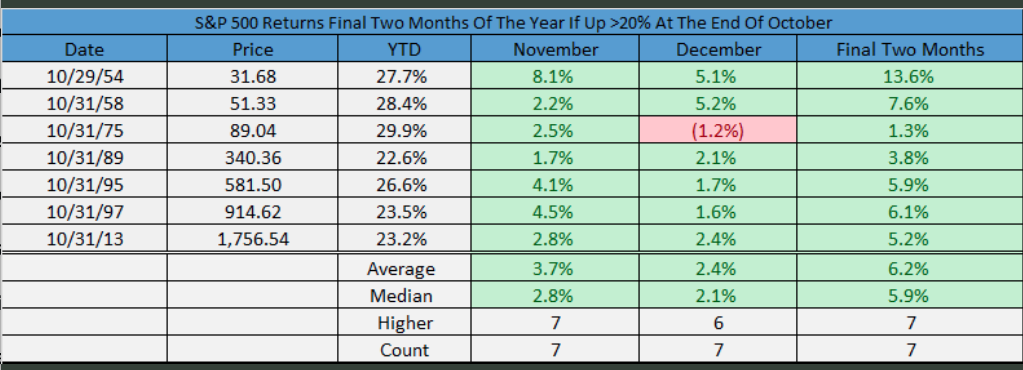
The S&P 500 is up more than 20% for the year and heading into what is historically the best 6 months to own stocks. The previous 7 times the S&P 500 was up more than 20% at the end of October, it saw November up 7 times and December up 6 times, according to LPL Financial.
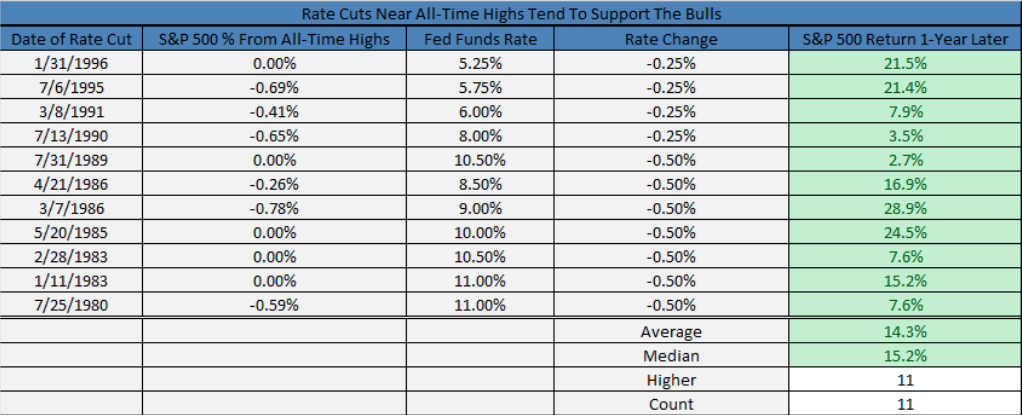
The economic data of the day for Wednesday will play an important role in achieving Dwyer’s outlook for the markets through year-end and to keep the historic market trends in tact. Possibly of even greater importance will likely be the FOMC rate cut announcement and press conference shortly thereafter. A rate cut of 25bps is all but guaranteed, however, the Fed’s statement and/or outlook for future cuts will likely determine the market’s performance near-term. While many market participants are befuddled as to why the Fed is cutting rates with markets at or near all-time highs, the reality is the market peaks are not the determinant for monetary policy makers. Before this year, the Fed cut rates with the S&P 500 within 1% of an all-time high 11 times. A year later? The S&P 500 was higher all 11 times. That’s a pretty good market stat with a pretty good rate of return, as shown in the table below:
Monetary policy plays a key role in providing investors with confidence that the FOMC/central banks will do what is necessary to sustain healthy economic conditions. When the Fed is hiking, usually the market is topping and financial conditions are become less accommodative and/or restrictive. When the Fed has stopped hiking rates or is easing, financial conditions are more accommodative.
It is important to note that the Fed started new cycles of rate cuts in 2001 and 2007 with 50 basis point cuts, implying they were more worried than they were letting on. Seeing that this cycle has had cuts of only 25 basis points so far, the cuts are being viewed more as “insurance” rather than warding off an impending recession, even if ISM manufacturing remains in contraction territory.
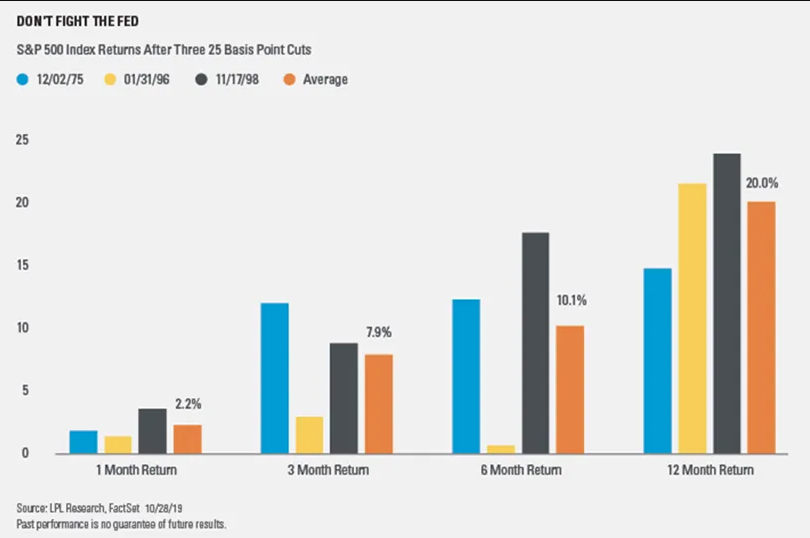
In terms of insurance rate cuts historically, stocks delivered impressive results after three initial 25 bps cuts in 1975, 1996, and 1998, with the S&P 500 Index up more than 10% six months later and 20% a year later. For many of the reasons noted already and as shown in the chart below, this is where the saying “Don’t Fight The Fed” comes from.
Unfortunately for market bulls, when we look at the Jerome Powell led FOMC on Fed rate announcement days, the market’s performance is rather abysmal. Here’s the average path the S&P has taken on Fed Days under Powell. (chart from Bespoke Investment Group)
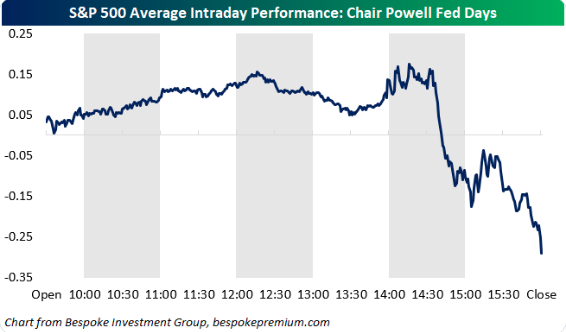
As we look at equity futures ahead of the 2:00 p.m. EST rate announcement, indeed equity futures are broadly flat ahead of the market open. According to the chart, investors would be wise to maintain low expectations for market performance Wednesday and even anticipate a downturn with increased volatility. History doesn’t always repeat itself, but aligning expectations can prove beneficial for investor/trader psychology.
If the Fed’s messaging is on point and found with favor amongst the investor communities, November could prove another strong month of returns. Having said that, we stress the words “If the Fed’s message is satisfactory to investors”. It’s a difficult task for Fed chairman Jerome Powell to tackle, as he aims to pause rate hikes going forward and with a focus on gauging the efficacy of the soon to be 3 implemented rate cuts.
“This will be the third rate cut, and that’s been sort of the magic sauce in the 1990s to get growth to stop slowing,” Evercore ISI Chairman Ed Hyman said on Monday. “They feel like they are in sort of a familiar territory if this works out, and the stock market rallying is a suggestion that it is working out.”
The Fed does not desire to find themselves with a sharp and adverse market reaction to their message and as such we would think the Fed maintains its data dependency, even as Goldman Sachs believes the Fed will alter this message to evoke a more hawkish tone. If the Fed does remove the data dependency language, we would anticipate a negative reaction from markets.
While Wednesday will be a jam-packed day of data, FOMC focus and earnings, investors will need to look beyond the day and toward November. The fourth quarter of the year tends to be the strongest period for stocks. The month of November, in particular, has been among the best months of the year for the markets over the past decade and through the bull market cycle.
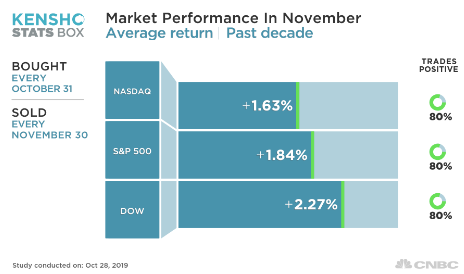
All 3 major indices have traded positively 80% of the time in November since 2009, according to a CNBC analysis of Kensho, a hedge fund market analytics tool. The S&P gains an average of 1.8%, while the Nasdaq adds over 1.6% and the Dow Jones Industrial Average has been up, on average, 2 percent.
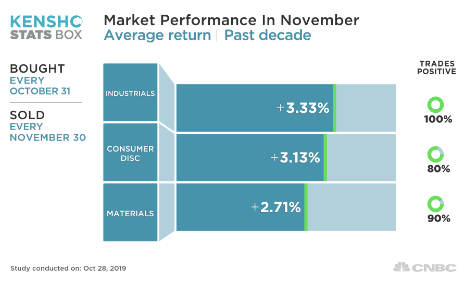
The top-performing sectors in the second to last month of the year, according to the CNBC analysis of Kensho data, are industrials, consumer discretionary and materials.
While market seasonality did not play out well last year, if at all, it doesn’t mean that investors should forget about seasonal relevance. And least we not forget that the market expressed a technical bear market as the Fed was raising rates through the Q4 period and tightening its balance sheet. Thus far in 2019, market seasonality has been playing out extremely well in 2019. Remember that dip at the beginning of October? Historically it has paid handsomely to buy that dip in October in preparation for the best 6 months to own stocks. Here is another chart from the Traders Almanac showing the seasonal pattern for all years since 1901 and then overlaid with just the Pre-Election Years.
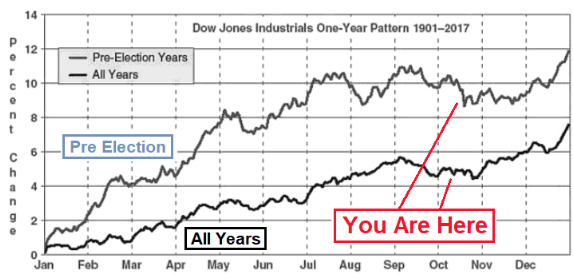
Once again the seasonal chart has worked out quite well with the early October dip proving a buying opportunity and the S&P 500 achieving a new all-time high soon after.
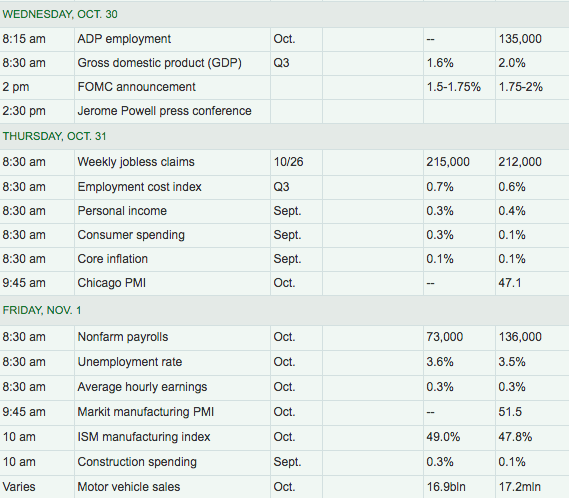
For all the heightened anxiety over the upcoming Fed rate announcement/press conference, investors will first tackle the latest ADP private sector payroll report and the first look at Q3 2019 GDP. ADP will roll out at 8:15 a.m. EST, 15 minutes ahead of the GDP release. Economic growth is expected to have slowed during the Q3 period from 2% in Q2 down to roughly 1.5% in the Q3 period.
With respect to the ADP report, the seasonally adjusted data is pointing toward growth MoM and YoY in all but one sector. Could we see growth in Mining and Logging (Natural Resources) and make it ten for ten? (Jon Barsanti Jr.)
Month to month growth is expected in all sectors except Natural Resources. We know that the “rig count” for oil extraction have decreased during the past few months. That said, there is more to the “Natural Resources” sector, or Current Employment Statistics “Mining and Logging” sector, than just oil production. The largest growth, in percentage terms, is expected in Education and Health Services (EHS,) Leisure and Hospitality (LAH,) Construction, and Trade, Transportation, and Utilities (TTU.) A wild card is the Information Sector. Last year there was an October Spike in IT payroll.
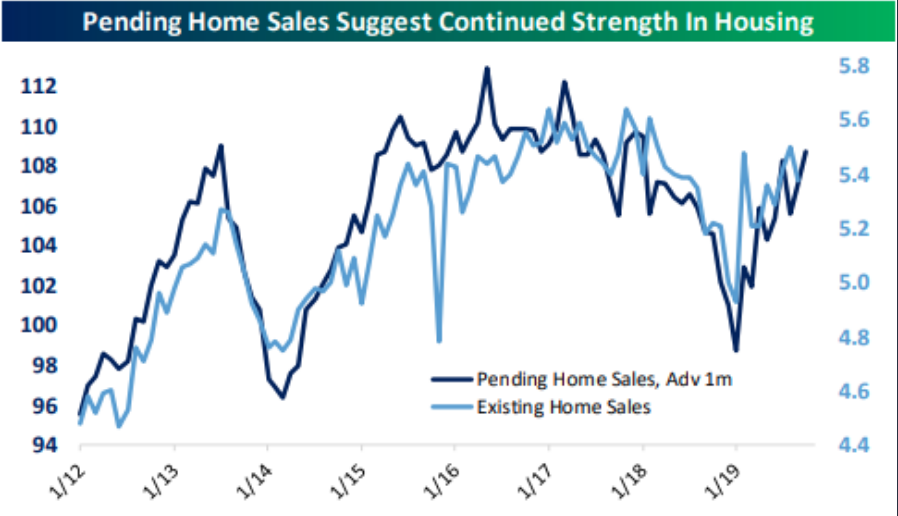
With fixed rate mortgage levels nearly a point below a year ago in the same period, housing sector data has continued to roll in at a strong YoY pace. Tuesday’s release for Pending Home sales showed a continued improvement. The Pending Home Sales Index (PHSI), a forward-looking indicator based on contract signings, rose 1.5% to 108.7 in September. Year-over-year contract signings jumped 3.9%. An index of 100 is equal to the level of contract activity in 2001.
Pending home sales have made a new high for the current uptick relative to 2018 lows and while still well below record levels from a few years prior are rebounding even faster than the fall from 2017-2018.
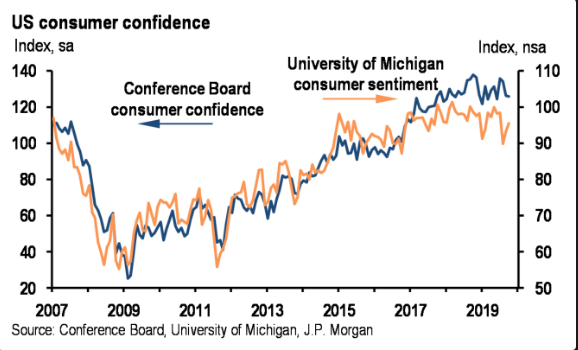
While Housing sector data remains strong and trending higher since the trough in December of 2018, consumer confidence and sentiment has painted a mixed picture. The final October University of Michigan consumer sentiment index fell to 95.5 from 96 in the initial reading. That’s still above its reading of 93.2 in September. The current economic conditions index rose from 108.5 to 113.2 and the consumer expectations index rose from 83.4 to 84.2. Tariffs were mentioned negatively by 27% of respondents which is a 9% sequential decline.
The Consumer Confidence index edged down to 125.9 from a revised 126.3 in September, the Conference Board said Tuesday.
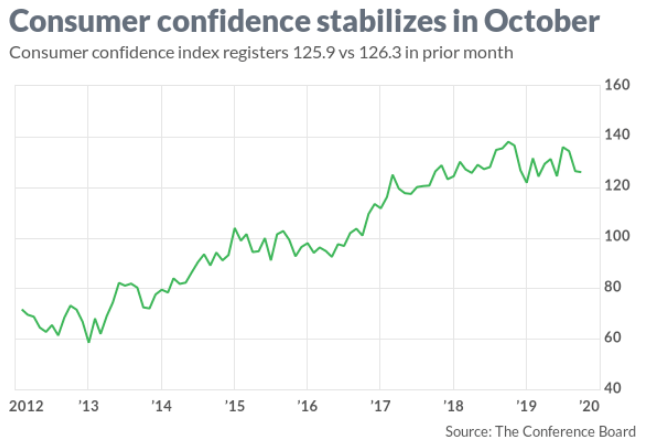
The so-called present situation index rose to 172.3 from 170.6.
“Confidence levels remain high and there are no indications that consumers will curtail their holiday spending,” said Lynn Franco, director of economic indicators at the privately run Conference Board.
Yet an index that looks at expectations six months from now declined to 94.9 from 96.8. Consumers expressed somewhat less optimism about the labor market in light of the recent slowdown in hiring. Here is what J.P. Morgan had to say about the latest Conference Board’s reading on consumer confidence:
- The third straight month of declines
- And the Conference Board measure is now 9.9 pts below its recent peak in July
- Confidence appears to have remained broadly range-bound over the past 2 years, after a notable acceleration in 2017.
In the past few months, the Bloomberg Consumer Comfort index has been showing the most optimism out of the 3 major consumer confidence reports (Conference Board & University of Michigan). In the week of October 13th, the index rose 0.8 to 63.5. That’s just 1.2 points from the July peak which was an 18 year high. Comfort among full-time workers hit an all-time high as the labor market is proving solid real wage growth partially because of the decline in inflation. Sentiment among people in households where the income is $100,000 or more was the best since 2004 when the data started being calculated. Consumer expectations fell 0.5 to 49. As you can see from the chart below, the buying climate rose to a record high reading of 58. That’s great for retailers ahead of the holiday shopping season.
The U.S. economy is undoubtedly a consumer-centric economy for which many indicators still show the consumer is holding up well, given the low levels of unemployment and rising wages. The holiday season is typically the biggest consumer spending period of the year. The National Retail Federation said it expects holiday retail sales during November and December to increase between 3.8% and 4.2% over 2018 to a total of between $727.9 billion and $730.7 billion. The numbers, which exclude automobile dealers, gasoline stations and restaurants, compare with an average holiday sales increase of 3.7% over the previous five years.
Historical holiday sales and 2019 forecast
Holiday sales for 2019 are expected to increase by 3.8-4.2% over 2018
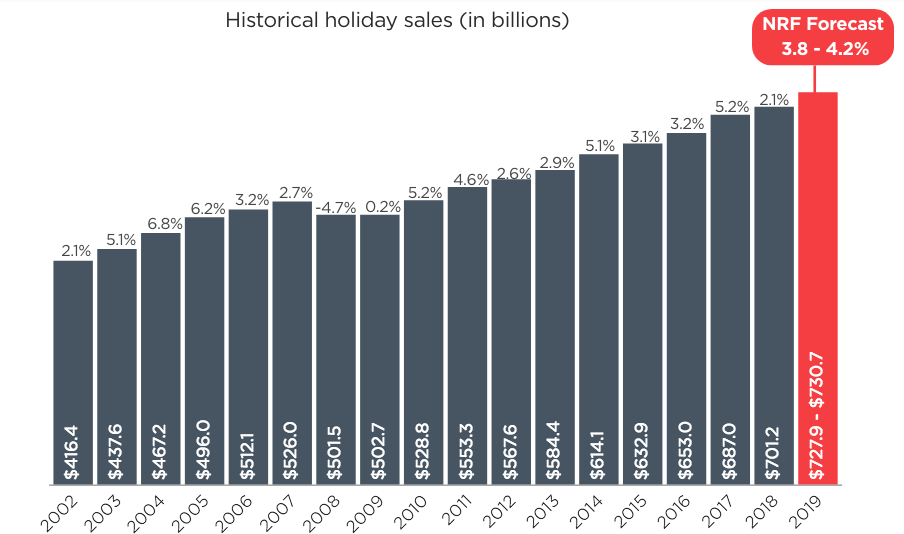
NRF expects online and other non-store sales, which are included in the total, to increase between 11% and 14% to between $162.6 billion and $166.9 billion, up from $146.5 billion last year.
Digital spending during November and December is expected to reach $143.7 billion, up 14.1% from a year ago, according to a study by Adobe Analytics, which tracks transactions for 80 of the top 100 U.S. internet retailers including Walmart (WMT) and Amazon (AMZN).
Cyber Monday sales are expected to hit $9.4 billion, up nearly 19% from last year, Adobe said. Black Friday sales online are expected to be $7.5 billion, up 20.3%. Thanksgiving Day sales on the internet are forecast to surge 19.5%, to $4.4 billion, it said.
The six lost days from the 2018 holiday season will leave nearly $1 billion in sales on the table, according to Adobe. For the first time, the research firm is calling for online sales to surpass $1 billion each day in November and December, because of the pinch for time.
“We fully expect [retailers] to be driving discounts and sales much earlier and much more consistently throughout the season,” said Nate Smith, a product marketing manager for Adobe Analytics. “You are going to see that all through November.”
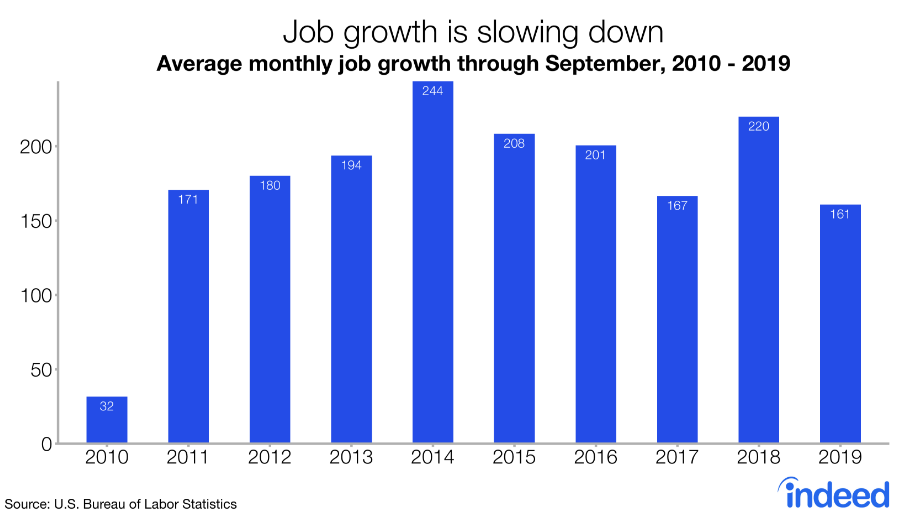
Although job growth and wage growth are both slowing down in 2019, the labor market remains robust and with plentiful job openings for the willing.
The hurdles for which investors/traders are facing Wednesday are indeed high hurdles. Even if these hurdles are overcome and found with the current market trend unscathed on the day, investors will be met with additional hurdles on Thursday and Friday in the way of more economic data and earnings reports. Personal Income and Expenditures is due out Thursday, ahead of the all-important ISM manufacturing index and Nonfarm Payroll report on Friday.


