
Welcome to another trading week!! In appreciation of all of our Basic Membership level participants and daily readers of finomgroup.com content, we offer the following excerpts from our Weekly Research Report. Our weekly Report is extremely detailed and has proven to help guide investors and traders during all types of market conditions with thoughtful insights and analysis, graphs, studies, and historical data/analogues. We encourage our readers to upgrade to our Contributor Membership level ($7.99 monthly, cancel any time) to receive our Weekly Research Report and State of the Market Videos and take advantage of this ongoing promotional event today! Have a great trading week, be in touch, and take a look at some of the materials in this weekend’s published Research Report!
Research Report Insight #1
Investors should bear in mind, however, that seasonal trends do not favor stocks in the back half of January. Weakness has historically accelerated just after mid-month, around the eleventh trading day. (chart below)

Is the weakness due to earnings season or the general buyer’s exhaustion that typically coincides with the end of the Santa Claus rally? Nobody knows for sure, but knowing the seasonal trends aids with level-setting investor expectations. What lay ahead in the coming week/s is less important than what has been accomplished in the previous months and what remains to be accomplished in the months ahead.
Research Report Insight #2
The S&P 500 has been in an unrelenting uptrend the last several months, and it has been noted that when the Equity Put/Call ratio is as low as it has been in the past, there is usually some consolidation of the market’s gains. In 2020 when the Equity Put/Call ratio has dropped below 0.4, the S&P 500 has always fallen or given gains back as outlined in the examples below: (This table was created on Dec. 18, 2020, the market fell 1% three days later: (@Ukarlewitz))
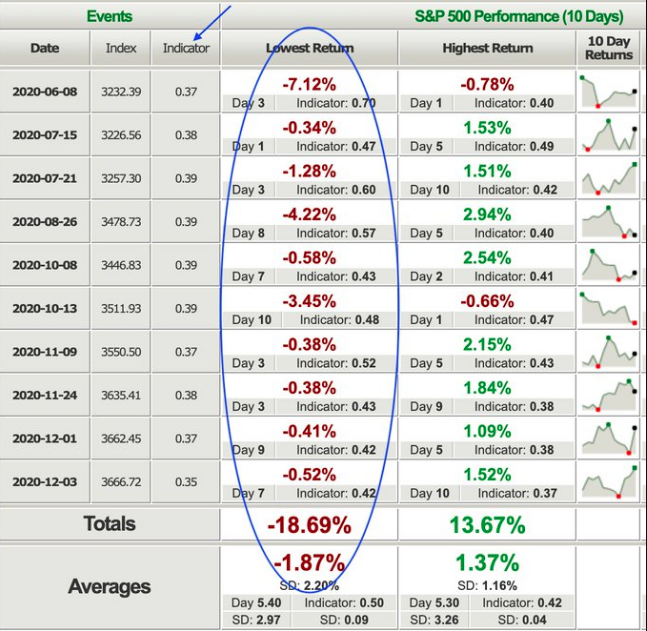
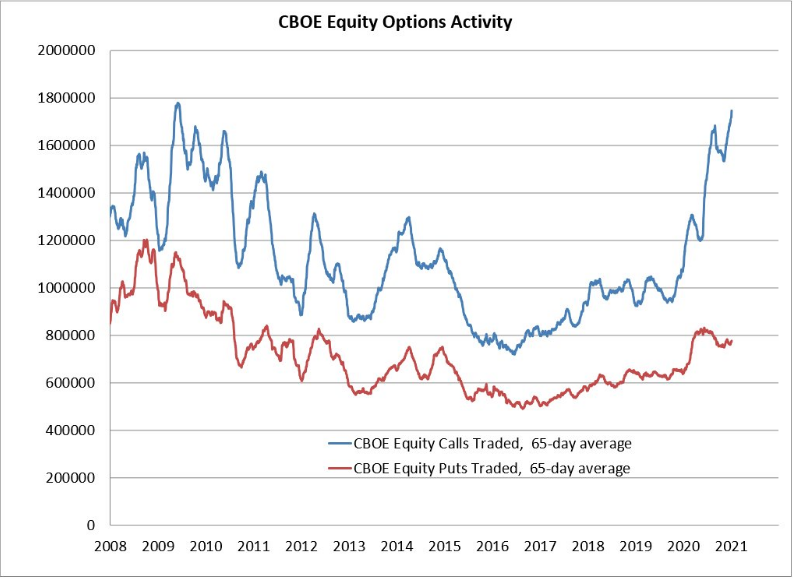
With the data at-hand, however, it should be noted that the super-low put/call ratios of today, which mirror the 1995-1999 period, are being driven by surging call activity, not collapsing put activity. CBOE equity put volume is 20% above year ago levels, but call volume is up nearly 60 percent. So traders are still buying “protection/puts”, but those puts are muted by the tremendous surge in call option buying activity. (put/call activity below)
Research Report Insight #3
When I looked at S&P 500 New Highs minus New Lows surging above 100, I recognized that this identified and validated the uptrend, but it can prove to produce an environment whereby overbought conditions relax a bit in the near-term. Such strong market breadth also finds price becomes increasingly sensitive to headline risk.
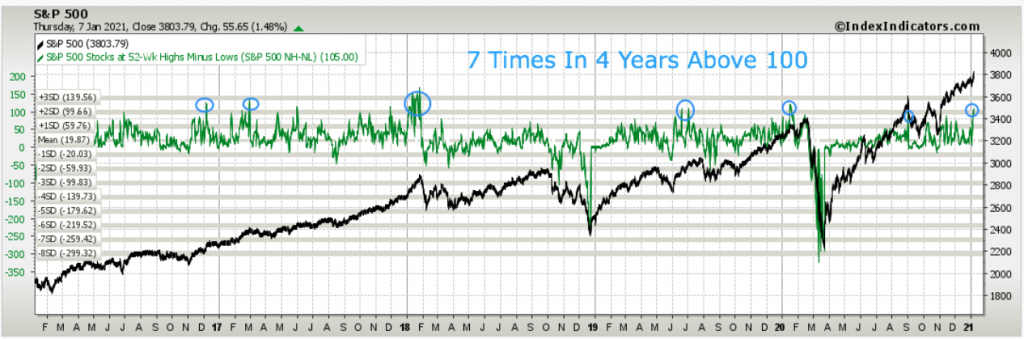
As shown in the screenshot above, I’ve circled every year since 2016 (7 time periods in total) whereby the NH-NLs got above 100.
- Twice it marked significant interim tops (2018, 2020).
- In June of 2020 it also marked an interim top and 8% consolidation that lasted about a week in June.
- Other times in 2016, 2017, 2019 the market just trended higher with only minor disruptions of trend (5% pullback or less).
Another breadth indicator is showing signs of excess strength, the percentage of stocks trading above their 10-DMA.
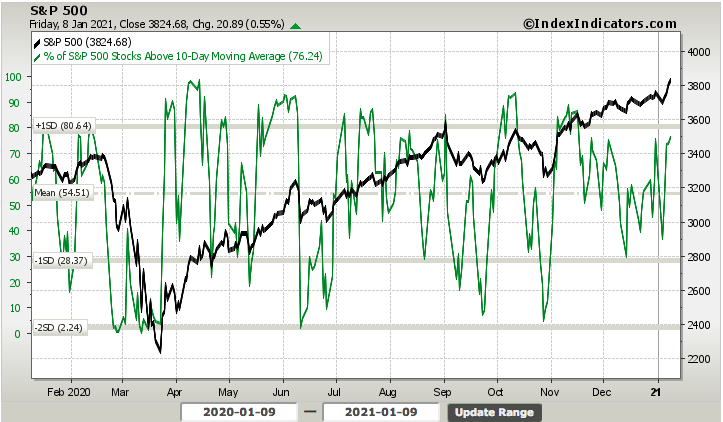
This is the fastest moving average for studying market breadth strength and presently over 76% of S&P 500 stocks are trading above their 10-DMA. Can the percentage move higher? Clearly the indicator suggests it can, but I would be keeping a watchful eye on that 80% level, which may indicate some of that volatility mentioned previously is about to commence. Not a prediction, but rather something to anticipate and take advantage of should it unfold.
Research Report Insight #4
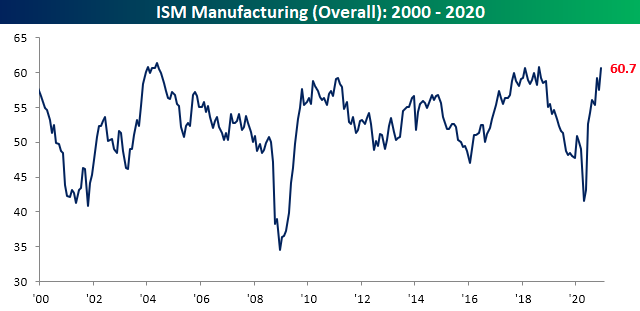
ISM’s Manufacturing PMI for the month of December was quite strong. For the seventh month in a row, the index was consistent with growth in the manufacturing sector. Not only did the ISM’s reading show yet another month of growth, but that growth accelerated as the index rose to 60.7. This was the highest level since August of 2018, as the trade war began. Prior to that, you would need to go all the way back to January and May of 2004 to find readings as high as this past month.
WHAT RESPONDENTS ARE SAYING IN SURVEY
- “Our company and industry are continuing to have tailwinds from the COVID-19 pandemic research support for vaccines and treatments. While our services are delayed, many customers are not cancelling outright, and business picked up for us in the last month — especially in China, where business growth is back on track.” (Computer & Electronic Products)
- “Continued to survive COVID-19 shutdowns, customer restrictions and personnel issues (work from home and COVID-19 outbreaks) and managed to maintain slight growth over 2019.” (Chemical Products)
- “COVID-19 outbreaks are causing supply chain issues for Tier-1 and Tier-2 suppliers. More work needs to ensure suppliers keep us in the loop with any problem in their supply chain. But end-customer demand for products is keeping production and future outlook positive.” (Transportation Equipment)
- “COVID-19 is affecting us more strongly now than back in March. Vendors/service suppliers unable to maintain levels of service due to employee shortages. Logistic issues also hurting us due to coronavirus-related problems.” (Food, Beverage & Tobacco Products)
- “Current business outlook is strong through the first quarter of 2021. We are anticipating 20 percent growth in sales for 2021.” (Fabricated Metal Products)
- “Sales are now slightly above pre-COVID-19 sales.” (Machinery)
- “Sales are now exceeding pre-COVID-19 levels, but uncertainty remains through the winter months while COVID-19 is still rampant.” (Miscellaneous Manufacturing)
- “Business is stronger than expected, with higher demand for many products. Volatility continues due to the very persistent pandemic and associated risks.” (Electrical Equipment, Appliances & Components)
- “Suppliers are having difficulty finding and retaining labor leading to supply constraints.” (Plastics & Rubber Products)
- “Fourth-quarter production improved more than anticipated, both against the rolling forecast and compared to typical Q4 business.” (Primary Metals)
The only indices to fall were those for Exports and Imports, and even those declines were minor.
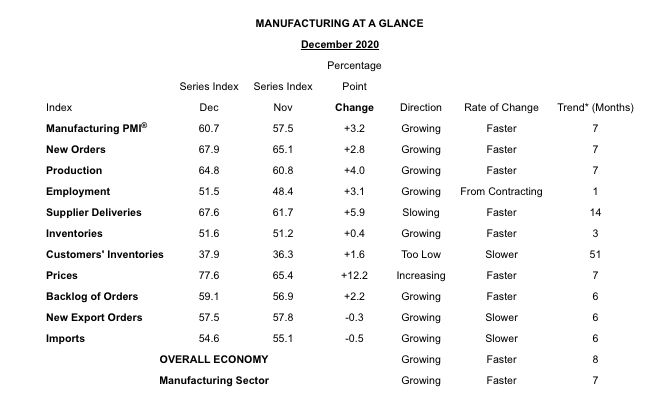
Meanwhile, the indices for Production, New Orders, Order Backlogs, and Supplier Deliveries all came in the top decile of readings of their respective histories. To summarize, overall conditions continued to improve with strong demand and production on the rise to meet that demand. There are some supply issues like low inventories and longer lead times, though and that’s contributing to sharply rising prices.
Research Report Insight #5
The NFP employment report for December showed a 140K decrease in total Nonfarm payrolls.
Some good news in the report came from previous months’ revisions. The change in total Nonfarm payroll employment for October was revised up by 44,000, from +610,000 to +654,000, and the change for November was revised up by 91,000, from +245,000 to +336,000. With these revisions, employment in October and November combined was 135,000 more than previously reported.
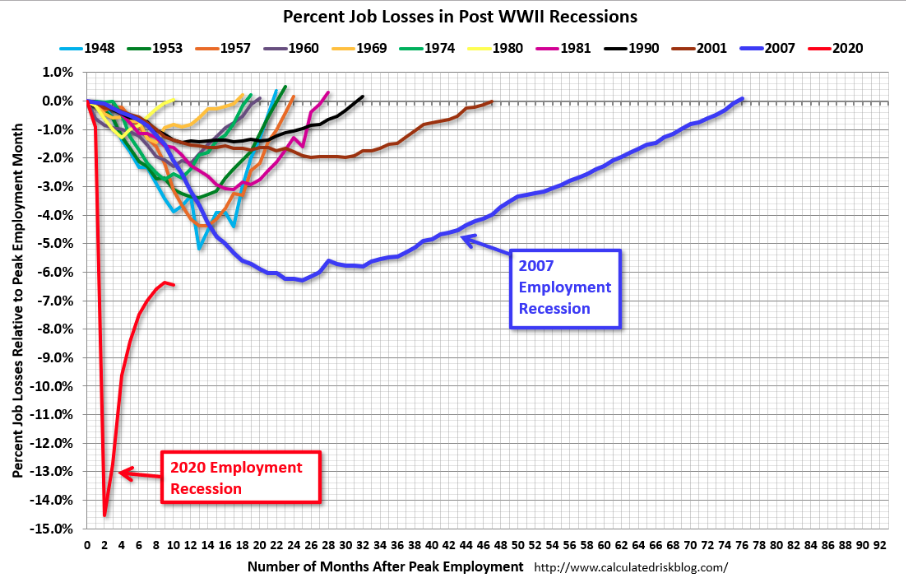
Undoubtedly, the latest round of labor and employment data is being affected by the additional economic restrictions imposed over the lsat 6-7 weeks, across the nation. Nonetheless, the chart of percent job losses for each recession since WWII suggests that this is actually the fastest employment recovery since that time period. The jobs will come back, per the chart, they always do and it is just a matter of “by when”.
Research Report Insight #6
On a side note, because keep in mind that every significant market rally coming out of a recession has held “double-dip recession” and “bubble market” labels, Jeremy Grantham has offered his latest MARKET BUBBLE narrative titled, “WAITING FOR THE LAST DANCE: The Hazards of Asset Allocation in a Late-stage Major Bubble”.

To summarize Grantham’s latest “bubble call”, as he has forecasted 20 of the last 2, here is what he says in his narrative:
“I believe this event will be recorded as one of the great bubbles of financial history, right along with the South Sea bubble, 1929, and 2000.”
Grantham is an unabashed permabear; there is simply no other way to label him. If his latest piece scares the heck out of you, understand that listening to him over the last decade could have prevented you from missing out on a once in a lifetime bull market that proved to be the longest bull market in history!!
- 2010 – Have Cash, Wait for Stocks to Fall
- 2011 – Grantham sees most global equities as ranging from “unattractive” to “very unattractive” – valuing the S&P 500 at “no more than 950.”
- 2012-Jeremy Grantham Warns 2013 Will Be A Dangerous Year For Stocks
- 2013- Much of everything else is once again brutally overpriced
- 2014- Big stock bubble will end badly in 2016
- 2015- GMO founder Grantham says markets ‘ripe for major decline’ in 2016
Not only that, but the guy’s calls are just as good as a coin flip really!
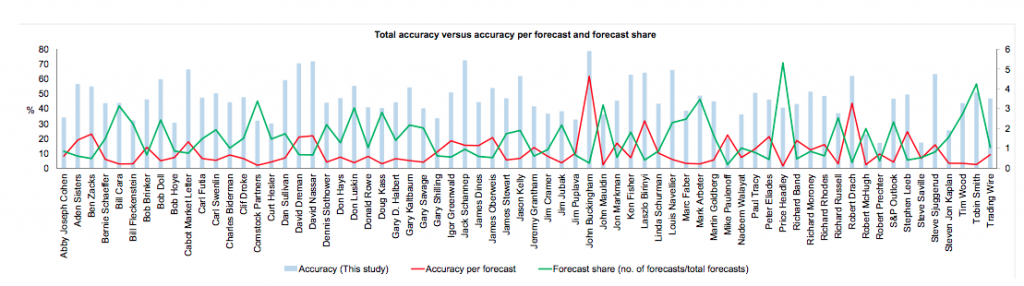
His calls over the last 30 years have garnered an efficacy rate of just 47 percent. So he’s right less than he’s wrong and has achieved less than a 50/50 performance rate with his market calls. Then why does he garner so much attention when he puts out a “hit piece” like this? I don’t know, and I surely don’t plan on spending time worrying about Grantham’s calls, which are the equivalent of fighting the Fed and fiscal policy of the likes never seen before.
Research Report Insight #7
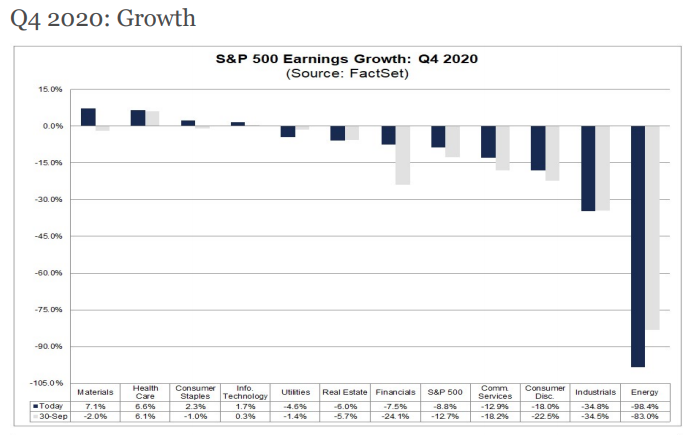
Looking ahead and into 2021, FactSet offers the following forecasts:
- For CY 2020, analysts are projecting an earnings decline of -13.3% and a revenue decline of -1.6%.
- For Q1 2021, analysts are projecting earnings growth of 16.5% and revenue growth of 3.9%.
- For Q2 2021, analysts are projecting earnings growth of 46.1% and revenue growth of 14.1%.
- For CY 2021, analysts are projecting earnings growth of 22.6% and revenue growth of 8.2%.
The current S&P 500 P/E ratio stands at 22.6%, sharply higher than the 10-year average of 15.7 percent. By most metrics, the market is relatively expensive, unless earnings do indeed surpass expectations more quickly.
Research Report Insight #8
My belief, for which has been substantiated by the preponderance of evidence, is that the new Dow Theory is connected to the Software and Technology sectors of the market.
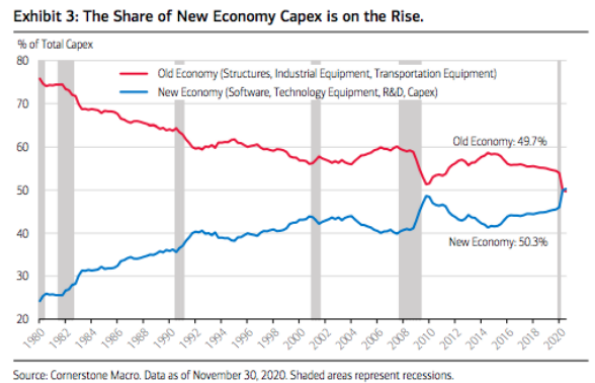
As shown in the chart above, the former split between old Capex economy and new economy was ~52% to ~47% in favor of old economy. The very latest reading at the end of Q3 2020 shows just how relentless software/tech equipment, new economy usurped old Capex economy spending. If I were a betting man, I would not be betting on a trend reversal. “So when they say tech bubble…?” Kind of a longwinded way of saying, “Don’t believe the old Dow Theory hype.” It is not as effective as it used to be.
Research Report Insight #9
The cumulative A/D line is confirming the moves higher in the S&P 500 . The Consumer Discretionary, Health Care, Industrials, Materials, as well as the broader S&P 500 all closed at 52-week highs last week and so too did those sectors’ cumulative A/D lines.
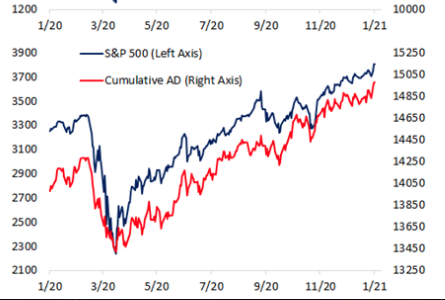
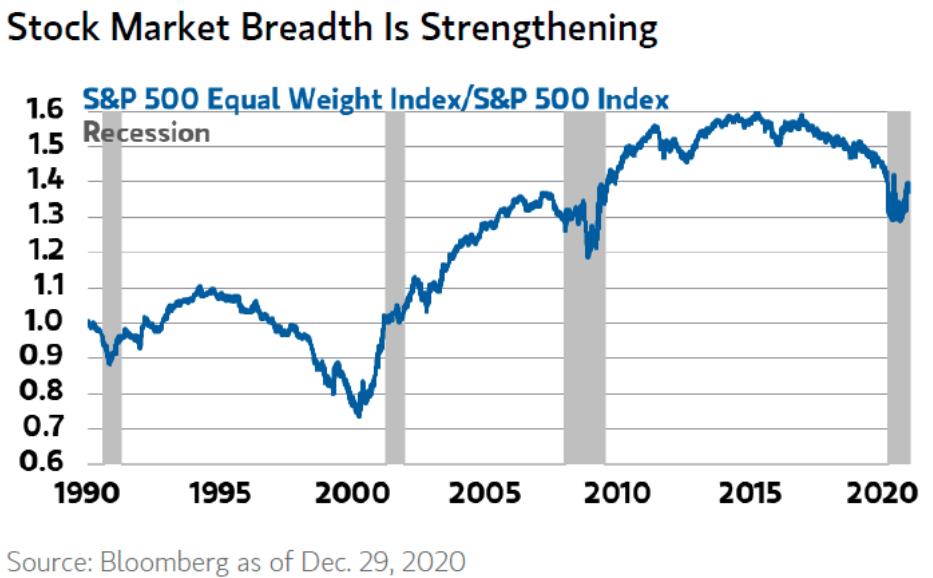
Additionally and historically, when the S&P 500 Equal-Weight Index reverses and outperforms the S&P 500 Index like it has since the market bottomed in 2020, it tends to be a good time to buy stocks. (see chart below)
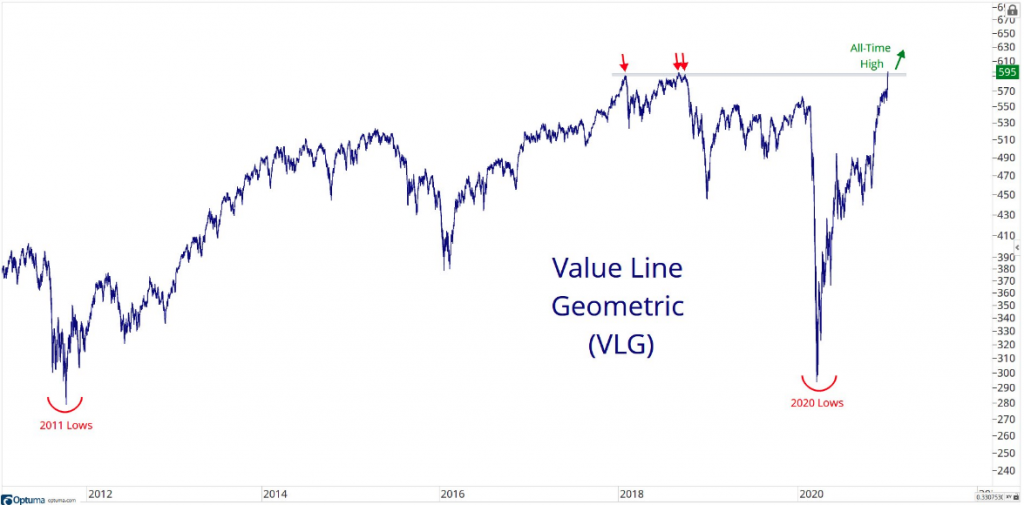
The Value Line Geometric Composite index was introduced on June 30, 1961. It is an equally weighted index using a geometric average. Value Line Geometric Index surpassed its 2018 peak and closed at a new all-time high on Friday this past week.
Thank you for joining us for another trading week and reviewing our weekly “Must Knows”! To receive and review our weekly, full-scale Research Report each Sunday and our State of the Markets weekly video analysis every Thursday, subscribe to our Contributor Membership level at just $7.99 monthly (Cancel any time)! With these two weekly deliveries, you’ll have all the unbiased and fact-driven market and economic data analysis at your fingertips. Don’t make capital allocation decisions based on headlines that brush the surface of what is and isn’t affecting markets. Let our deep-dive analytics supply you with bottom-up and top-down analytics. You won’t be disappointed. Upgrade today!!


