
After investor optimism that supported the largest 1-Day rise in the Dow Jones Industrial Average (DJIA) on Monday and with all major averages rallying sharply, “turn around Tuesday” took on a new form. While the major averages didn’t lose everything they recaptured on Monday, they were all lower by nearly 3% in the trading session. The S&P 500 (SPX) fell 2.81% on the session, back below its 200-DMA and closed just above 3,000 for the day. The back and forth action, outsized daily moves in markets has come with increased volatility and general investor fear/anxieties, as bond yields hit record-low levels.
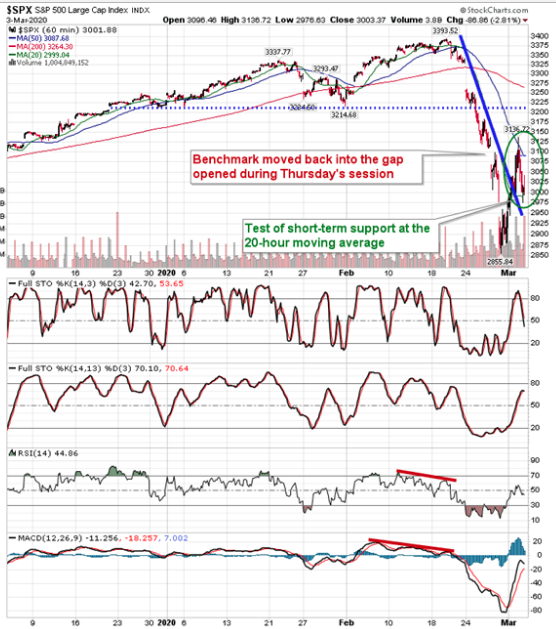
After Tuesday’s market route, not many investors and analysts are providing a near-term optimistic outlook, even though and technically speaking, there are some less negative signs in the hourly chart of the S&P 500 to be gleaned. The S&P 500 has broken that sharp and negative declining trend that was expressed last week. Monday’s session found the benchmark able to advance above the 20-hour moving average, a level that the benchmark also found with a wave a buying momentum into the closing bell Monday. That short-term hurdle is now flattening out, providing support to Tuesday afternoon’s selloff. A hammer candlestick during the 2:00 p.m. hour suggests that traders attempted to defend the hurdle. Confirmation of support around the 20-hour moving average would go a long way in forging a solid short-term low sufficient enough to entice sidelined investors back into the market.
Ultimately, many remain of the opinion that the S&P 500 needs to retest last Friday’s low and significant support from last summer’s lows around 2850. Despite the tumultuous market action over the last 8-9 trading sessions, Tuesday’s session was the first bit of “normal” trading in this panicked market, as investors used the outsized surge in prices from Monday to reallocate capital. In addition to the seemingly hopeful hourly chart analysis, FundStrat’s Tom Lee offers investors a little more hope for Wednesday’s trading session.
“Rally is coming Wednesday AM and if it doesn’t happen, this means stock market is ‘extremely’ not normal. In 40 years, only 4 instances where stocks spent 6 days with less than 10% of names above their 10-day moving averge. 4 out of 4 times, on day 7 (today), we rallied.
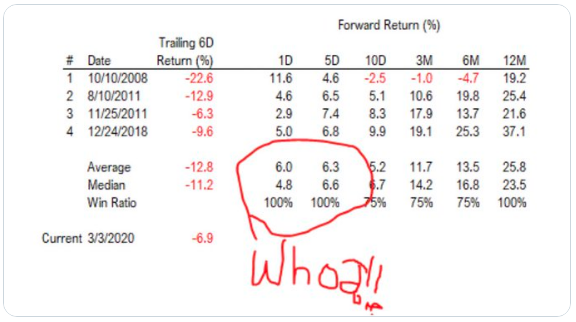
“We are in a new world where systematic trading, zero commission, ETFs .. and virtually frictionless money movement, could make stocks merely a ‘video game.’ “But isn’t valuation a floor? And shouldn’t exhaustion of sellng matter?”
The historic data presented by Tom Lee certainly adds a new piece of information for investors and traders to consider. Possibly most importantly, however, is if the historic data doesn’t bear out, it suggests that indeed this time is different and a pause for greater concern is necessary on the part of investors. Either way, investors will have greater understanding of what kind of market may be to come when the closing bell sounds on Wednesday. In addition to Lee’s notes and statistical findings, J.P. Morgan’s technical analysts suggest a powerful buy signal was offered by markets recently and when the S&P 500 broke down into the 2,800 last week.
“The initial S&P 500 rebound from support in the 2800s stalled after meeting the 3116 Feb 27 gap and other resistance at 3124. While realized volatility is likely to remain high over the near-term, the Feb 27 buy signal has some of the most powerful statistics of any of the systematic strategies we have created to date. The projected price action suggests that any subsequent weakness below 2900 represents a buying opportunity for a trade into late-Mar/early-Apr. Key chart resistance now rests at 3188-3214.”
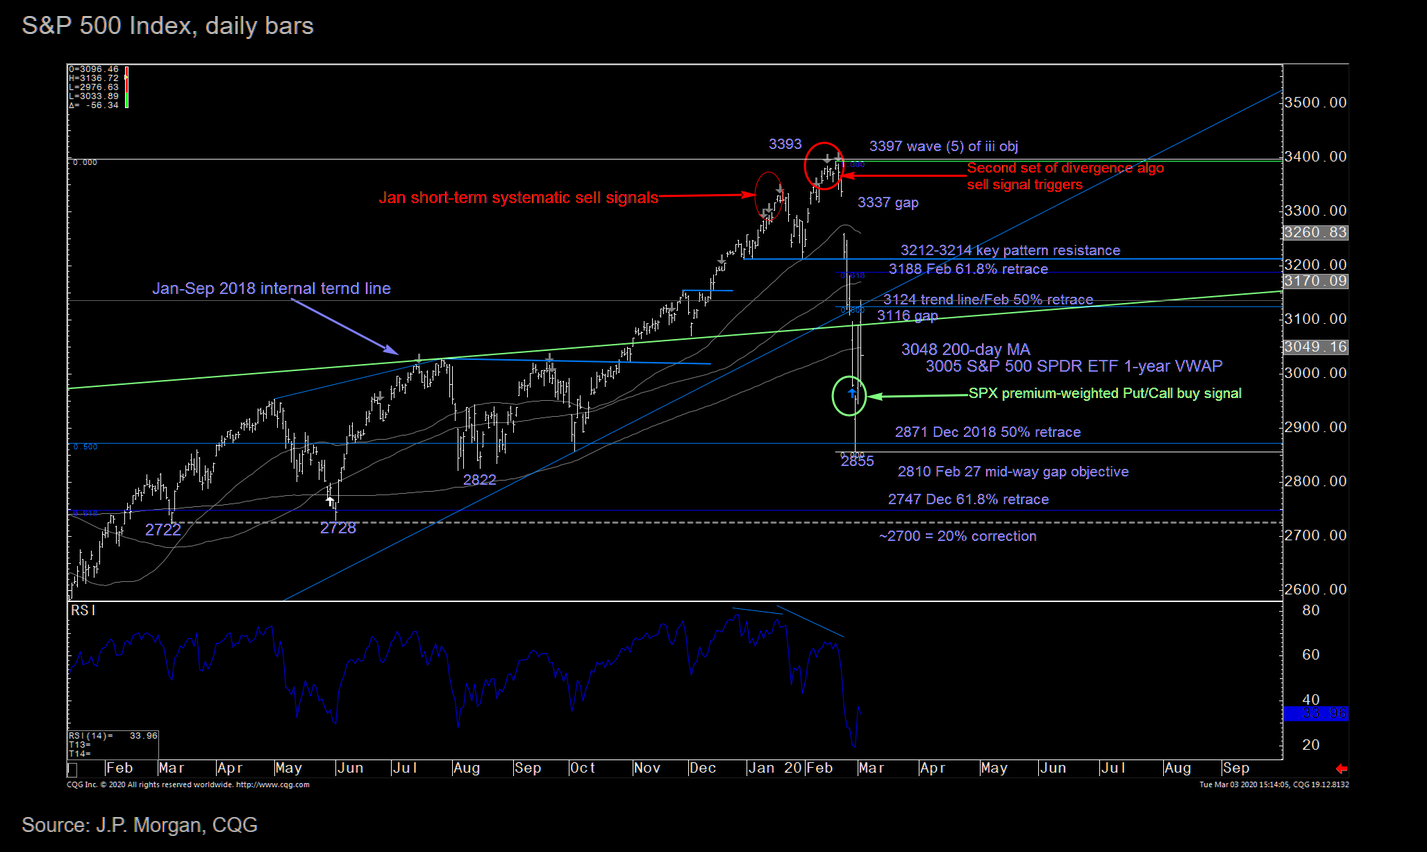
There’s a lot to consider within the J.P. Morgan technical buy signal and analysis. It suggests there remains the possibility to retest last week’s lows, but suffering through any additional pain has a high probability of reward over the next couple of months.
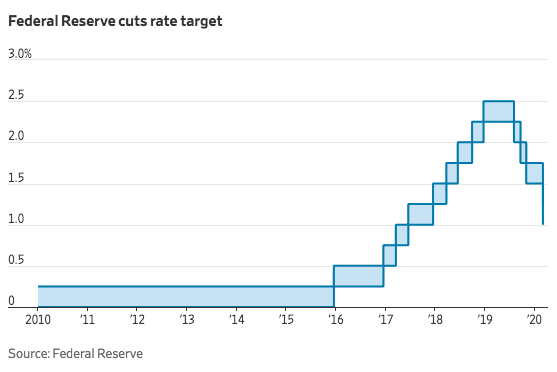
Harkening back to Tuesday’s action; what just happened? Around 10:00 a.m. EST, the FOMC announced a 50 bps rate cut, effectively lowering the Fed Funds Rate (FFR) from 1.50-1.75 down to 1.00-1.25.
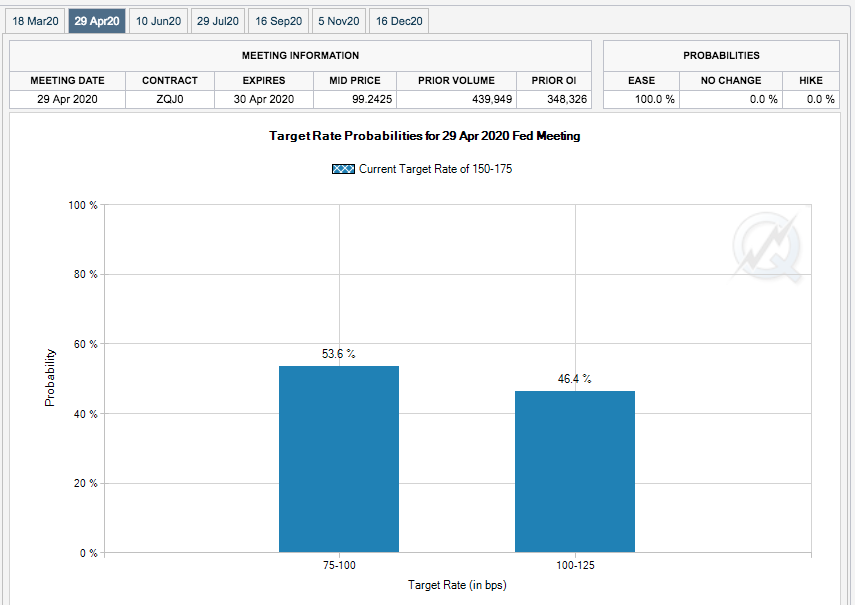
And they may not be done yet based on both Fed Fund Futures (FFF) as well as the continued decline in Treasury yields. Beyond the 50 bps cut on Tuesday by the U.S. central bank, FFF are baking in more rate cuts as early as April 2020. J.P. Morgan, however, believes that the emergency rate cuts issued on Tuesday, will not stop the Fed from once again lowering rates come the March 18th meeting that lay ahead.
- JPM: We now see the next 25bp cut at the March meeting and continue to see a risk the Fed cuts all the way to the 0% effective lower bound
- We examine the six previous instances of inter-meeting eases during the modern monetary policy era.
- In all but one instance, the Fed followed up its inter-meeting cut with an ease of the same magnitude at the next scheduled policy meeting.
Equity markets largely dismissed the rate cut put forth on Tuesday, as it’s widely known that the Fed is mainly responding in a manner to provide support to financial conditions and business confidence. It remains to be seen just how effective the rate cuts will prove in time.
“A rate cut will not reduce the rate of infection. It won’t fix a broken supply chain. We get that,” Mr. Powell said. “But we do believe that our action will provide a meaningful boost to the economy.”
Policy makers decided that the coronavirus presented “evolving risks to economic activity” and justified a rate cut despite strong economic fundamentals. In the also-short press conference, Chairman Jerome Powell noted supply chain and travel-related challenges. The spread of the virus in U.S. cities made further disruptions more likely. A rapid response was judged appropriate.
Moreover, the market’s response to the Fed’s rate cut may not have reflected disappointment with the Fed. It is reasonable to believe that Monday’s rally reflected the anticipation of the Fed rate cut and with that cut in hand market participants re-positioned and shifted focus back on the economic implications of the coronavirus, which remain uncertain and as more and more U.S. corporations warn on Q1 results. Here is what Fed Watcher Tim Duy had to offer with regards to the market’s response to the cuts and the potential path forward for markets.
“Given the lack of clarity, a risk-on environment will not come on the back of rate cuts alone. Easier policy is needed to support financial market function and create the accommodation that will support a return to activity when the crisis ends. But it might not diminish risk aversion in the near term. For the time being, we may be a in a one-step forward, twos-steps back phase of market reactions to news and policy.
Eventually, that will shift back to two-steps forward, one-step back. There will be another side to this crisis. We just can’t see it yet. If you are looking for some optimism, Bloomberg reports that rising pollution levels in China indicate the country is getting back to work.”
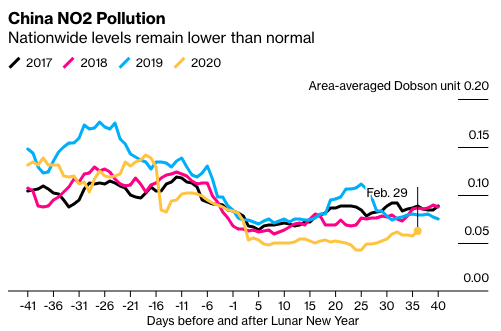
“Though the measure of nitrogen dioxide in China’s atmosphere has risen nearly 50% from Feb. 17, it’s still roughly 20% below the equivalent period last year, according an analysis from the Helsinki-based Centre for Research on Energy and Clean Air, which used satellite data from NASA.“
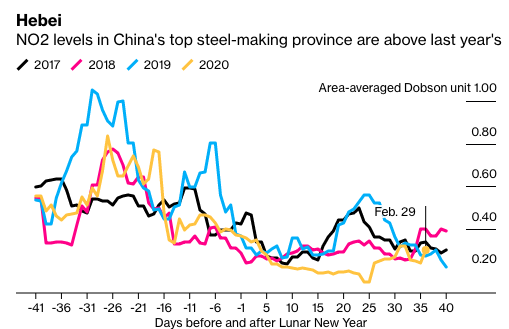
Provincial-level data can offer insights into specific industries, which often cluster by region. In the northern province of Hebei, which is China’s top steel-making area, NO2 levels have risen above the equivalent period last year, suggesting a partial recovery.
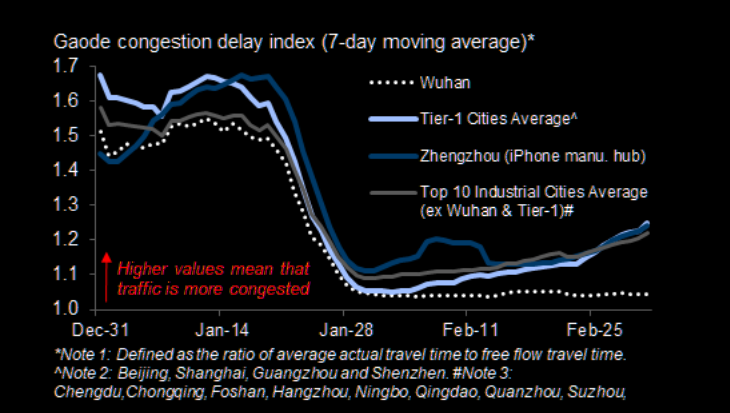
Goldman Sachs is also suggesting that China commerce and transportation is getting back on track. Traffic in Mainland China Tier-1 and major industrial cities is recovering further, while that in Wuhan remains muted.
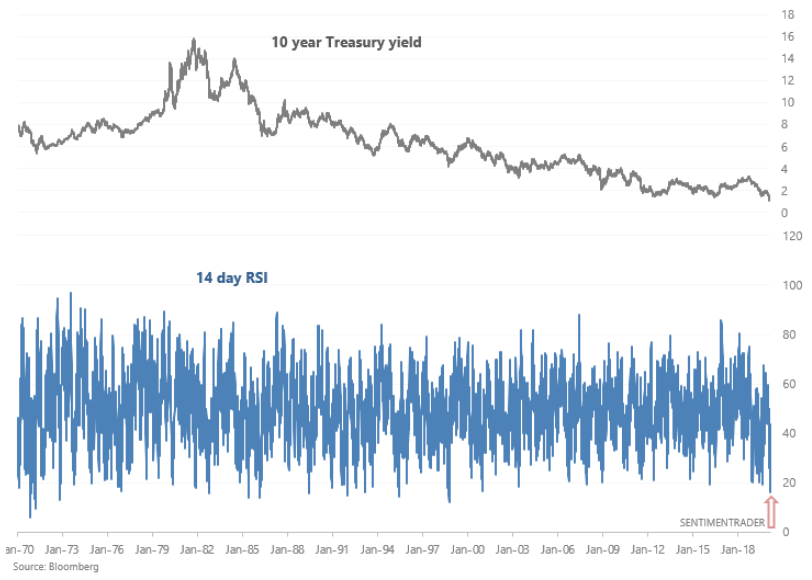
As we revisit the Fed’s action from Tuesday and look ahead, it’s impossible to ignore the headlines surrounding the precipitous decline in Treasury yields as bond price hit record levels. The 10-year Treasury yield broke below 1% for the first time ever in the wake of an emergency rate cut. The yield on the benchmark 10-year Treasury note fell more than 11 basis points to an all-time low of 0.906%. The yield on the 30-year Treasury bond was also at a record low of 1.601% on Tuesday.
Treasury bonds have surged, and the 10-year Treasury yield’s RSI is now extraordinarily low (almost at 16). When the 10 year Treasury yield’s RSI was this low in the past, the S&P 500 rallied ALMOST EVERY TIME 1 month later & 2 months later, according to SentimenTrader.
These are rare and record setting times indeed. With a flight to safety in U.S. Treasuries, risk sentiment may not improve without greater certainty on the economy and when the proposed coronavirus risk to the economy abates. Scott Minerd of Guggenheim suggests now is not the time to add risk given the heightened degree of uncertainty.
“It would be premature to do anything in a significant way to ramp up risk,” Guggenheim Partners Global CIO Scott Minerd said Tuesday on CNBC’s “Halftime Report.” “We need to find out where the bottom is here. … Our target for the 10-year note is 25 basis points and long bond at 1%.”
Regardless of the caution noted by Minerd for the near-term risk assessment and risk-taking activities, one thing is less uncertain and that is where the greater risk/reward is indicated longer-term. The past few days have seen the S&P 500’s dividend yield rise to some of its highest levels in over a year. This leaves the S&P’s dividend yield at 2.1% as of Tuesday. That means holding the various levels of risk and other factors constant, stocks are yielding over 1% more than the 10-Year yield. (Chart from Bespoke Investment Group)

Since the mid-2000s, the spread between the S&P 500’s dividend yield and the 10-year yield has only moved above 1 on one other occasion, and that was near the depths of the Financial Crisis in December 2008. Harkening back to the Great Financial Crises, we all know what happened to the price of risk assets since the low in the S&P 500 of 666.

We couldn’t propose that the risk premium will improve much more from here, and trust us when we say that if it does, it is likely a bi-product of worsening equity market conditions. Nonetheless, the best returns over time are found when equity market conditions weaken and corrections develop. If history offers any lessons, 4 of the 10 examples in the chart below have been in a market decline of 20% or more without triggering a recession.
What it may mean for investors
- Although coronavirus increases the risk of a possible U.S. recession, we do not believe this is the beginning of the next recession. There remains a small window of opportunity for an actual recession, given warmer months ahead that don’t promote the spread of the virus to any significant degree. Additionally, measures already taken and ongoing, should reduce the spread while China’s economic output normalizes and means of manufacturing are reengaged.
- We fully acknowledge that modeling the range of potential scenarios for this type of viral outbreak is imprecise because the unknowns make the range of possibilities wide. We continue to monitor the equity markets.

As we look forward to the trading day and more economic data, we also anticipate monetary policy responses from other central banks. Thus far, we’ve seen several central banks cut rates, but we anticipate more are forthcoming. The European Union finance ministers, however, are unlikely to decide on any concrete action in response to the coronavirus outbreak at their teleconference on Wednesday, as the call is meant to be mainly a stock-taking exercise, three EU finance officials said.
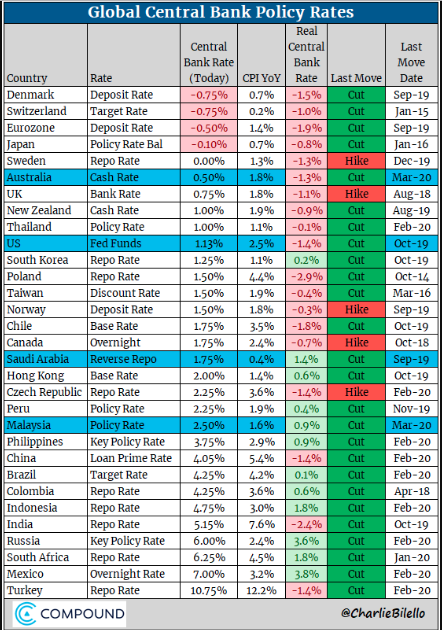
Global Central Bank Update:
- Fed Cuts rates 50 bps to 1.00-1.50%, now 1.25% in cuts since July 2019.
- Saudi Arabia follows Fed in cutting 50 bps to 1.75%
- Australia cuts rates 25 bps to all-time low of 0.50%.
- Malaysia cuts rates 25 bps to 2.50%.
It’s been a bumpy ride of late for investors and traders alike and everyone seems to have a critique and opinion on all things market related. One thing remains true, however, “Nobody knows for sure.” While the historic data says this, that and the other, future market performance may not mirror past performance. There’s always a curve ball, a new wrinkle in the economy for the market to discount and this time is no different in that sense. The variable is different and new (coronavirus), but it is just another variable. The market will get beyond the issue of the moment. The question is whether or not investors/traders will exercise prudent disciplines to benefit from the improved risk/reward paradigm in the future. In volatile markets, it behooves investors to behave and perform in a manner that allows for the reaping of benefits in the future and once the volatility subsides, as it always subsides. But speaking of market volatility…
There have been 10 days where the S&P 500 has risen or fallen by greater than 1% in a given trading session in Q1 2020.
- According to DataTrek: Last year, there were a total of 38 one percent days compared to the annual average of 53 over the last 6 decades. That means after just the first two months of the year, the S&P has already had over a quarter (26%) of last year’s total one percent daily moves and is also almost a fifth (19%) of the way to the annual average.
- The Q1 average for 1% days is 13 back to 1958 (first full year of data). Given that there have already been 10, there will likely be an above average number of +1% days this quarter. Under normal market churn, there should be one +1% daily move a week, so volatility has started the year above pace.
- Today is a good reminder that +1% days tend to cluster together, whether it be to the upside or downside.

“History says it usually takes at least a few quarters with above average volatility to get to one in which the number of +1% daily moves is two standard deviations away from the average, signaling enough market distress to call a bottom. That means this above average volatility environment could last with us for several months. The good news is if the economic impact of COVID-19 is bad enough to get us to an especially volatile quarter (+33 greater than 1% days), the market has usually bottomed during these kinds of quarters in past market downturns. Of course the Financial Crisis was a more extreme case hitting above this level 4 quarters in a row between the back half of 2008 and first half of 2009, but even during that case it bottomed during the third month of that streak (Q1 2009).”
While we know that market volatility will subside, we can’t signal that it will do so and remain in a state of complacency at the moment. This is mainly given the fact that the economic uncertainty is manifesting itself in equity and bond markets. Additionally and purely from a technical standpoint, the S&P 500’s retracement below the 200-DMA once again forces us to recognize the probabilities for a retest of last week’s lows.
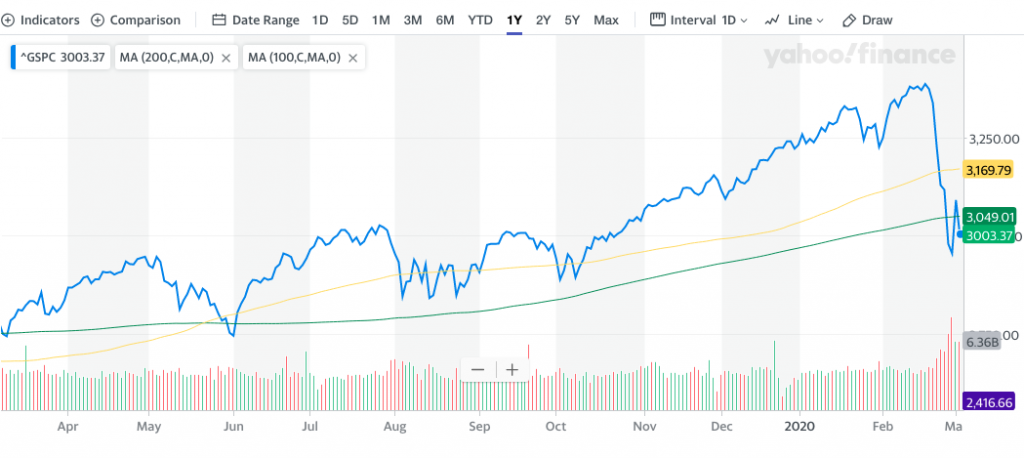
Since 1980, the S&P 500 has closed above its 200-DMA and then crossed back under the next day 34 times. According to Thrasher Analytics, the prior low was tested often 10 days later, but was higher 3 months later 70% of the time. Again, this begs of investors and traders to look beyond the current market volatility and toward the future, but with processes, routines and prudent rebalancing in mind today. Having said that it is also statistically relevant to reflect on the facts. The facts are that both January and February ended in the red.
When stocks are lower in both January and February, the full year is down nearly 5% on average. Add this to the things to worry about in 2020, says Ryan Detrick of LPL Financial.
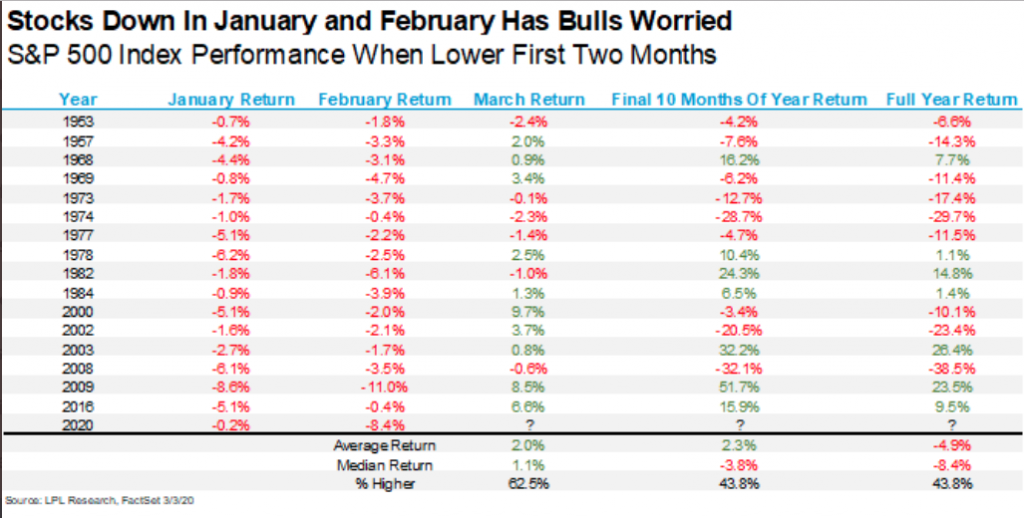
Of these examples in the table, fortunately only 1 dating back to the 1980s was a reelection year (1984). In that year, the market actually finished higher by 1.4 percent.
Heading into the Wednesday trading session, U.S. Treasury yields continue to trade lower, but U.S. equity futures are sharply higher and following the lead of European indices. Key economic data of the day will highlight the strength or weakness of the labor market as investors and economists await the ADP private sector payroll report and ISM non-manufacturing index.
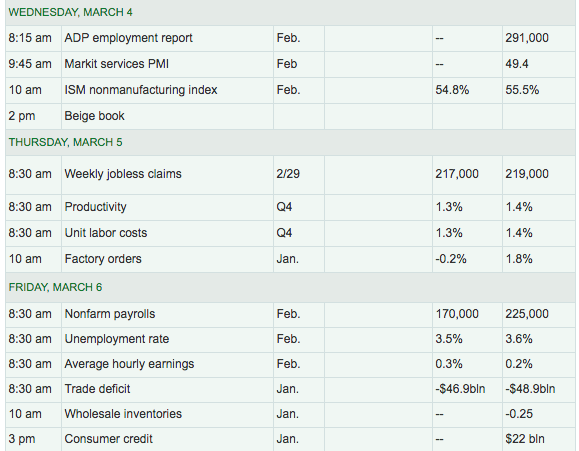
Weekly jobless claims highlight the economic data calendar on Thursday, for which many will be looking for any material impact wagered by the coronavirus on the health of the labor market. To this point in the headline cycle that is surrounding COVID-19, the jobs market has remained healthy. We will find out in the coming weeks jobless claims data whether or not job layoffs are increasing as the service sector gets dinged from weakening travel and service related industries on a global basis.
We encourage active portfolio management during times of uncertainty and to a point where ample liquidity is found for comfort. While market and economic uncertainty are abound, that does not mean that investors have to be found for similar anxiety expressions. Trade safely, cash is your friend and investing isn’t a competition. The returns are yours, but so are losses and as such we refer to the statement that cash can be your friend during such times of market angst.
In the interim, Finom Group is of the opinion that the March 10 timeline that China has referred to as a date for lifting commerce and travel restrictions will prove a meaningful step toward greater economic and market certainty. As such, we’ll continue to monitor the already improving commerce and traffic conditions daily.

Traffic in Shanghai had mostly returned to normal after the city had been at a crawl just a week prior. Reporting on the ground has seen a slight tick up in the traffic and pollution data, but not enough to suggest things are back in full-swing though that could quickly change once the latest data is released.


