
It is hard to find a “talking head” in the media that isn’t able to justify the persistent rally in the major indexes and more recently the Dow Industrial Average crossing 25,000. In short, they are always able to offer that the end is justified by the means. With the end being Dow 25,295 as of Friday, Jan. 5, the means or explanation has been the potential readjusted earnings outlook higher. But who cares about the Dow Industrial Average anymore right? I’d certainly concede to the inherent sentiment displayed for what equates to 30 equities, but it doesn’t mean there isn’t a broader sentiment similarly displayed for equities within the S&P 500 index.
The S&P 500 is currently expressing lofty valuation levels as well or along similar lines to that of the Dow Industrial average. By no means is an S&P 500 PE of 26.36 as of Jan. 5 the most extreme valuation in history, but it is an outsized valuation historically. As it were with our brief narrative on the Dow Industrial Average, there is a rationale to support the seemingly expensive S&P 500 valuation. Regardless of what measuring stick one uses,the markets are decisively overvalued. The key word in that sentence is overvalued and I’m about to offer a complete contradiction to that statement which is lacking context. The context for investors that is of greatest consideration is and will likely always be yield.
Investors don’t seek out lesser yielding investment opportunities; they seek out greater investment opportunities, which carry with them the greatest or greater yield. It’s the very reason equities would still be considered richly valued if one shaves 2,3, or even 4 percentage points off of the S&P 500 PE ratio. Yield is what investors seek and it simply can’t be found in greater quantity than the equity markets today and in recent years. The S&P 500 is currently yielding above 5 percent. The treasury market, well, go ahead and double the 10-year T-bill and what does that get you? As I wrote in my previous research report to Finom Group clients titled Markets Can Trend Higher in 2018, Can’t They?, markets can trend higher in 2018 and they certainly have to date. Moreover, long-term investing is and/or should include a level of risk management. With the current S&P 500 PE ratio above 26 and 14 months without a pullback of even 3% it is still very prudent to exercise reasonable risk management. And if you think I couldn’t be any more verbose, contradictory and long-winded, just keep reading.
As a 19-year veteran of the markets, I’ve seen a lot of strange market occurrences. From the dotcom crash to the flash crash, from the 9-11 crash to the Financial Crisis calamity, I’ve seen it all and born witness to managing investments through such strange market events and market cycles. The one aspect of investing that I’ve come to best understand and participate according to is the aspect of time or the value placed on that time. In this narrative I’m valuing time at a premium, my greatest consideration when it comes to the monies I desire to invest over the course of 2018. Time has the greatest quantitative value presently given the duration of the year and as a portfolio manager. Additionally, it becomes important to denote that timing and time have two distinct differences in this consideration. But establishing a 19-year track record requires an investor’s thought process. Having or utilizing the thought process of an investor, the valuing of time, actually feeds into more profitable trading or timing…over time of course. If investors are active and liquid, the markets will always breed opportunity.
Valuations or valuing assets aren’t the be all and end all of market participation. In fact, valuations exert very little gravitational pull on the markets. But over time and like Father Time, valuation always wins out.
Next week is a pretty important week for the markets, which are coming off a shortened, but spectacular first trading week of the New Year. Earnings season will begin with the Financials on Friday. We’ll also see the delivery of key points of economic data from the December 2017 period.
Key economic indicators regarding inflation are due out on Thursday in the way of the Producer Price Index and Friday by means of the Consumer Price Index. I’d pay closer attention to the CPI number, which has come in weak for the bulk of 2017. Inflation has remained “stubbornly” low to utilize the Fed’s characterization. Seth Golden, of Finom Group, describes inflation as transitory and of little consideration long-term.
Pull up a chart of the 10-year Treasury yield; what does it do over time. What is inflation if the reality is that it exists by terms of transition and not normalcy?
While that statement is evidenced over time and in the way of persistently lower yields over time, given the state of the economic cycle that expresses stubbornly low bond yields and CPI or PPI readings, a transition to heightened levels of inflation could spook market investors and deflate equity sentiment.
Last, but certainly not least in the way of economic data points next week, will be Friday’s release of Monthly Retail Sales. Retail sales readings have been strengthening as of late and individual retailers reported strong holiday period sales last week. Consumer sentiment readings hit 17-year highs in November of 2018. November 2017 Monthly Retail Sales blew away the .3% growth expected with a .8% print. The expectation for December retail sales is to show .5% growth. When the Commerce Department releases the figures, there will likely be a revision to the November reading.
For those whom are weary of brick and mortar retailers that found their metric results in decline for much of 2017, IBUY is a newer ETF by Amplify. The ETF has risen some 70%+ since its market introduction in May of 2016 and by over 40% in 2017 alone. IBUY is a consumer discretionary ETF focused on online retailers. The companies in the ETF range from large cap names like Amazon (AMZN), eBay, Alibaba (BABA) to those no smaller than $300 million in market cap, which, given that the ETF uses a modified equal weighting scheme, puts the average market cap of the holdings in the Mid-Cap range. The corporations in the ETF must achieve 70% of their sales online to qualify for the ETF. The risk profile of the ETF is elevated, but the ETF holds fewer than 45 stocks and as such a lot of the risk with the smaller holdings is diversified away.
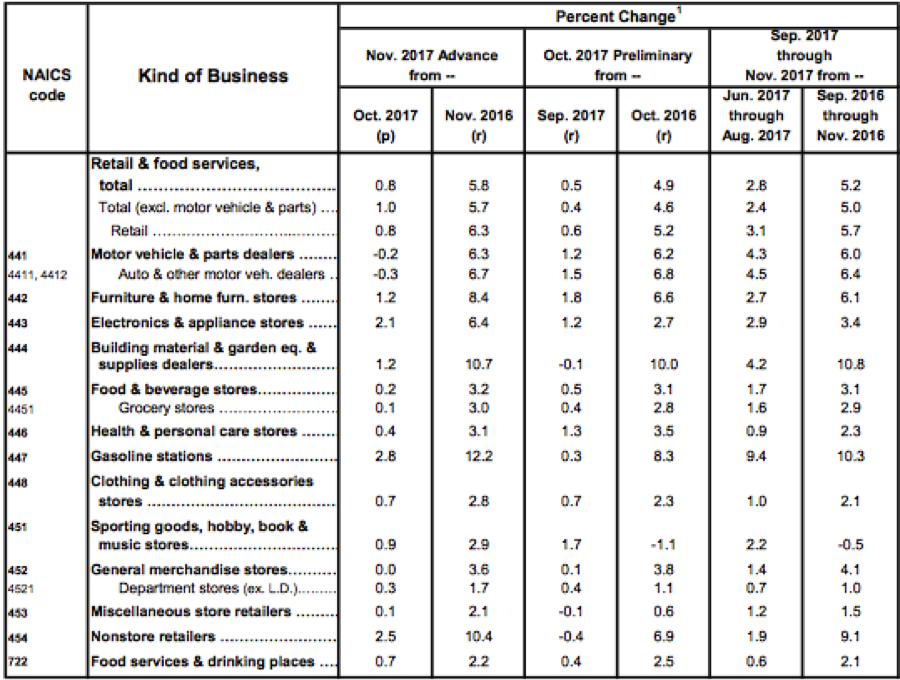
When reviewing the Monthly Retail Sales report delivered on Friday of next week, a more important line item will come from the reading on Department Store sales contribution to the totality of retail sales. Department Store retail sales have fallen YOY and over the last couple of years as measured by the Commerce Department. This has also been displayed in the metric results and share prices of individual department store retailers.
For our full scale report on market valuations, risk management, joining our chat forums and insights into our investment strategies in 2018, feel free to visit us at finomgroup.com and grab your premium subscription today!


