
The last time the S&P 500 achieved a record high was in September of 2018, which is before the most recent new high. After more than seven months, the S&P 500 Index notched a fresh all-time closing high of 2,933.68 on April 23, 2019 and before a modest pullback on Wednesday the 24th of April. In the grand scheme of things, 7 months is not a very long period of time, but it certainly may have seemed to be given that within that period the S&P 500 fell by 20% before rebounding roughly 25% thereafter. So what happens next to the S&P 500 after it achieves a record high?
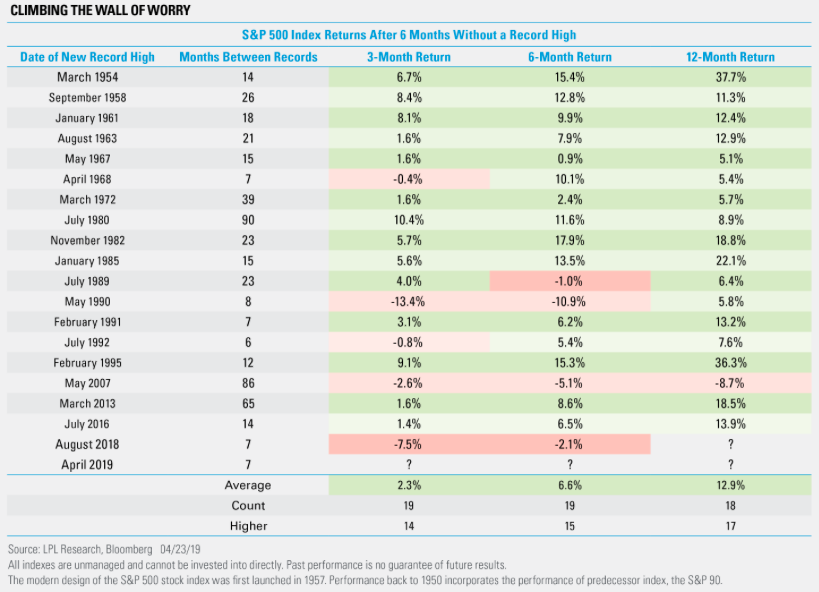
As shown in the chart above from LPL Financial, the S&P 500 has climbed an average of 12.9% in the 12 months after snapping at least 6-month long record high drought, based on data since 1950. Of course, history doesn’t always repeat itself, but it’s always beneficial to understand the probabilities for the future.
With the S&P 500 and Nasdaq 100 making new record closing highs and all-time highs, there’s a good deal of chatter among investors concerning the negative breadth divergence residing within the indices. In other words, as the markets achieve new highs many investors have recognized that fewer stocks are making new highs alongside the indices. The following chart depicts this circumstance:
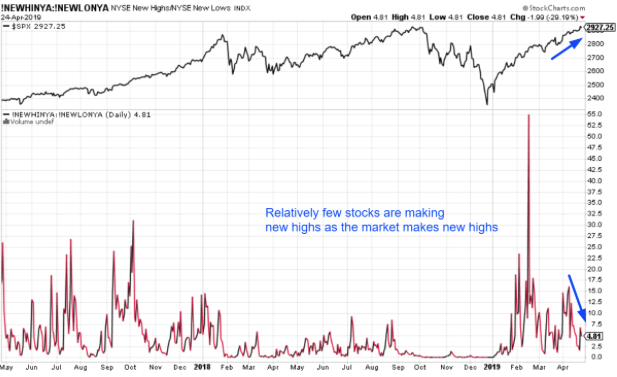
Using the chart above that depicts the NYSE new highs vs. new lows, when the ratio was less than 10 we can see how the S&P 500 performed going forward in the following table from Troy Bombardia:
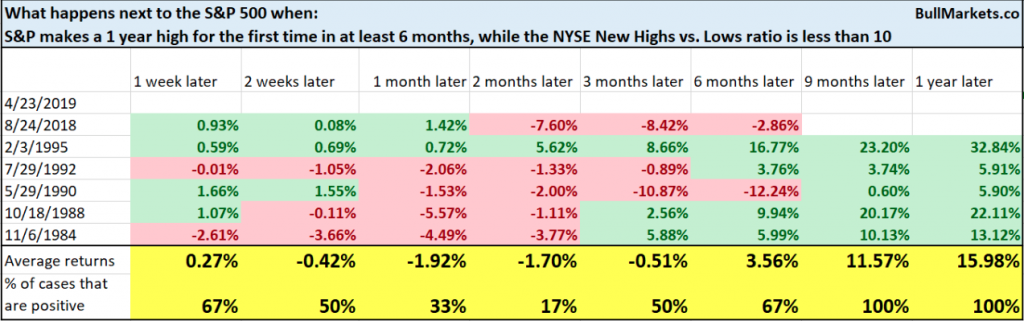
In the near-term time period, the market has proven a mixed performance and somewhat negative, giving rise to the probability of a pullback. Going out 6,9, and 12 months, however, the market tends to perform quite bullishly. Moreover, when we look more closely at market sector performance, we come to realize that most of the sector weakness resulting in some of the weakening breadth of the market has centered on the healthcare and utilities sector.
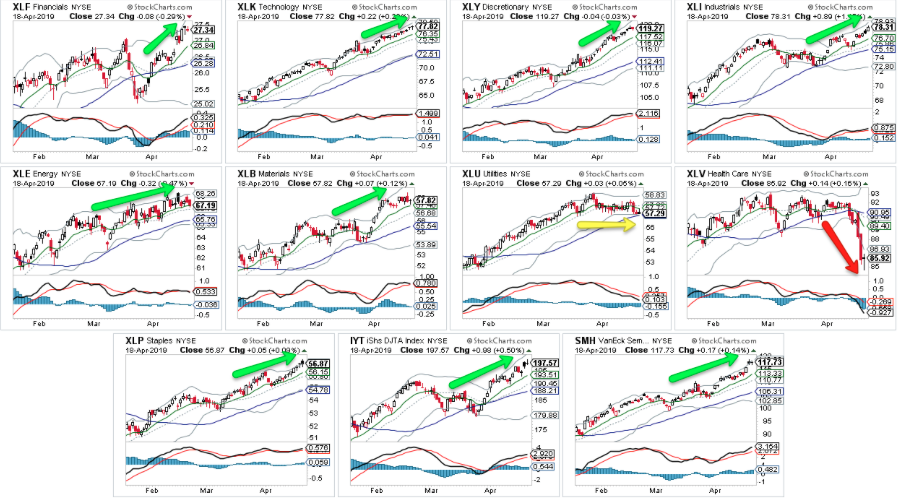
In fact, to the extent there has been any weakness, it is almost exclusively explained by the healthcare sector. The others, aside from utilities, have all reached new YTD highs in the past week or so.
The state of the equity market rally carries with it the same disdain that it always does. Permabears are always in the business of finding the erroneous flaws of the bull market. Whether it’s breadth divergence, Case/Shiller PE ratio or market correlations proving unusual or unfavorable, every bull market rally will be picked apart by permabears and as it has always marched higher. In speaking of market correlations, Finom Group surmises this aspect of the trading environment every morning in our Trading Room with active members. One such market correlation we always highlight is the S&P 500 vs. 10-yr. Treasury Yield.
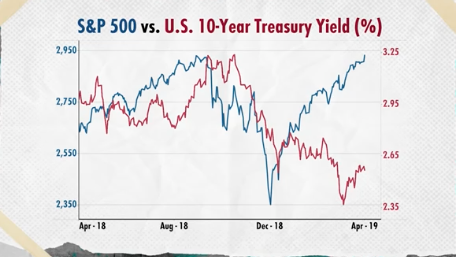
As the equity market rally carried on through the Q1 2019 period and into April, the bond market rallied in kind. This is not “as unusual as one might think”, but nonetheless is understood to be a disconnect from typical market correlations that usually find investors seeking bonds for safety and equities for higher risk exposure.
“Normally, you don’t see that because people interpret lower interest rates as sign of slower growth,” said Donald Ellenberger, senior portfolio manager at Federated Investors.
“Usually, it means the stock market is expecting strong growth and the bond market is expecting recession and one has to be right and one has to be wrong,” he said. “I don’t think that is the right way to look at it — they are both responding to the Fed.”
As the calendar turned from 2018 to 2019, the Federal Reserve, led by Chairman Jerome Powell, said it was holding off on further rate hikes after delivering four increases in 2019, which was ultimately revealed to tighten monetary policy too much. The central bank reaffirmed its wait-and-see approach policy pivot in March and said it would end the unwind of its $4 trillion balance sheet, another policy measure that market participants say had unsettled equity investors. With the Fed’s more accommodative stance, both equity and bond markets are responding simultaneously to the Fed, to lower inflation and interest rates.
Moreover, the Fed has communicated that it might not immediately raise borrowing costs further even if growth accelerates significantly pushing reading of inflation above its 2% target. Powell hinted in congressional testimony earlier this year that he was willing to allow inflation to temporarily overshoot its goal, enabling prices not just to reach 2% in better economic times but to average around that level.
When we put all the pieces together that have factored into the bond market rally coinciding with an equity market rally, we don’t necessarily agree with the permabear narrative that suggests one market is right and one market is wrong. When you have inflation that is really that low, you tend to have higher bond prices and lower bond yields. Low inflation can limit the decaying influence of price pressures on bond’s fixed-interest payments and encourage more buying of bonds. And as it tends to be the case for equities, when the Fed is not tightening, not raising rates, this serves to fuel a risk-on environment.
As it pertains to bond yields falling over the last several months and since the Fed’s pivot, we are also witnessing the Treasury yield curve “steepen”. The spreads between the 2s and 10s has widened over the last month, which is a net positive for an equity market rally over time, as the financial sector is found more capable, willing and profiting from a steepening yield curve.
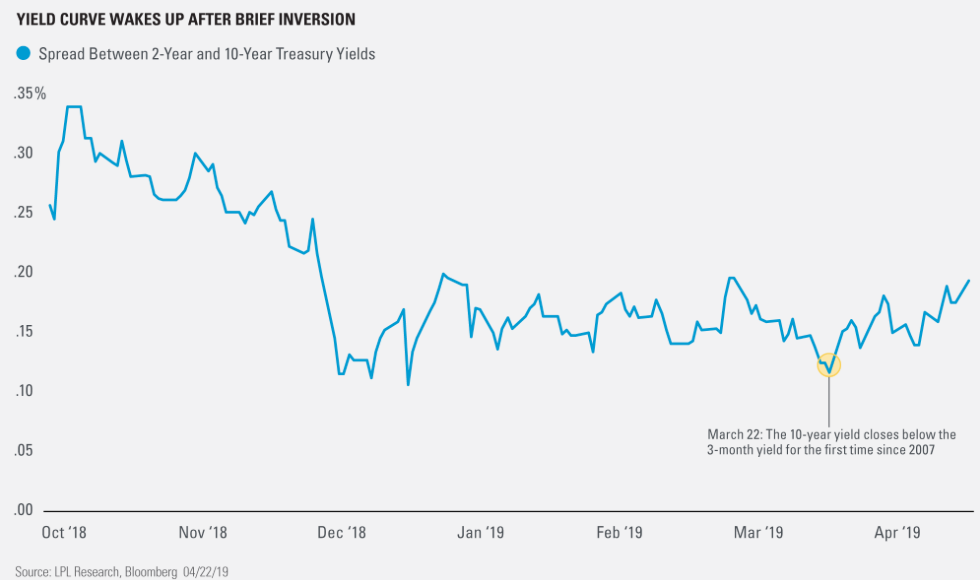
Prior to the front end of the yield curve inverting on March 22, 2019 (3-month to 10-year yields inverted), the widest spread between the 2s and 10s had been .20 bps in 2019. In the month of April, however, the spread between the two Treasury issues has widened to nearly .21 bps and with the yield curve steepening. Again, this tends to be bullish for the economy and the market over time. We’ve already seen the affects of lower interest rates positively affecting interest rate sensitive sectors of the economy such as housing.
New-home sales ran at a seasonally adjusted annual rate of 692,000, the Commerce Department said Tuesday. That was 4.5% above February’s tally and beat the MarketWatch consensus forecast of a 656,000 rate.
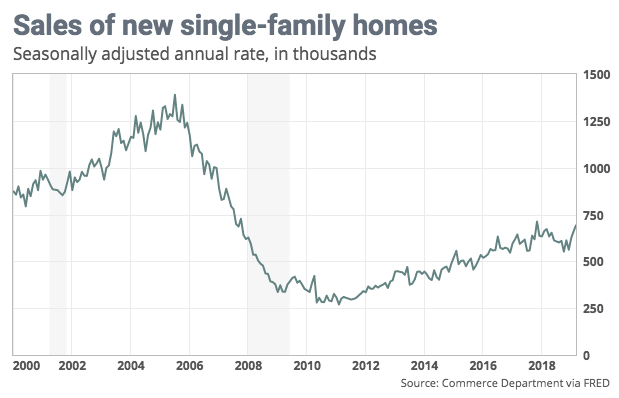
March’s selling pace was the strongest since November 2017, the month before the recent tax law changes took effect. It was also 3% higher than in March 2018. Because the government’s data on new residential construction and sales is based on small sample sizes, it is often heavily revised, and economists prefer to look at several months’ worth of data to discern trends. For the year to date, sales are running just a hair, 1.7%, stronger than the same period last year.
One of the variables Finom Group always aims to study with regards to New Home sales is the inventory aspect of the report. The graph below shows New Home Months of Supply.
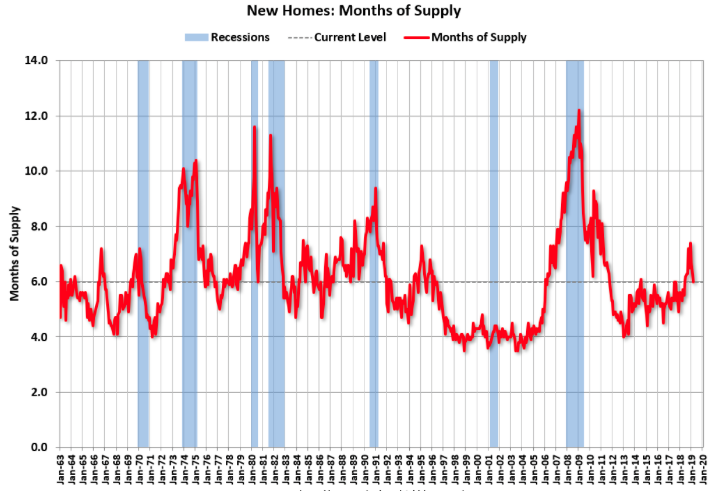
The months of supply decreased in March to 6.0 months from 6.3 months in February. The all time record was 12.1 months of supply in January 2009. The current inventory level is at the top of the normal range (less than 6 months supply is normal).
While the momentum for New Home sales is a net positive for the economy and the housing sector, some of the momentum in mortgage applications waned last week. Overall mortgage application volume fell 7.3% last week from the previous week, but it was 6.6% higher than a year ago, thanks to stronger refinance volume, according to the Mortgage Bankers Association’s seasonally adjusted index.
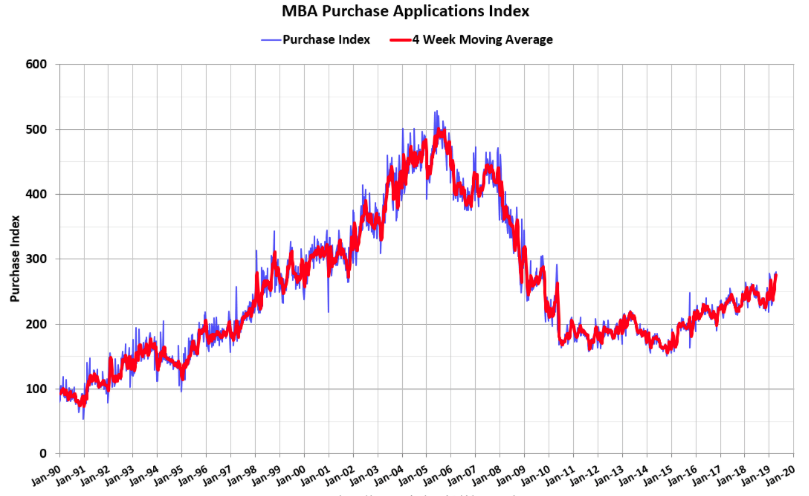
“Borrowers remain extremely sensitive to rate changes,” said Mike Fratantoni, MBA senior vice president and chief economist. “Borrowing costs have recently drifted higher because of ebbing geopolitical concerns, as well as signs of strengthening in the U.S. economy, including the recent data pointing to robust retail sales.”
While rates for a 30-yr fixed rate mortgage have slowly moved off of their bottoms in recent weeks, they remain nearly .50 bps below the peak in September 2019. Finom Group is of the opinion that mortgage rates will moderate lower in the coming weeks and months.
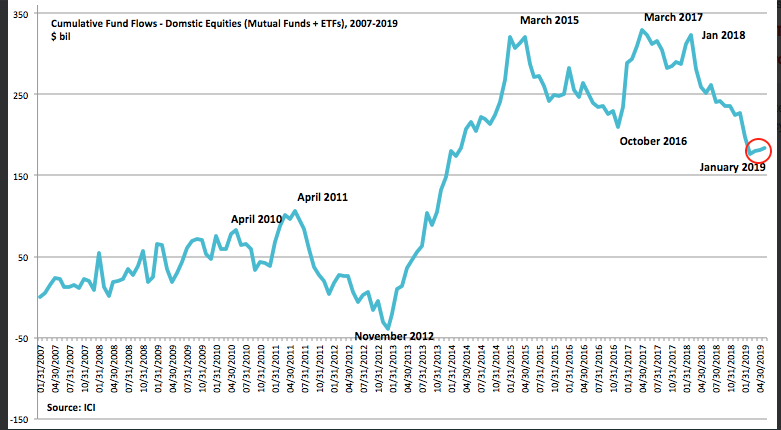
Economic conditions have improved alongside equity market liquidity conditions as the year carries forward. But to the extent the equity market found new record highs, it has done so on light volume and very unfavorable fund flows, constituting low releveraging among the CTA, hedge fund and even retail investor communities. But we have seen Lipper Weekly Fund Flow data improve in each of the last 3 weeks, in favor of equity ETFs. As shown in the chart below from ICI fund flows, the narrative of improving equity fund flows is validated.
And if you thought that improving fund flows coupled with new record highs for certain of the major indices would result in improved market sentiment…
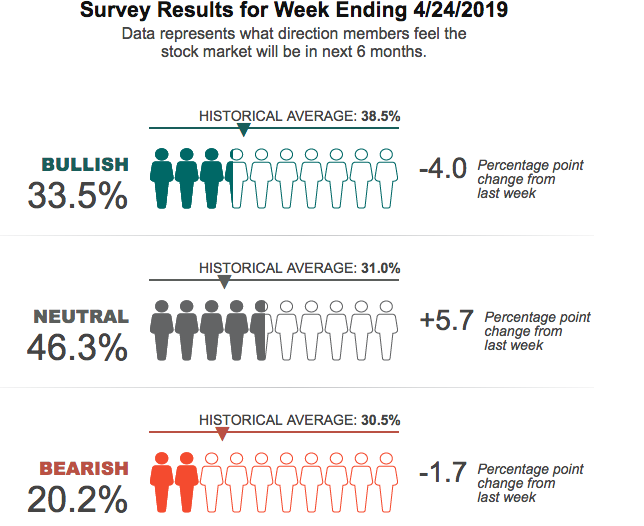
Clearly, from the latest AAII survey, sentiment only worsened. In fact, while Bullish and Bearish sentiment edged lower in the most recent survey, the Neutral sentiment leaped higher and is well above the historic average.
Neutral sentiment, expectations that stock prices will stay essentially unchanged over the next six months, rose 5.7 percentage points to 46.3%. Neutral sentiment was last higher on July 26, 2018 (41.6%). This week’s increase keeps Neutral sentiment above its historical average of 31.0% for the 14th time in 16 weeks.
What we can deduce from the Neutral sentiment juxtaposed with the 16% YTD S&P 500 march higher is that investors understand the economy has improved, but with an unimpeded upturn in the market, investors are sanguine about putting money to work having missed much of the rally.
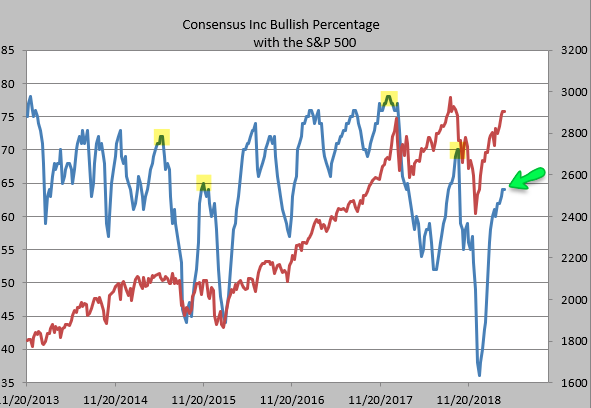
Sentiment amongst analysts has not rebounded that strongly either (blue line). Bulls climbed back to just 64% this week; rallies in the past 8 years have not fizzled out until bulls were at least 65% (like late-2015) and more often when bulls were at least 70 percent. (Chart below from Helene Meisler)
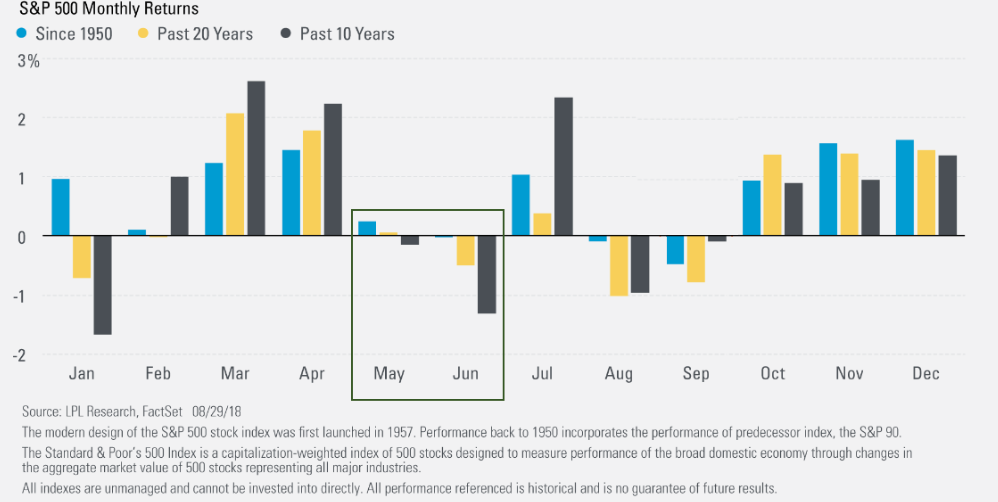
While earnings season continues to provide upside surprises peppered with some disappointing results to a lesser degree, the market may find itself set up nicely for an orderly pullback near-term. If history is any guide and proves to repeat itself in the following case, seasonality alone may impede the progress of the bull market in the months ahead. (LPL Financial Chart depicted below)
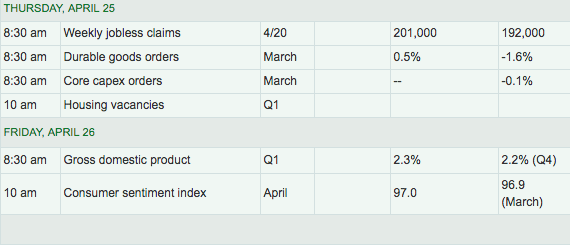
The major indices are likely to provide investors with an uneven performance Thursday as 3M (MMM) offered up a greatly disappointing earnings report card while the likes of Microsoft (MSFT) and Facebook (FB) outperformed analysts’ expectations. There respective earnings reports find the Dow Futures lower by nearly 170 points while the Nasdaq Futures are higher by some 60 points in the 6:00 a.m. EST hour. Investors will also be impacted by the economic data coming out Thursday and the highly anticipated Q1 GDP data due out Friday, ahead of the market’s open.
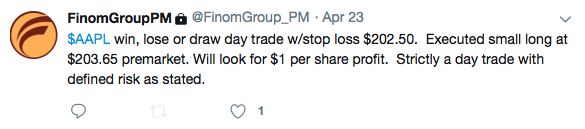
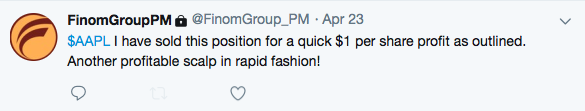
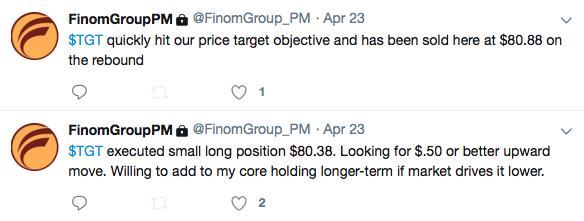
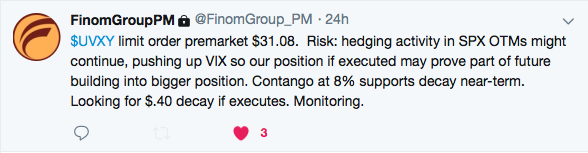
Regardless to what degree and when the market does eventually express some relaxation and/or a pullback, Finom Group will be trading what the market delivers. Some of our recent trade alerts are depicted below:

We encourage our readers to subscribe to our Premium Membership package which offers weekly Research Reports, access to our daily/weekly trade alerts and our Live daily Trading Room.


