
Welcome to this week’s State of the Markets with Wayne Nelson and Seth Golden. Please click the following link to review the SOTM video. In this week’s episode, we discuss the S&P 500 achieving all-time highs once again and how it tends to perform historically after such feats of strength. Valuations are subjective and should guide your trading and investing plan, but rather be recognized in your trading and investing plans. Anticipate consolidation periods as they are a matter of when, not if. Know the long-term trajectory of the market is dependent on earnings and liquidity!
“The best traders can put on a trade without the slightest bit of hesitation or conflict, and just as freely and without hesitation or conflict, admit it isn’t working. They can get out of a trade, even with a loss, and doing so doesn’t resonate the slightest bit of emotional discomfort. In other words, the risk is inherent in trading do not cause the best traders to lose their discipline, focus, or sense of confidence. If you are unable to trade without the slightest bit of emotional discomfort then you have not learned how to accept the risks inherent in trading. This is a big problem, because to whatever degree you haven’t accepted the risk, is the same degree to which you will avoid the risk. Trying to avoid something that is unavoidable will have disastrous effects on your ability to trade successfully.”

- S&P 500 Index finally made a new all-time high, coming all the way back from the vicious 34% bear market in less than six months.
- It took just 126 days to get to levels never seen before.
- For context, the median number of days between all-time highs for the S&P 500 is 90.
- S&P 500 notched the 14th new high of 2020.
- Number of new all-time highs in the S&P 500 by year: 2013 – 45, 2014 – 53, 2015 – 10, 2016 – 18, 2017 – 62, 2018 – 18, 2019 – 35, 2020 – 15 (so far)

- The bear market officially lasted one month and took five months to recover the losses.
- Usually when there’s a bear market during a recession, it takes 30 months to recover those loses. This was the third-fastest ever, with only 3 months to recover from a bear market recession in the early ‘80s and 4 months to recover from a bear market in the early ‘90s.

- Returns after a long time without new highs actually get better.
- One, three, six, and 12 months after the first new high in more than five months show stronger performance than average or after any new highs.
- Another reason to think of this bull market from a long-term point of view could have some more tricks up its sleeve.

- While the index was hitting fresh air, only 6.5% of the underlying stocks were even making a 6-month high.
- The chart above shows when the index made its first new 52-week high in a month with less than 7% of stocks at a 6-month high.
- We haven’t seen this low level of participation since 2015 and before that, in 2000 and 1993.
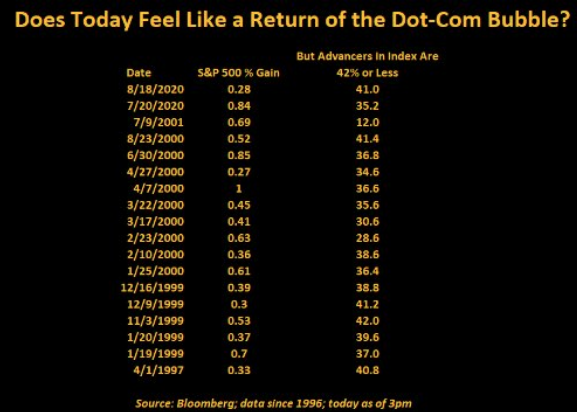
- Tuesday’s record close holds interesting company.
- Data compiled by Bloomberg reveal that historical days when S&P 500 gained 0.28% or more while 42% or less of members were advancing, were only before & during tech bust.
- Breadth can shift fast, very fast…
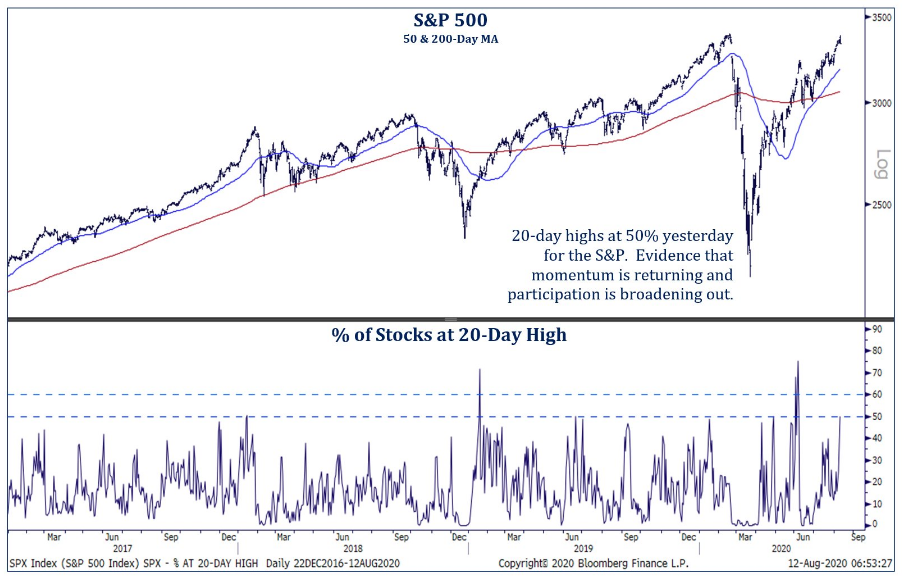
- This breadth chart/SPX was on August 13th.
- S&P new high list expanding, participation broadening out.
- Breadth can shift fast, very fast..
- In real-time, not much one can do with breadth.
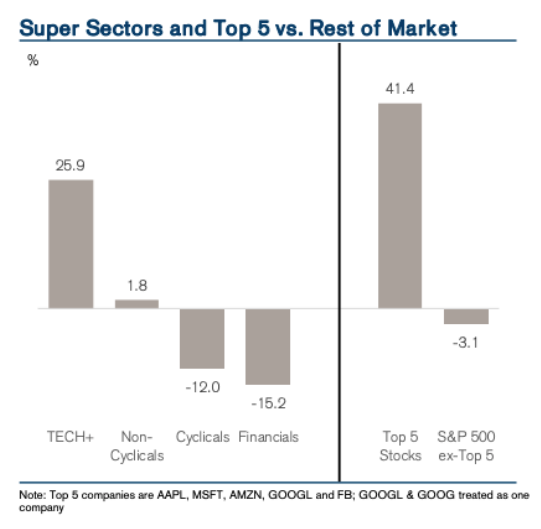
- Credit Suisse highlights the market’s performance by breaking the market down into specific segments that contribute to the year-to-date S&P 500 performance.

- S&P 500 industry groups and how they’re trading relative to their 50 and 200-DMA. While we hear a lot about the largest five stocks in the S&P 500 accounting for the lion’s share of the gains, it’s not as if everything else in the market is falling apart.
- Looking first at S&P 500 industry groups versus their 200-DMA, more than 2/3rd are currently above their 200-DMAs, and the level continues to trend higher.
- A more worrying sign would have been if this reading was much higher and showing signs of rolling over. The seven industry groups that are currently below their 200-DMAs are Banks, Consumer Services, Energy, Insurance, Real Estate, Telecom Services, and Utilities.
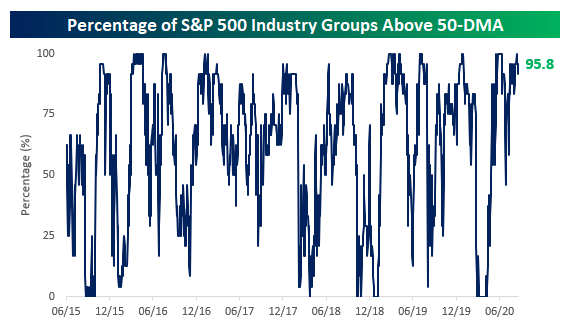
- The percentage of industry groups currently above their 50-DMAs is considerably higher, at over 95%.
- In other words, the only industry group not above its 50-DMA is Energy. What else is new?
- Many investors, analysts and traders continue to look at breadth on a YTD basis. I think that is faulty.
- This is a new bull market, achieving all the necessary qualifiers of a new bull market in previous months.
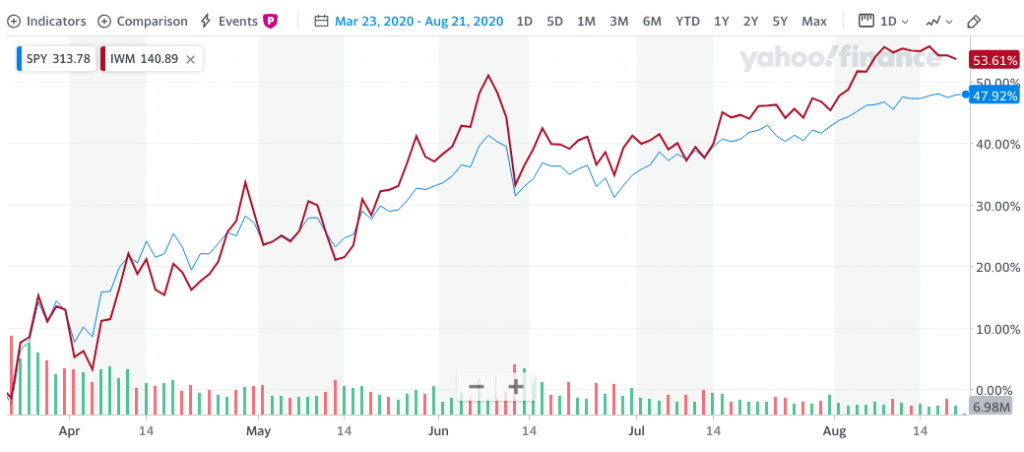
- The chart above shows small caps outperforming large caps since the March bottom. Typical of a new bull market.
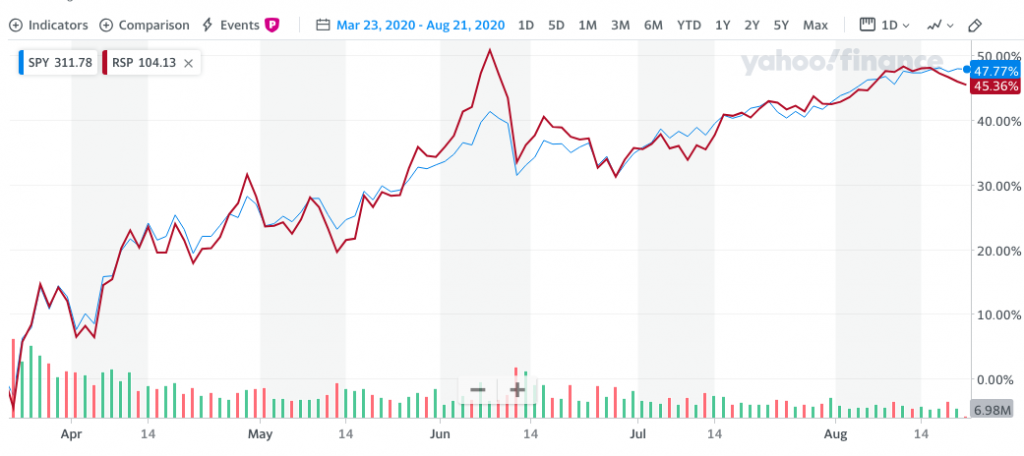
- Up until this week, we’ve seen Equal Weight S&P 500 (RSP) outperform the Cap Wight S&P 500 (SPY).
- This suggests that despite the mantra of “handful of stocks pulling the entire market up), breadth has actually been broad based.
- Again, we would refer to the industry groups also trading above their 50-DMA as supporting the notion breadth has been strong since the March bottom.
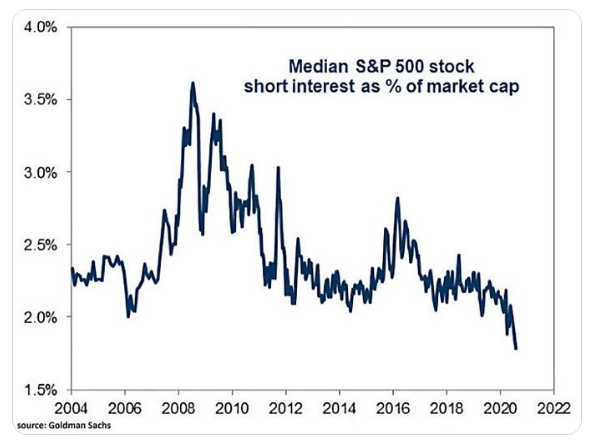
- Median S&P 500 stock short interest stands at 1.8%.
- This is the lowest level since 2004.
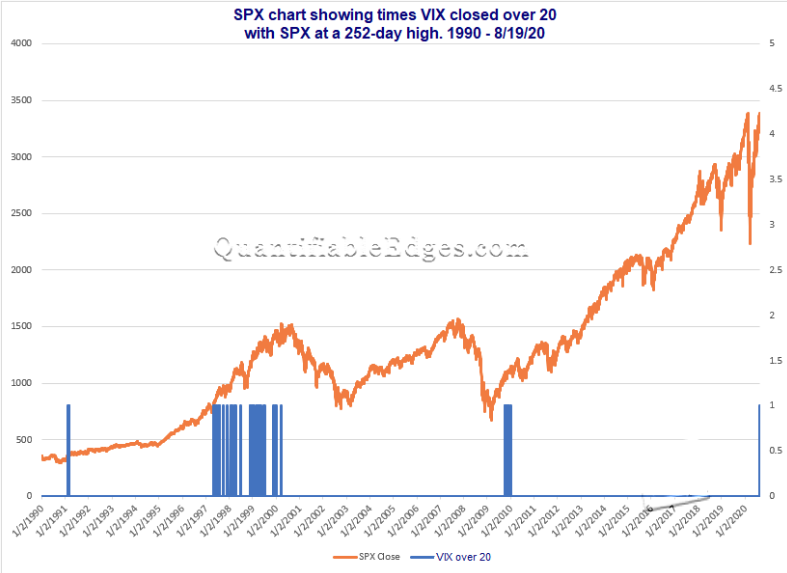
- Tuesday saw S&P 500 close at a 1-year high with the VIX over 20.
- Could happen again soon.
- Unusual to see this. Chart above shows all times it has been the case.
- S&P 500 has made 578 new all-time highs since 1990
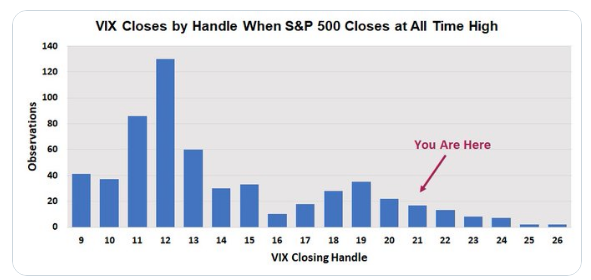
- VIX average 14.48 on those days
- 70 times VIX closed over 20
- Highest VIX close on a record S&P 500 day was 26.25 in January 1999.
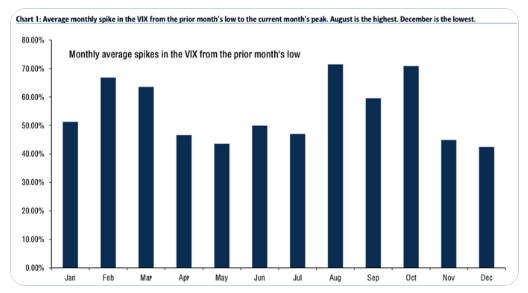
- Remember this: BofA said August has largest monthly spike off low in prior month (July).
- We wanted to review this once again with 1 full trading week left in August.
- Thus far, the lowest VIX close for July was 24.10, as shown in chart below.
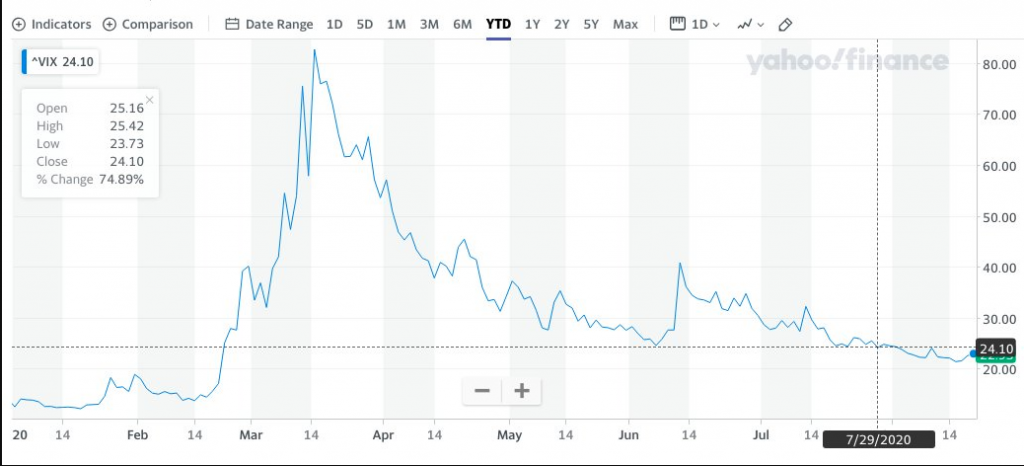
- VIX nearly broke 21 last week and has spent a couple days touching above 24 this week.
- What doesn’t show up in the BofA chart and determination is how the VIX performs when it is above 20 in July, going into August.
- Typically, the VIX is lower in August if the VIX is above 20 in July.
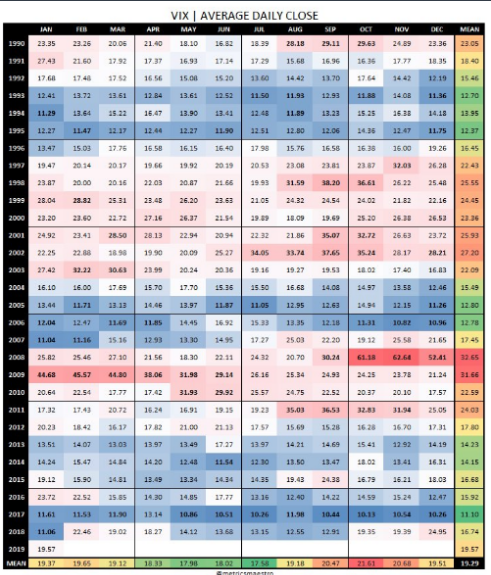
- Going all the way back to 1990 (VIX origin), the VIX has held a mean reading above 20 on 7 occasions.
- Only 2 times was the VIX higher in August after a mean VIX above 20 in July, 1997 & 1999.
- August has the 6th lowest mean VIX reading of all months.
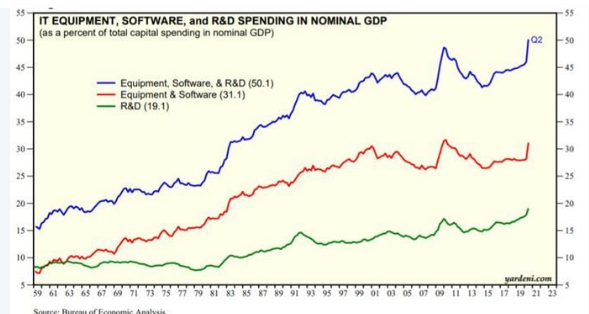
- High-tech spending on IT equipment, software, and R&D rose to a record $1.32 trillion (saar) during Q2-2020.
- It jumped to a record 50.1% of total capital spending in nominal GDP during the quarter. Equipment and software accounted for 31.1%, while R&D accounted for 19.1% of capital spending in nominal GDP.
- Technological progress always confounds the pessimists by solving scarce-resource problems. It also fuels productivity and prosperity, as it did in the 1920s and could do again in the 2020s.
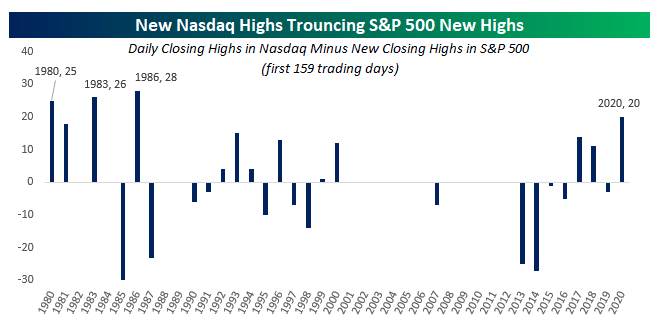
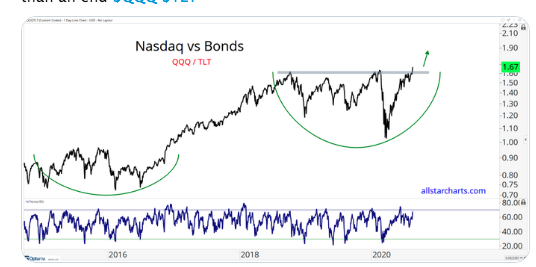
- Nasdaq made its first post-COVID record high more than two months ago on June 8th and since then has made 18 record highs compared to the S&P 500’s one new high. (Bespoke Investment Group)
- For the entire year now, the Nasdaq (36) has made 21 more new highs than the S&P 500 (15). Going back to 1980, there have only been three other years where the spread was wider in the first 159 trading days of the year, and they were all in the 1980s.
- In other words, the gap between the number of record highs for the Nasdaq and S&P 500 hasn’t been this wide in more than 30 years. It’s time for the S&P 500 to play catch up
- What bubble?
- I’m reminded of the multiple years of no progress in markets and the Nasdaq.
- To me, this looks a lot more like a beginning than an end.
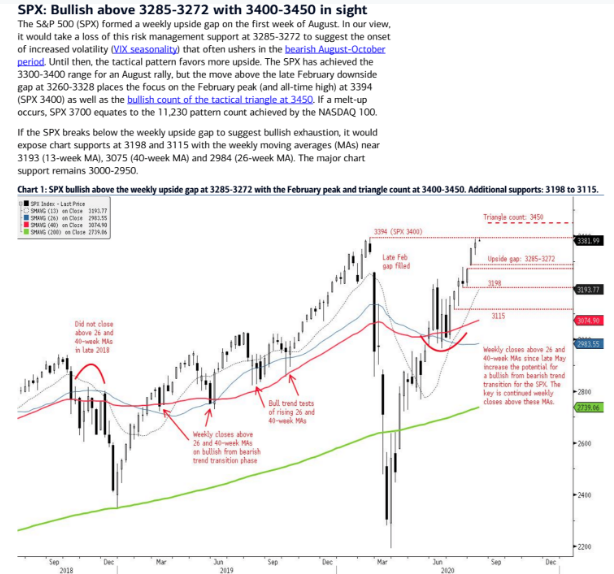
- “The charts, as interpreted by the legendary Larry Williams, suggest the S&P could climb another 4% or 5% over the next two weeks, but come July 28, he expects the market to start rolling over.”
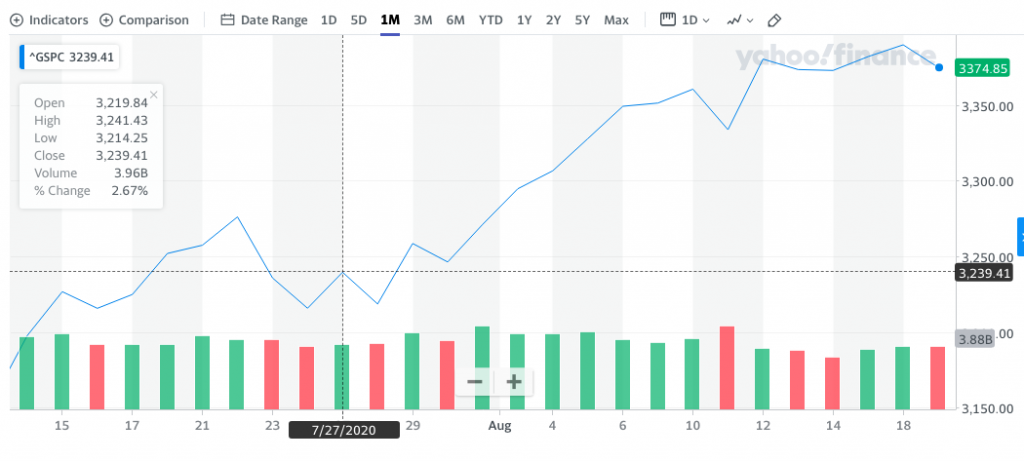
- Williams expects the market could peak near its old highs around July 27, but presumes those levels will be fleeting.
- “How hard will stocks get hit, it’s probably too soon to tell, but the rollover will hurt, because too many people” are too long on equities.”
- On July 27, the S&P 500 closing value was 3,239. We’ll see if it gets back down to that level as a form of price consolidation and relevancy of Williams’ call on markets.
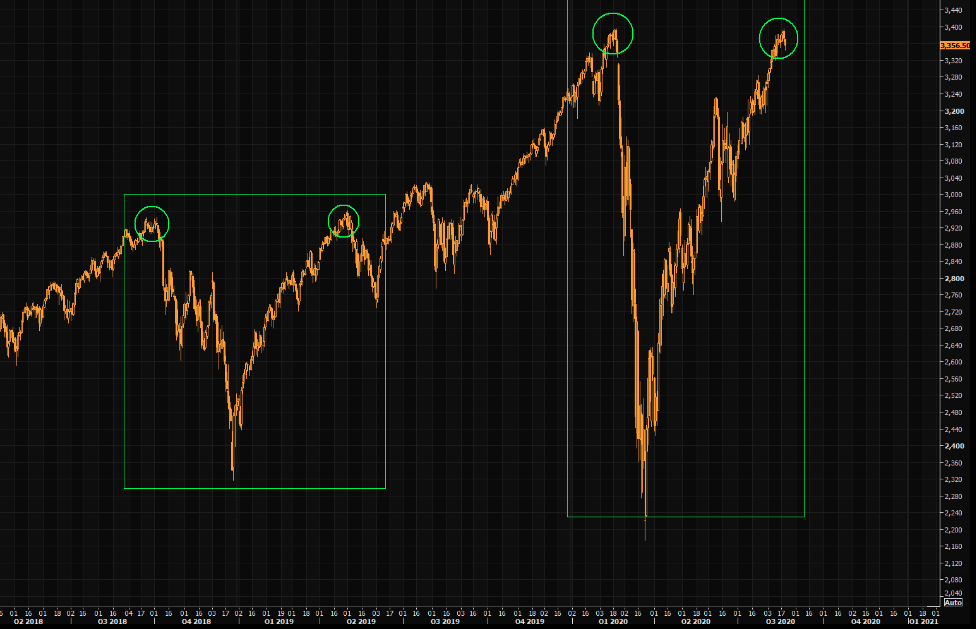
- “With the SPX fast approaching a well-defined former high (52-week & all-time high), the question is whether or not it can achieve meaningful gains between now & year end. Not achieving meaningful gains means the market “gets stuck”, putting in a double top – that’s our hunch.”
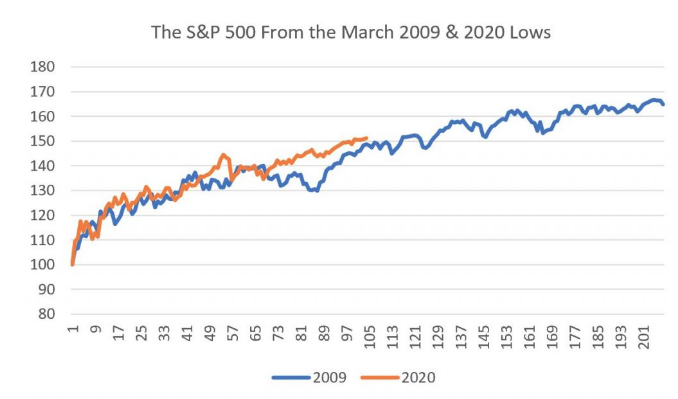
- 105 days from the 2009/2020 lows the S&P 500 is just slightly better (2 points) than back in 2009 on the same trading day.
- If you’re bullish, the fact that the 2009 experience points to a further 11% gain is good news.
- But there could be some bad news to consider as well.
- Financials doubled from March 9th 2009 to this point in the 2009 rally.
- The narrative in 2020 could not be more different. Big Tech is leadership, as it gains consumer and business share of wallet and attention.
- 2009’s rally occurred after a U.S. Presidential election, where 2020’s move is happening just ahead of one.
- One reason 2008 was so horrible was the delay in providing fiscal stimulus (ARRA) until February 2009. Lawmakers barely passed TARP in 2008, and with the November election and change in power there was no consensus about fiscal stimulus until a new President and Congress took office in early 2009.

- Earnings still drive markets over time. The market is forward looking and looking for earnings to rebound, just as they did in 2009 by year-end and setting a record high in 2011.
- The 2009 – 2020 comparison is a reminder that 1) bottoms occur when government policy responses match the scope of an economic downturn and 2) the nature of the market’s recovery will vary by sector, but the aggregate return (driven by a sharp earnings rebound) is closer than one would think likely.
Consider what has to happen for the S&P 500 to reach 3,800. That’s essentially where the 2009 playbook says it should go by year end (3,763 to be precise).
- Forget about cyclical rotation driving stocks higher if that means Tech + Google, Amazon and Facebook falter along the way. These stocks are collectively 38% of the S&P 500. Financials and Industrials (together 17.8% of the index) could rally 10%, but if that meant a 5% pullback for Big Tech then the S&P 500 would remain unchanged.
- We need to see earnings estimates for 2021 continue to rise. An S&P 500 rallying with a 22x multiple means just one thing: investors think next year’s earnings are going to be better than expected. The latest FactSet data (chart below) shows this is happening, but it has to continue. That means we need a steady drip of better than expected economic data.
- Whatever happens with the November elections needs to be decisive. Remember the lesson of 2008 from Item #1: political dead zones hurt stocks if the US economy is on shaky ground.
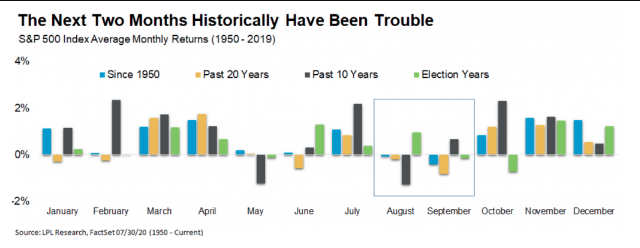
- August is typically a down month, except during election years.
- So far, right on schedule.
- SPX is up more than 3% from August 1, 2020.
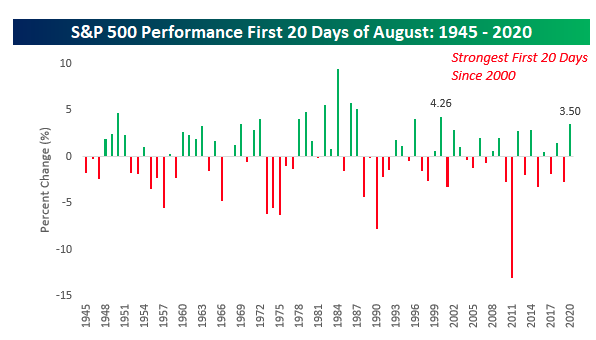
- For a month that usually isn’t great for the market, this August has been shaping up just fine.
- Through Thursday’s close, the S&P 500 was up 3.5% so far in August.
- For the first 20 days of August, this month has been the strongest since the 4.26% gain in 2000, and going back to 1945 there have only been eleven other August months that saw a stronger performance in the first 20 days of the month.
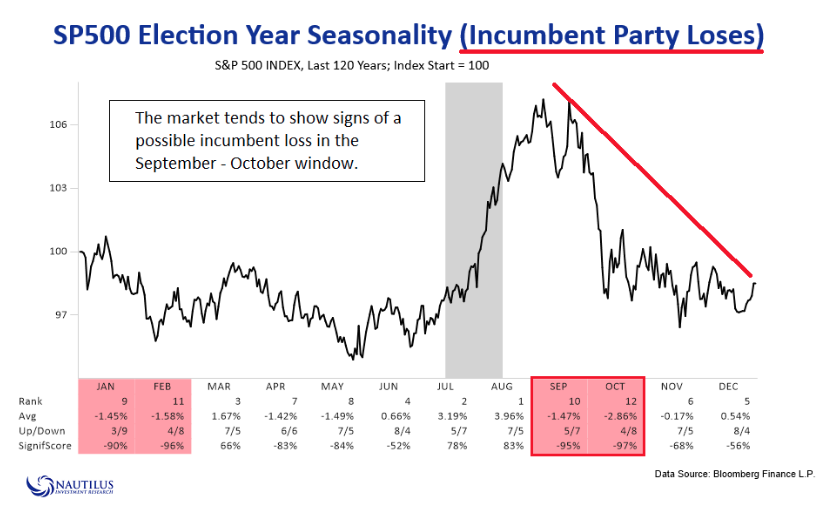
- Market prices in incumbent loss during September-October time frame.
- Chart above of SPX going back 120 years.
- Average loss in September 1.47%.
- Average loss in October 2.86%.
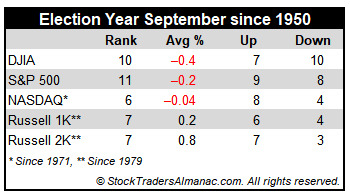
- Bullish election-year forces do little to improve on September’s poor overall performance since 1950.
- September’s performance does improve slightly in election years, but it is still negative nearly across the board.
- Only the Russell 1000 and Russell 2000 have been able to escape negative territory and post modest 0.2% and 0.8% average gains respectively in the last ten election year Septembers.

- UofM ConsumerSentiment had been good over the past few years, running between 90-100 from the start of 2017 to February 2020.
- It then plummeted to a low of 71.8 in April 2020, bounced back to 78.1 in July but then dropped to 72 – 73 in July/August.
- Consumer sentiment never “V-bottoms”. That doesn’t mean the US economy is stuck in a never-ending recession
- Even at current trough levels of 72, sentiment is still better than the sub-60 levels of months in 2008 and early 2009 and again in 2011.
- The year-over-year percentage change in consumer sentiment for April – May 2020 was negative 26% – 28%, where April – August 2008 showed negative 28% – 32% comps.
- Consumer sentiment held up better than 2008 (and 1980, and 1990) because of aggressive fiscal and monetary stimulus.
- History says it takes time to improve after a shock; this does not, however, mean that the equity market is wrong in predicting its eventual recovery.


