
Despite the noise surrounding global trade and correlated tariffs last week, the S&P 500 finished higher by nearly 1 percent. Additionally, the S&P 500 YTD gain stands at roughly 7.6 percent after correcting nearly 12% in February.
Heading into September, the S&P 500 is up 5 consecutive months and with two consecutive monthly >3% gains. While we all know by now that since its inception in 1928, the S&P 500 has finished lower in September more than any other month, or 55% of the time for an average return of negative 1.01%, what you may not know might surprise you. When the S&P 500 increases by >3% in both July and August, typically it foreshadows a downturn over the next 3 months. More importantly, over the next 6,9, and 12-month periods the S&P 500 is positive.
S&P 500 Expected Move
Last week’s expected move was $31 and we pretty much hit that move right on the head. What is quite interesting about the expected moves since April is that over the last 22 weeks of trading, we’ve only crossed over the expected move 3 times. This means that 86% of the time we have been within 1 standard deviation of the expected move. Check out the screenshot below:
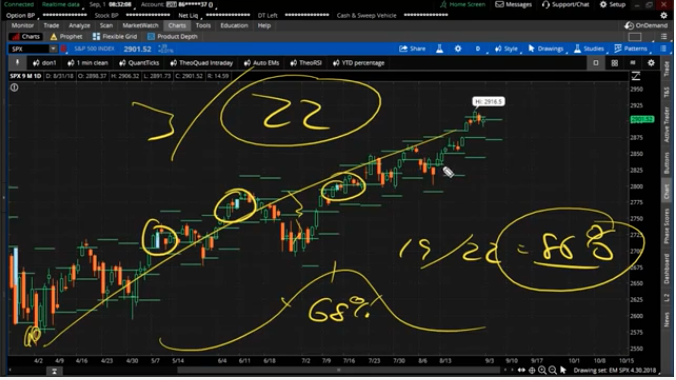
Typically, the market should express 68% of occurrences staying inside of the standard deviation, but it’s occurring 86% of the time. The aforementioned stats suggests a couple of key characteristics about the market that are somewhat concerning.
- Firstly it is clear that the market is being moved in part, a large part by quantitative finance or “quants”. We can only see such statistics through programed and algorithmic quant trading systems.
- Secondly, the market is lacking liquidity when quants are in play to the degree they are presently moving markets.
- In such an environment where the market is somewhat quant-driven, fundamentals and technicals matter very little. It’s why for every random technician eyeing a severe market correction they’ve been found in error and why for every fundamental concern over the market it’s been found a fruitless sentiment.
- Quants still need corporations to perform in order to lend credence to individual stock and overall market moves.
Economic Data in Sight
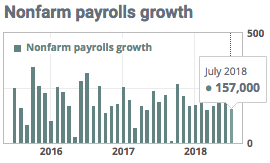
September is a critical period for the markets with ample economic data releases and Federal Open Market Committee (FOMC) activity to contemplate and act upon. This coming Friday, the release of the all-important Nonfarm Payroll report will be released. After a lesser job creation month in July (157K jobs created), economists are expecting a bounce back in August, upwards of 200K to have been created.
While the unemployment rate is near record low levels, wages have only modestly increased over the last 12-month period. Average hourly wages, for instance, have risen just 2.7% in the past 12 months, well below the 3% to 4% gains that typically prevail when the economy and labor market are this strong. With that being said, most economists believe given the unemployment rate and expectations for that rate to further decline, wage inflation is inevitable.
“We suspect that wage growth will also start to show clearer signs of accelerations soon,” contended Andrew Hunter of Capital Economics.”
For all the fear and consternation over wage inflation, the reality is there is no such thing. Real wage growth has been virtually stagnant for the past 40 years. Meanwhile, the stock market and economy have consistently trended higher over the past 40 years. (See chart below)
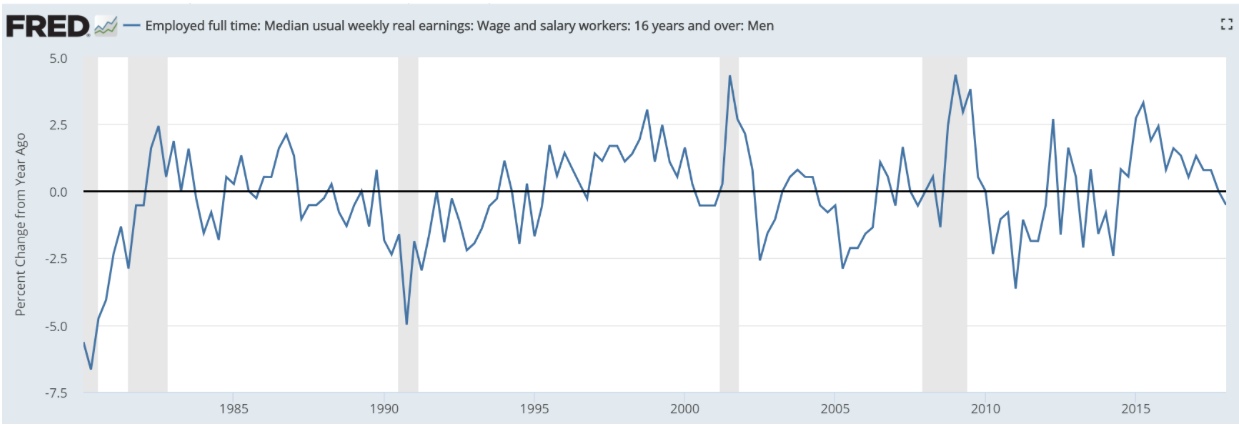
What has happened to the S&P 500 over the last 40 years? That’s right, higher highs and record level highs over time.
Nearly 2/3 of all economic activity in the United States is consumer related. With more individuals employed, spending power is elevated. Couple the strong labor market with tax cuts and you have a recipe for increasingly strong consumer spending that feeds through to corporate profits.
What we learned through the Personal Consumption and Expenditures data last week was that consumer spending remains on the rise. Consumer spending rose sharply in July for the fifth month in a row. The government said consumer spending climbed 0.4% in July. However, incomes rose a modest 0.3 percent. Consumer spending has increased by 0.4% or higher in every month going back to March. Given the strength of the economy and reflation metrics, the Fed is naturally raising interest rates to prevent the economy from overheating, but this also means that Americans will pay more to borrow money to buy new homes and cars amongst other goods and services. With the consumer on solid footing, let’s move on to a brief discussion about the Fed and Quantitative Tightening.
Fed & QT
In September, the Fed is expected to hike rates by .25 bps, bringing the Fed Funds rate up to 2 percent. It’s not up for debate, it’s not speculated upon, but rather it is pretty much a done deal. (See CME table below)
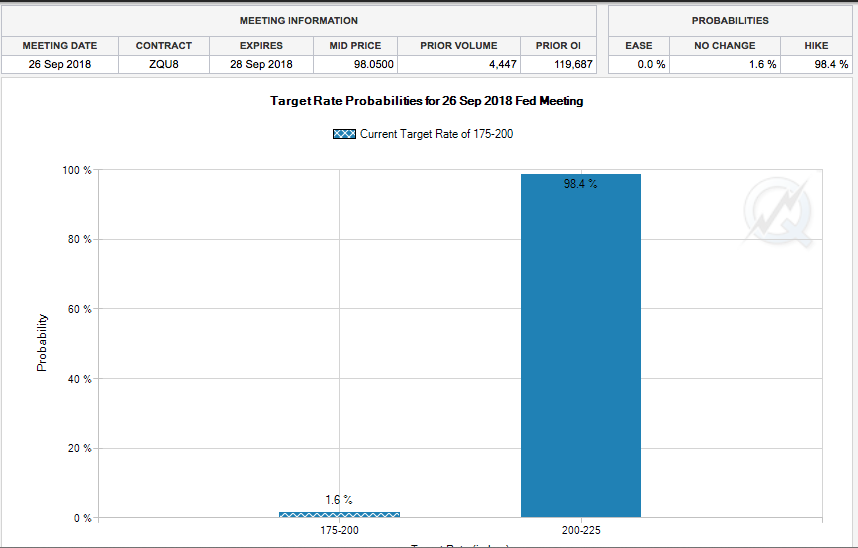
The CME’s FedWatch Tool that tracks Fed Fund future contracts gives the probability of a Fed rate hike, at the September meeting, a 98% chance of occurring.
Alongside the Fed raising rates, the Fed’s Quantitative Tightening program carries on. Just last Friday, the Fed continued with its program of QT. The Fed had $19.1 billion in bonds mature, which was the largest amount, until November when $30 billion rolls off. Currently the monthly pace of QT is a potential $24B in treasuries and $16B for asset backed securities (combined $40B), all going to plan, this will rise to $30B in treasuries and $20B in ABS (combined $50B) in Q4 this year.
It has been forecasted by economists and analysts alike, that as QT goes, the S&P 500 will follow. That hasn’t played out as of yet with the broad sentiment suggesting QT would dampen price-to-earnings multiples in a rising rate environment coupled with the Fed withdrawing liquidity from the markets. In fact, it’s been quite the opposite for the market as shown in the chart below:
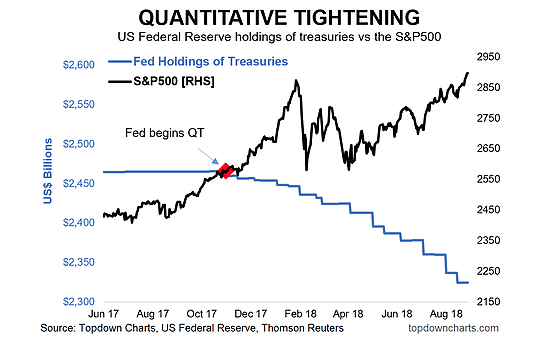
The bottom line is that we don’t know the endgame affects from QT on the S&P 500, but we do know that it hasn’t curbed the appetite for U.S. stocks that are poised to outperform emerging markets. After all, QT be darned with S&P 500 earnings and sales at record levels.
Sales & Profits
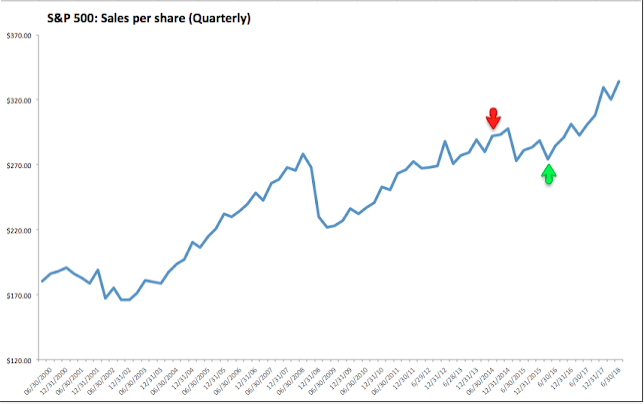
Quarterly sales reached a new all-time high in Q2 2018, growing 11% over the past year, the best sales growth in 7 years (since 2011). On a trailing 12-month basis (TTM), sales are 9% higher year-over-year (all financial data in this post is from S&P).
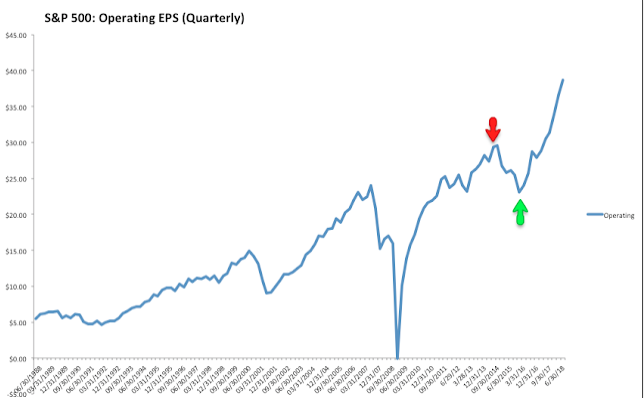
Quarterly EPS (operating-basis) is also at a new all-time high, growing 27% over the past year on a quarterly-basis and 21% on a trailing 12-month basis (TTM).
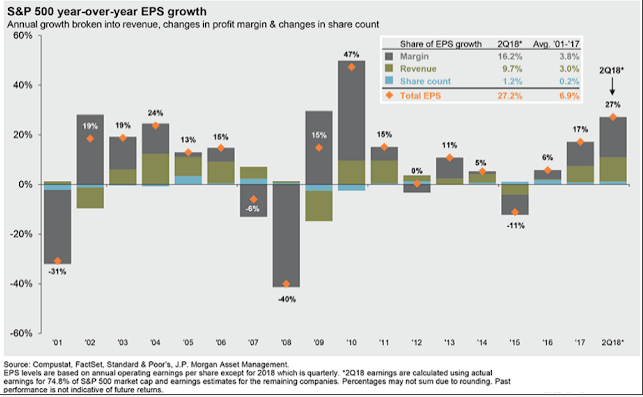
You’ve likely heard it before, right? “Corporate buyback programs are responsible for the boost in corporate earnings.” This is true, in part! The “part” as it may be is so much smaller than most people think, which is rather amazing for the quantity of times this is stated or how it’s highlighted in the media. So just how small a role do corporate buybacks play in the EPS/profit picture?
The role buybacks have played in corporate profits is that over 90% of the growth in earnings in the S&P for the past 8 years has come from better profits, not a net reduction in shares. Better profits drive growth, not “financial engineering.” That has been true over the past 17 years, during which the change in corporate shares has accounted for just 3% of EPS growth (from JPM).
Yet another permabear, promotional myth busted. Having said that, of course, buybacks aren’t hurting the EPS picture and we recognize that buybacks don’t necessarily serve the economy well if at all. Speaking of earnings, sales and profits…
S&P 500 Earnings
It happened! While most analysts and economists were of the opinion that Q1 2018 earnings marked a peak in the earnings cycle, Q2 has surpassed those expectations and predictions. According to FactSet, the blended earnings growth rate for the S&P 500 is 25.0 percent. If 25.0% is the actual growth rate for the quarter, it will mark the highest earnings growth since Q3 2010 (34.1%). On June 30, 2018, the estimated earnings growth rate for Q2 2018 was 20.0 percent. Ten sectors have higher growth rates today (compared to June 30) due to upward estimate revisions and positive earnings surprises. The 5% difference from estimated earnings to actual earnings is ahead of that during the Q1 2018 period. The forward 12-month P/E ratio for the S&P 500 is 16.8. This P/E ratio is above the 5-year average (16.3) and above the 10-year average (14.4). Now let’s see what Thomson Reuters has reported on the Q2 earnings period.
The September market-trading environment may prove as easily to be contrarian to its historic market performance as it is inline with its historic performance and given all the aforementioned within our research report. The Fed meeting isn’t set to take place until the 25th-26th, but will likely see markets adjust prior to the event. Additionally, the weight of trade tariffs and trade disputes around the world may come to the forefront of investor consideration sooner than the Fed rate hike.


