
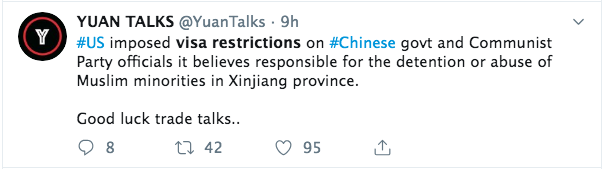
Additions to the Commerce Department’s blacklist, announced visa restrictions on Chinese government and Communist Party officials who are believed to be involved in abuse of Uighurs and other Muslim minority groups in Xinjiang, China, and we simply can only imagine what else might be to come ahead of the Thursday trade talks between the U.S. and China. This is hardly what anybody might describe as the welcoming of negotiations.
“You don’t do these things prior to negotiations. It does not set a good tone, that’s tactically. Strategically, all these actions — I think — are causing the Chinese to wonder: ‘What is the US’ real motive here?’” Max Baucus, former U.S. ambassador to China from February 2014 to January 2017.”
Baucus said the U.S. actions could simply be posturing ahead of the planned trade talks to get a better deal from China. But, “China will not be bluffed.” Taimur Baig, chief economist at DBS Group Research, echoed that sentiment.
“There are ways of putting pressure — back channel diplomacy, implicit threats and so on, but this is very explicit (and) very noisy. The … potential loss of face for the Chinese is massive. I can’t imagine anybody rationally expecting a constructive outcome out of this. The timing of the U.S. move “could not be worse” and it would “definitely backfire.”
U.S. markets were rocked in the late afternoon on Wednesday, as these headlines broke regarding VISA restrictions.
Prior to this headline, the S&P 500 was lower on the day by less than half a percent. When the news of VISA restrictions broke at 3:00 p.m. EST, however, the S&P 500 began a second leg lower and with investors fearing a less than optimistic result from trade talks.
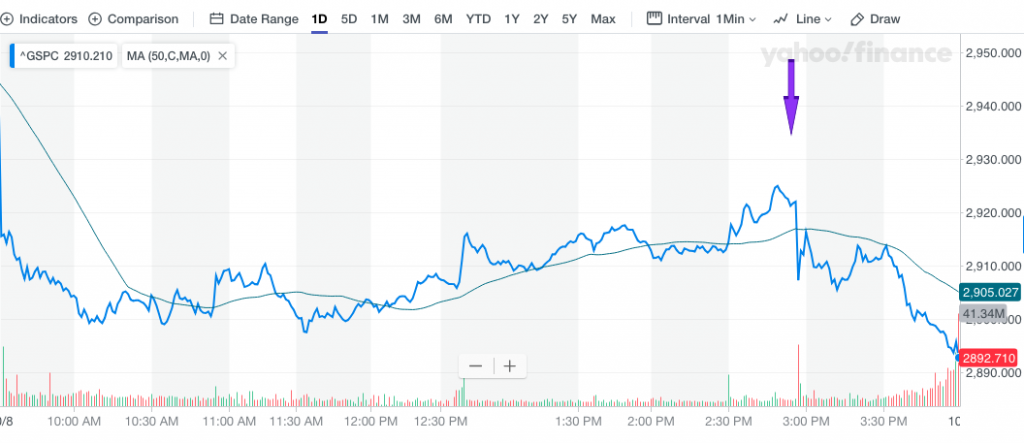
Ahead of the VISA restriction headline, all 3 major U.S. equity indices had been rising through the speaking engagement of Fed Chairman Jerome Powell at the National Association for Business Economics annual meeting in Denver. The chart of the S&P 500 above shows a clear ascent in the benchmark index from 2:30 p.m. EST, whence the conference began. Much of what the Chairman discussed found favor with investors.
“FOMC participants continue to see a sustained expansion of economic activity, strong labor market conditions, and inflation near our symmetric 2 percent objective as most likely.
Clearly things are slowing a bit, but this might be another pause that refreshes the expansion. These slowdowns have occurred a few times in this expansion. We will be data dependent, assessing the outlook and risks to the outlook on a meeting-by-meeting basis.
A range of factors” might have caused the turmoil seen last month when the cost of short-term borrowing spiked as firms scrambled to get funding.“
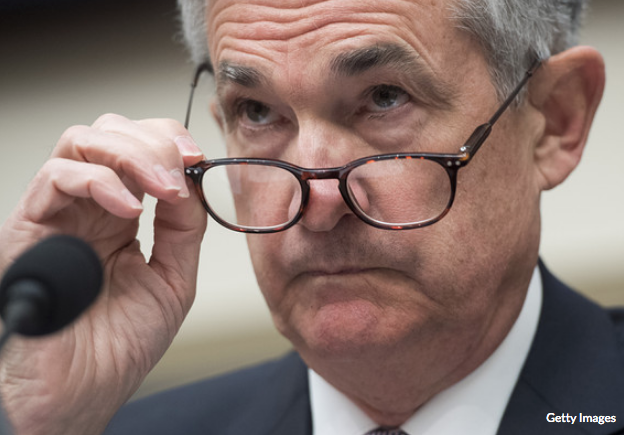
Regardless the cause, Powell said it was now time for the Fed to increase the size of its balance sheet. He said the central bank may purchase short-term Treasury bills.
Some analysts call this a “soft” form of quantitative easing, because the Fed buys these securities from the market, but Powell bristled at this description.
“I want to emphasize that growth of our balance sheet for reserve management purposes should in no way be confused with the large-scale asset purchase program that we deployed after the financial crisis,” he said.
Unfortunately, even the hint of a soft form of quantitative easing wasn’t enough to offset the geopolitical headline damage. The S&P 500 finished the dow deeply in the red by 1.56%, with the Nasdaq (NDX) leading the market lower on the day by 1.67 percent. The S&P 500 finished the day below both it’s 50-DMA and 100-DMA, leaving only the 200-DMA at 2,945 left to achieve. In addition to the significant pullback on Tuesday, the benchmark index also slightly breached the weekly expected move of $57/points. With many headlines still likely to come during the trading week, investors are likely to see more whipsawing action with the VIX rising nearly 15% intraday on Tuesday, to greater than 20.
Fear loomed large on Wall Street Tuesday as the CNN Fear and Greed Index sank from 30 to 23 intraday.
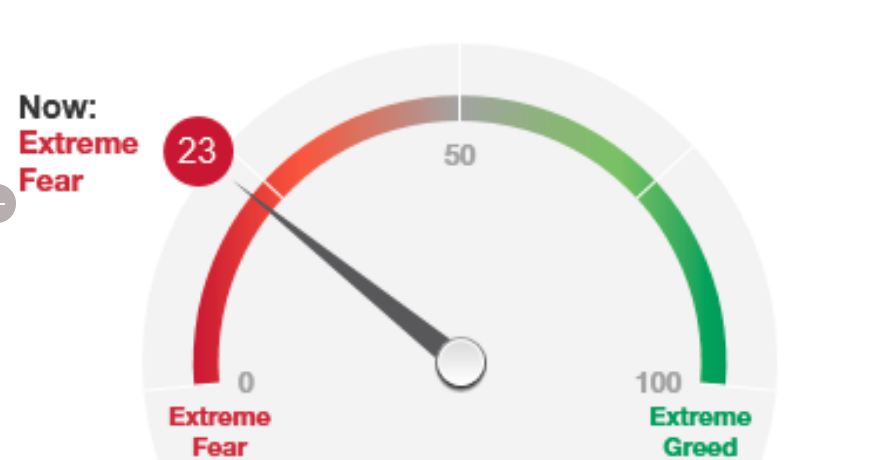
Usually, once the Fear and Greed Index reaches Extreme Fear levels, it proves a contrarian investor indicator shortly thereafter. It not only reads the level of pessimism in the market, but also registers oversold conditions. A similar analysis and/or extrapolation can be offered through the expression of the put/call ratio, which spiked to extreme levels on Tuesday as well.
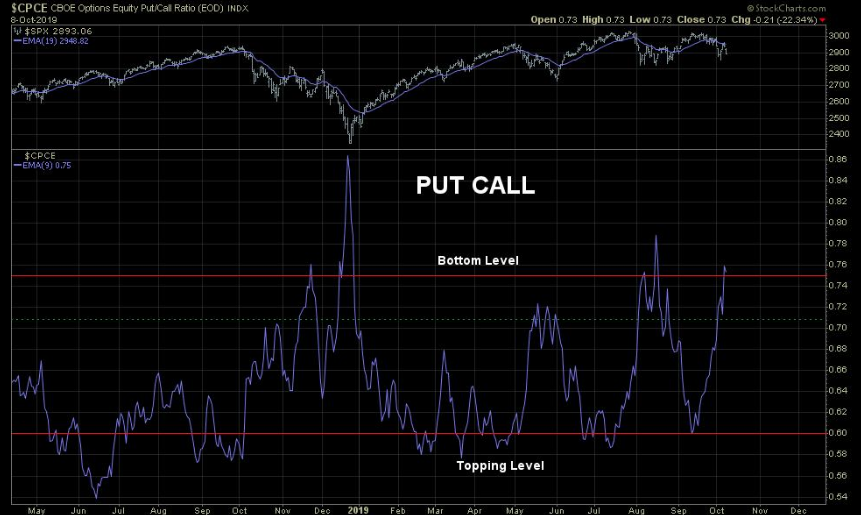
The top panel chart of the S&P 500 is pared with the bottom put/call ratio panel chart. As we can see, drops in the S&P 500 tend to coincide with a rise in the put/call ratio. Based on the upper trend line, we can see the put/call ratio has slightly breached the resistance level that has usually resulted in a near-term bottoming of the S&P 500 and peak in the put/call ratio. And this, just ahead of trade talks.
After 3+ weeks of equity selling pressure, market breadth has greatly deteriorated from peak levels in September. Stocks above their 20, 50 and 200 EMA are 19%, 30%, 50% respectively. Such weak breadth can be viewed in at least two different ways. Either there are more good deals in the market presently or breadth is pointing to a continued market breakdown ahead. (Chart from David Larew)
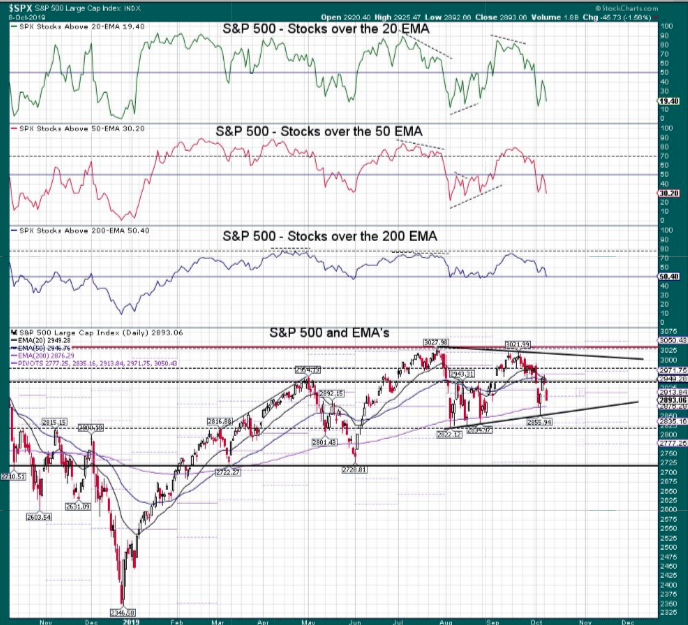
We can see in the chart above, every S&P 500 breadth indicator has moved lower, but generally, you get buying in the markets when it gets to these levels. But here’s the thing when it comes to market breadth: There’s more than one breadth indicator and they can often conflict with one another. Below is a perfect example of breadth indicators at odds with each other.
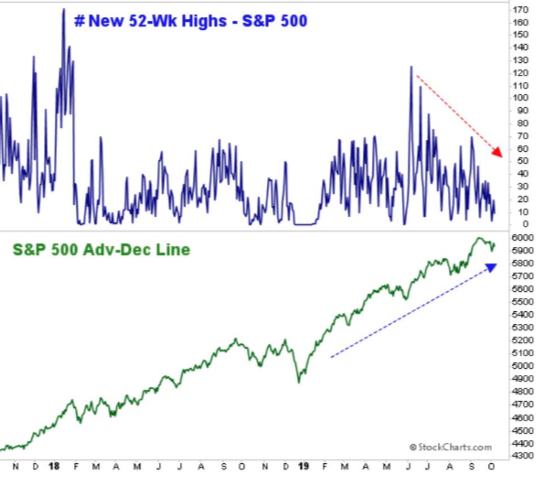
So which one is right? There is no right or wrong answer as no single breadth indictor can tell the full story. But that is why they should be viewed as a group in order to have the most information possible to attempt at a delivering a consensus. With these charting patterns and breadth indicators in mind, CNBC’s Jim Cramer discussed a warning from Bob Moreno, chartist at RightViewTrading.com who projected in February that the market had more room to run. Moreno warns of a possible plummet in the large-cap index.
“Now those same charts tell Moreno that we’re approaching an important moment and he’s predicting a major sell-off from these levels, a 10% decline in the S&P. That would bring the S&P below 2,620 from its 2,893.06 Tuesday close.“
Moreno believes the S&P is going to test its floor of support again, only this time that floor is at 2,825, Cramer said. “But if it fails, and he thinks it will, another floor at 2,725. That’s where the S&P bottomed in March and June.”
“Unfortunately, he doesn’t see that trading floor … holding either,” Cramer said. “If the S&P breaks down from the current consolidation pattern, we could have not a little but a lot more downside.”
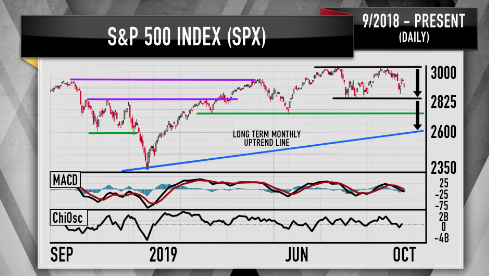
There are more bearish indicators in Moreno’s analysis. He notes the Moving Average Convergence Divergence indicator had a bearish crossover, which means momentum is slowing, and the Chaikin Oscillator supply/demand indicator dropped below its center line, which means money flow is negative, Cramer said.
Equity markets are clearly very fragile at the moment and with trade talks looming, they can tilt the market in one direction or the other. Some analysts have suggested that a significant trade announcement coming from out of the trade talks could move the markets 5 percent. We’re already seeing how sensitive markets are to trade headlines with an innocuous headline out of China Wednesday morning, hinting that China is still ready for even a narrowed deal of sorts.
Bloomberg reported, citing an official with direct knowledge of the negotiations, that China is still willing to talk about a possible agreement as long as no more tariffs are imposed by the President Donald Trump administration — including planned levies due this month and in December.
The report added that Beijing would offer non-core concessions like purchases of agricultural products in return, but not budge on major sticking points between the two nations. A deal is unlikely to come out of the latest talks, but some concessions and de-escalation is what markets will still likely find favorable. Goldman Sachs offered the following notes and/or game theory after the most recent trade headlines:
- China trying to narrow the scope of talks, the US blacklist….
- China banning the NBA
- U..S restricting visa’s to Chinese officials
- Expectations are now so low that even any marginal positive can send futures soaring higher…although what appears to be the most likely outcome is we end with no progress/maybe even a step back this week.
- Conclusion: high certainty on outcome but very poor risk/reward to being short into the event
Investors are clearly on edge heading into the Thursday trade talks, but willing to buy dips still yet, as Dow Futures are up some 200 points on the hopeful headline from China. It remains to be seen if a competing and adversary trade headline rears its ugly head once markets open for trading Wednesday.
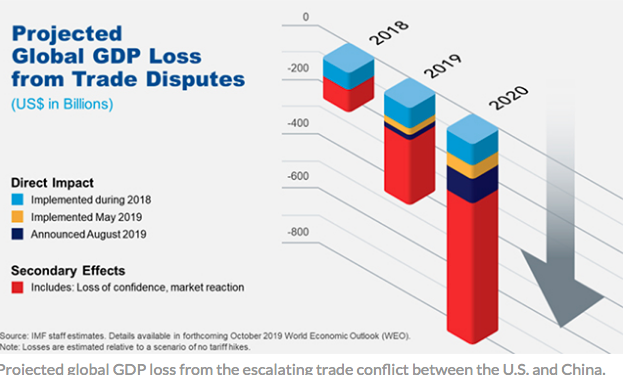
The protracted trade war has already cost the global economy greatly over the last 15 months. According to the IMF, the trade war between the U.S. and China could mean the loss of around $700 billion for the global economy by 2020, the new head of the International Monetary Fund said Tuesday.
“Everyone loses in a trade war,” said Kristalina Georgieva, who took over the helm of the international finance agency last month. Even if growth picks up in 2020, the current rifts could lead to changes that last a generation — broken supply chains, siloed trade sectors, a “digital Berlin Wall” that forces countries to choose between technology systems. In 2019, we expect slower growth in nearly 90% of the world. The global economy is now in a synchronized slowdown.”
The ramifications of the trade war between the world’s two largest economies will have lasting effects even if an agreement can be reached at some point. If the situation doesn’t improve, however, the U.S. economy will demand further assistance from it’s central bank and Jerome Powell. Investors are hopeful for improvement, but forced to wait with bated breadth. Will President Donal Trump prove more amicable and amenable to this week’s trade talks and negotiations. With the U.S. economy showing signs of increased slowing, his re-election may depend on trade outcomes.
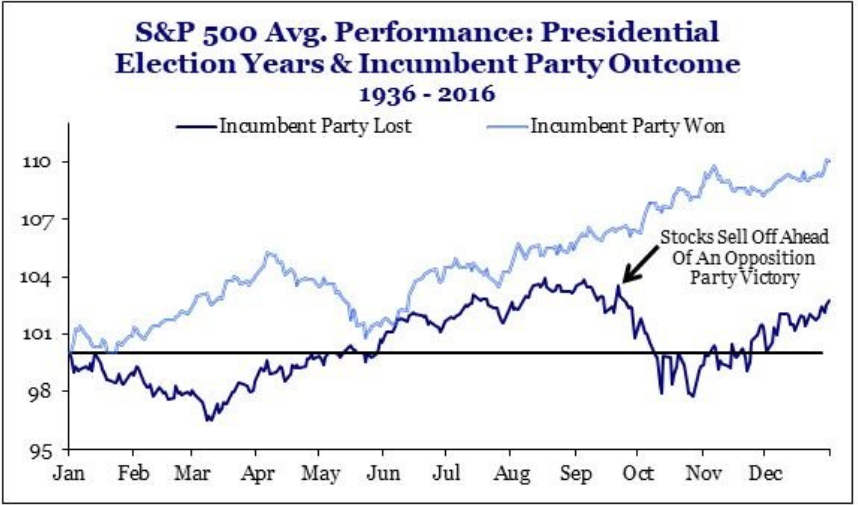
According to the chart above, from Strategas Research, the stock market has been a great indicator of Presidential elections. The incumbent party usually wins if stocks are up in the 90 days leading to election day. If stocks are down, the opposition party wins. This is true for every election since ’84 and for 90% of past 100yrs. And we know the President always has a watchful eye on the stock market.
Geopolitical headlines are currently the focus and usurping those longer-term market moving announcements from the onset of earnings season. As investors await Citigroup’s (C) earnings and the financial sector earnings next week, a looming earnings recession doesn’t favor a rising stock market either. Depending on how deep an earnings recession is, and what central bank activity is taken during an earnings recession, the market’s trajectory can differ.
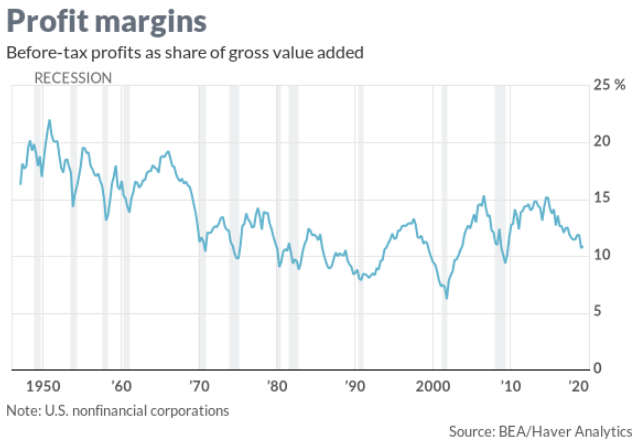
Profit margins remain high, but have weakened from peaks in 2015. The added pressure on profit margins from various issues like tariffs are causing some analysts to call for an outright recession in 2020. This is the call from Stephen Gallagher, who went on the record to forecast a recession in 2020.
“U.S. recessions are typically preceded by an erosion in corporate profit margins, or profit per dollar of revenue. Costs generally rise near the end of the cycle while sales flatten out.“
Since few corporations have any pricing power, the only way for managers to defend their margins against higher labor costs is to turn defensive, focusing on cost-cutting instead of growth. Once companies begin to reduce investment and payrolls, it’s only a matter of time before consumer spending stalls, according to Gallagher. While this may be true on the surface, it fails to complete the earnings cycle loop that also should include buyback influence on profits and/or EPS.
“With a backdrop of weak profit expectations, the trade uncertainty poses serious challenges for business planning. In an environment of much stronger profit margins, the same trade uncertainty would likely pose less of a deterrent.”
Gallagher expects the recession to be fairly mild. Aside from a need to correct excessive leverage in some sectors of corporate debt, he sees few other imbalances.
It’s possible that the Fed could cut interest rates aggressively enough to prevent an outright recession. Although lower rates won’t do much to resolve the underlying erosion of profit margins, they would ease the debt service burden on many over leveraged companies and consumers.
Not every analyst is as sanguine about the economy or stock market as Gallagher is offered. Capital Wealth’s market strategist Jeffrey Saut insists we are in a secular bull market and the stock market rally is far from over. What Saut is referring to is a rising or falling market trend, which can last from 5 to 25 years, but is peppered by smaller bear or bull markets, respectively. And most investors aren’t experienced enough to recognize either.
“The point is, a secular bull markets last 15-plus years. You can run how long this thing should last, either from October of 2008 or March of 2009 or April of 2013. The point is there ought to be years left in this thing and no one believes it.
Investors are “scared to death,” convinced by the media that a recession is coming and putting too much faith in soft data such as economic surveys. If we’re going into a recession, why are the most economically sensitive stocks, mainly the semiconductor equipment stocks, holding up so much better than the S&P 500?”
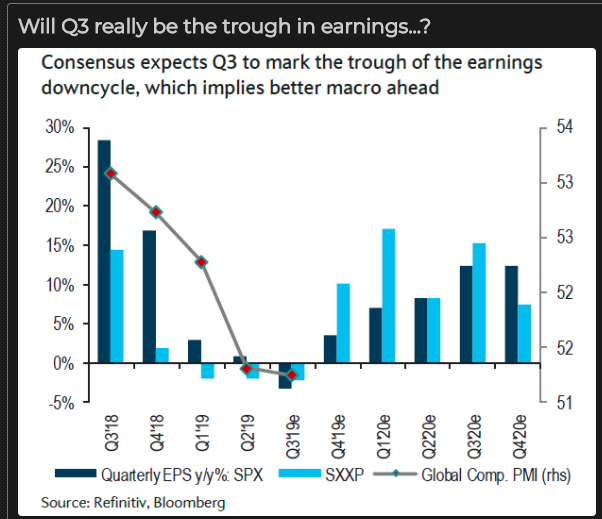
The near-term market issues will be concluded as earnings season accelerates into next week and trade talks coincidentally conclude this week. Analysts are still baking in the trough in EPS deceleration for Q3 2019.
There’s a heck of a lot going on right now and traders are forced to become even more active or reactive to headlines. The headlines are nothing new to the markets and investors. There’s always something looming in the geopolitical realm and there is always a breaking news story to cover. Nonetheless, with each passing year the market moves contribute to a rather consistent and reliable pattern…
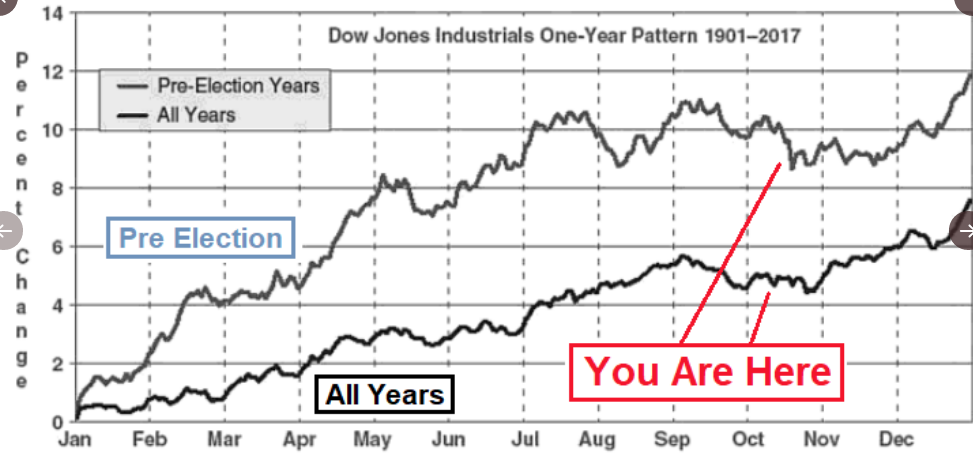
… most of the time. Clearly, the seasonal pattern did not play out in 2018, but it is also extremely rare for the market to express 20% drawdowns in consecutive years or to have back-to-back down years. The last time the S&P 500 was down two or more consecutive years on a total return basis (including dividends) was way back in 2000 to 2003, when it was down 3 consecutive years, according to data from the Stern School at NYU. But that is rare: there have only been four instances since 1929 when the S&P 500 declined 2 or more years in a row. In the worst case, the S&P 500 was down 4 consecutive years, from 1929 to 1932.
The S&P was down three consecutive years twice: 1939 to 1941, and 2000 to 2002. It was down two consecutive years only once: 1973 and 1974.


