
Welcome to our weekly edition of State of the Markets. Please click the following link to review our take on what is moving the markets and what to expect within the context of portfolio positioning given the macro-fundamental backdrop!Outline:

Outline:
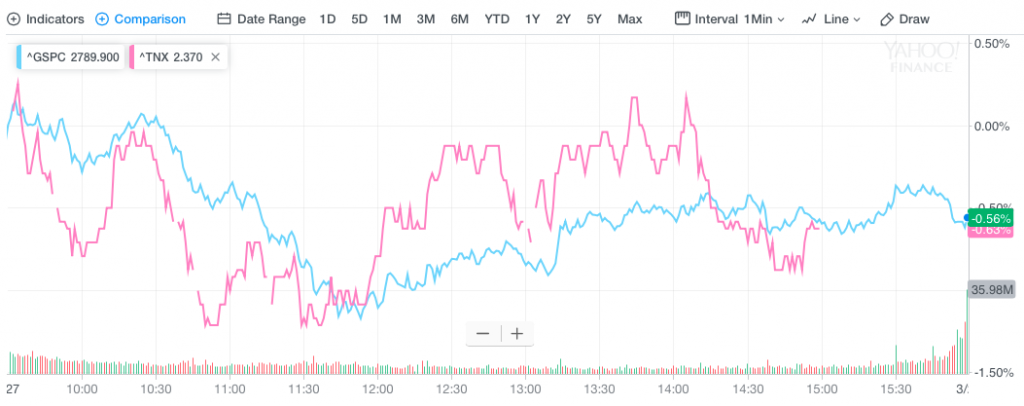
- Introduction to State of the Markets. Briefly touch on market volatility, VVIX broke above 100 briefly before retracing. S&P 500 has been following the ticks in bond yields. Bond yield inversion (3mnt-10yr.)
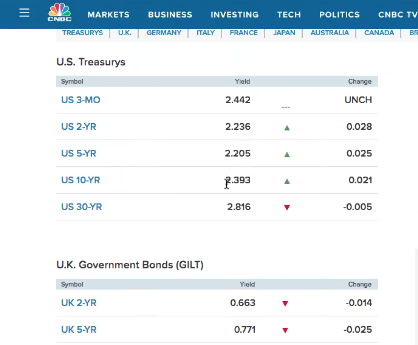
- Yields tick higher, but 10-yr still below Fed Fund target rate of 2.40%. (0-6minutes in)
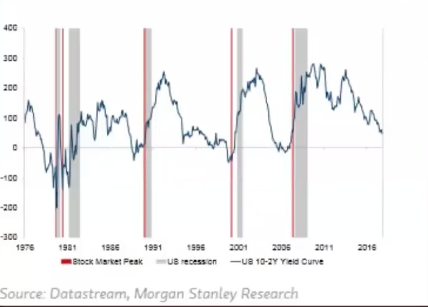
- With yield curve inverted, what’s next. Recession clock starts ticking according to the chart below from Morgan Stanley.
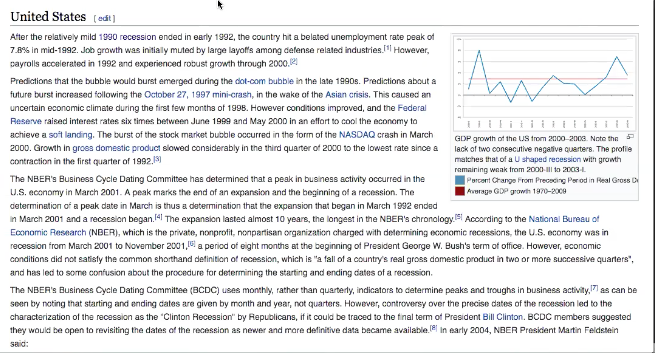
- NBER does not define a recession with having 2 consecutive quarters of negative GDP growth. In 2001, there was not this condition and the “recession” only lasted 8 months and GDP was 1% for the year. Yet NBER, 2-years later, classified 2001 as a recession.
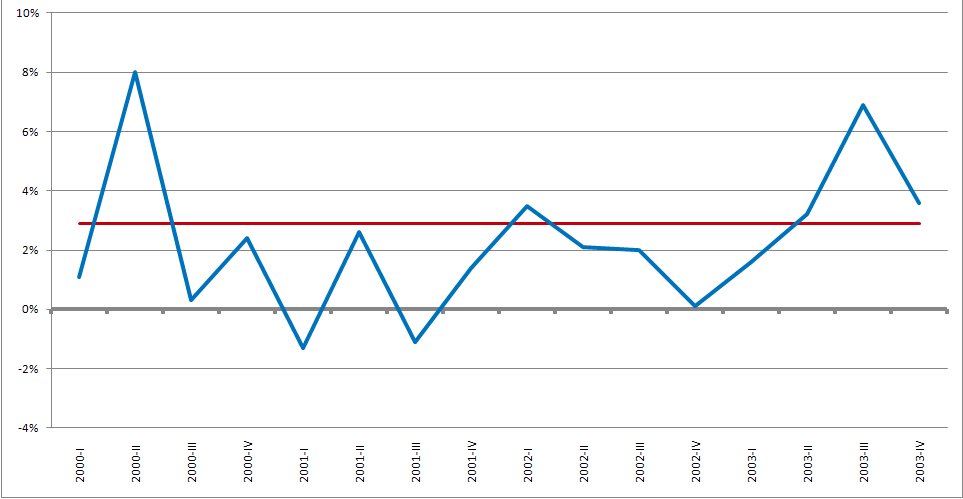
- In truth, this was the shallowest recession ever and only recession with a positive annual GDP. If we remove 2001 from the recession classification, how does that change the statistical data relating to how the S&P 500 performs once the yield curve inverts and until a recession takes place? (6-12 minutes in)
- Discussion on the misconception of BUYBACKS and BLACKOUT periods.
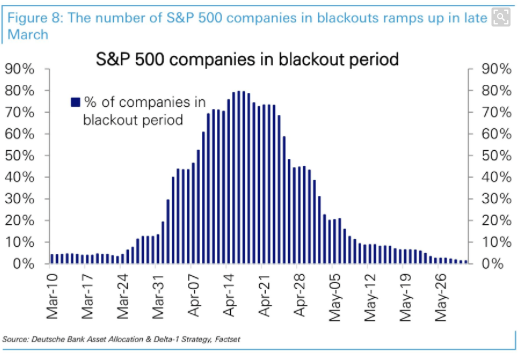
- Blackout periods are mandated by company and put forth with discression. Most blackout periods begin 10-days from the date of the reporting date, not the beginning of earnings season as a whole.
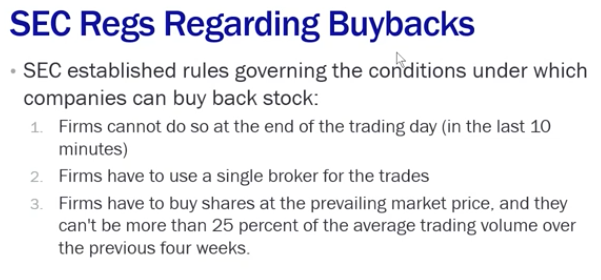
- Firms do not have to register the buyback plan with SEC. A plan must be in place nonetheless and it should abide by the rules noted above. Companies and executives are permitted to execute share transactions during blackout period provided there is a predefined plan. (12-24 minutes in)
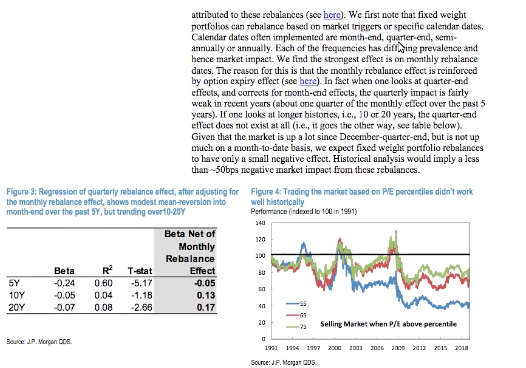
- Month end rebalancing doesn’t really have an effect over the long-term (10-20 years). It’s more a consideration from traders who live in the quarterly moment than something that actually affects the market. (24-28 minutes in)
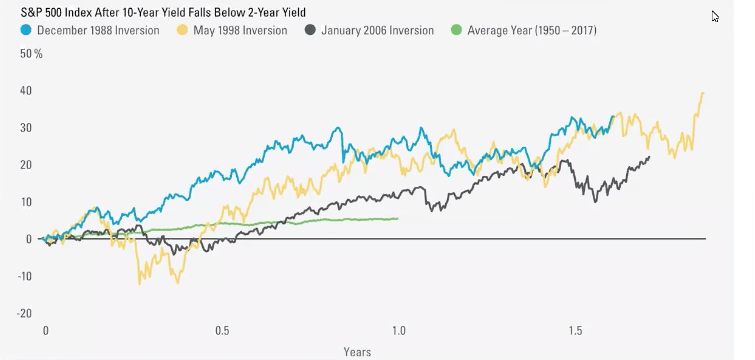
- LPL Financial Chart above identifies what happens to S&P 500 typically once the bond yield curve inverts. Results are usually significantly better than when the yield curve is normal. But what happens if you take the 2001 recession off the table.
- 2001 included the dotcom bust (crashed Nasdaq, but not S&P 500 or Dow Jones Industrials) and 9-11 event.
- Trip down Seth’s memory lane on 9-11. (28-36 minutes in)

- Brexit deadline still looms. Flight out of Pound and Euro continues, strengthening the U.S. Dollar (DXY). The hunt for yield has served to boost U.S. bond prices and sent yields lower.
- U.S. economy is slowing YOY, but within normal trend of 1.5-2.25% annual GDP rate of growth. With bond yields coming down, the 30-year fixed rate mortgage has fallen to its lowest level in 14 months at 4.06%.
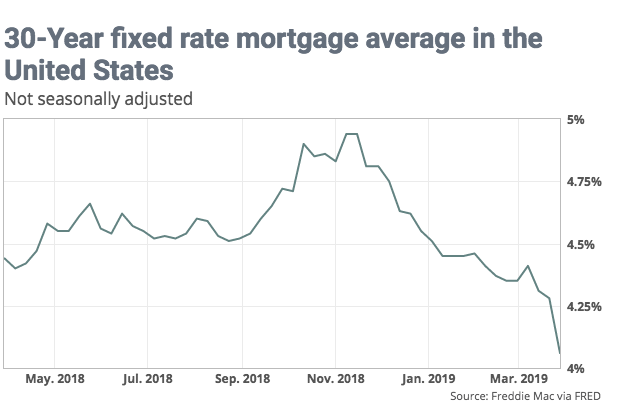
- Housing sector data seems to be bottoming as mortgage rates have been lower YOY. Demographic obstacles still remain, despite better housing affordability statistics/metrics. Jobless claims continue to move sideways/lower week-2-week. Nonfarm Payrolls due out next week.


