Welcome to another trading week!! In appreciation of all of our Basic Membership level participants and daily readers of finomgroup.com content, we offer the following excerpts from our Weekly Research Report. Our weekly report is extremely detailed and has proven to help guide investors and traders during all types of market conditions with thoughtful insights and analysis, graphs, studies, and historical data/analogues. We encourage our readers to upgrade to our Contributor membership level to receive our Weekly Research Report and State of the Market Videos and take advantage of this ongoing promotional event today before our membership fees rise in the month of June! Have a great trading week, be in touch and take a look at some of the materials in this weekend’s published Research Report!

Research Report Excerpts #1
The S&P 500 was recently greater than 13% above it’s 50-DMA. That is extremely overbought, but tends to happen closer to the start of new bull markets than the end of bull markets. So this is actually a longer-term net positive occurrence in the market, yet again validating the new bull market that we identified 2 weeks ago. Nonetheless, it’s rare to see the S&P 500 trading this much above the 50-DMA. (Table issued before peak in SPX)
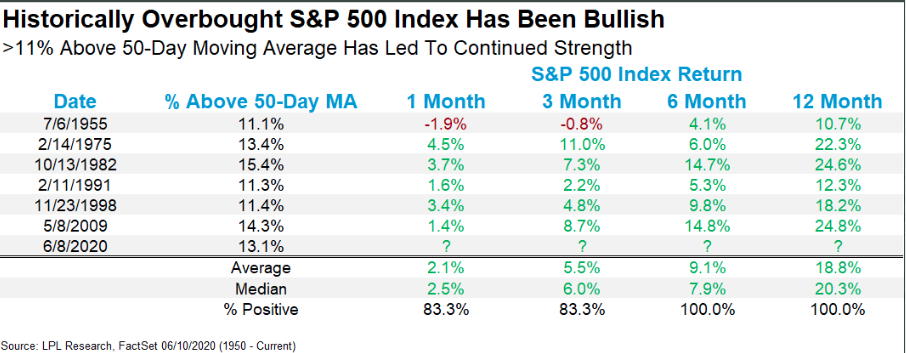
As shown in the LPL Financial table above, this has only occurred back in ’55, ’75, ’82, ’91, ’98, and 2009. The good news is that after all occurrences, the market was always higher 6 months and 12 months later. Even when looking at the 1-month later column, most years produced a positive return. The table emphasizes the nature of new bull markets that have also seen strong breadth thrusts, something we discussed in last weekend’s Report titled “The Bulls Are Back In Town After a Brief Vacation“. If you haven’t read it yet, do check it out to better understand the power of breadth thrusts and the probabilities that align positively for market returns going forward.
Research Report Excerpt #2
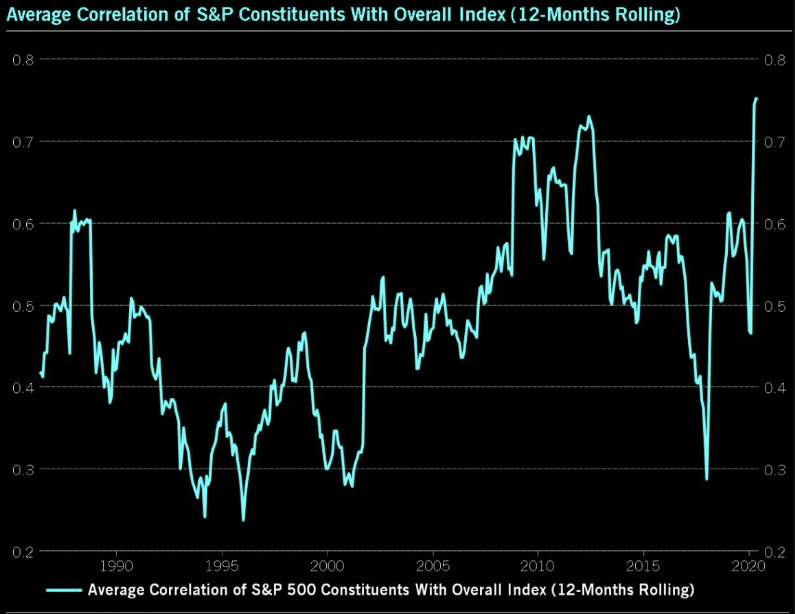
We’ve never seen correlations among individual stocks this high in history, or as far back as they’ve been tracked. Correlations were at an extreme level. So when the market was moving higher, most stocks were moving higher and when the market decided to turn lower, most stocks did so as well. It didn’t matter if the fundamentals were strong or weak, most stocks were moving higher. Friday’s snap-back rally further emphasized this point of stock correlations.
- 97% upside day in the early morning on Friday.
- Was 94% downside at 10:15 Thursday morning.
Research Report Excerpt #3
Rounding out our market technical and historic data analysis, let’s Remember what Capital Wealth’s market strategist Jeffrey Saut offered earlier this past trading week as well:
- New high for the S&P by year-end: It’s a bull market.
- The problem right now is that as few have experienced a secular bull market, the last was 1982 to 2000, most can’t understand what’s going on.
- “I think we’re working up to a near-term trading peak in mid-June, but it could be that it doesn’t really pull back and just consolidates and goes sideways, and you get another leg up to make new all-time highs.”
- As for the risks, a second wave of the virus or a policy mistake out of Washington can’t be ruled out.
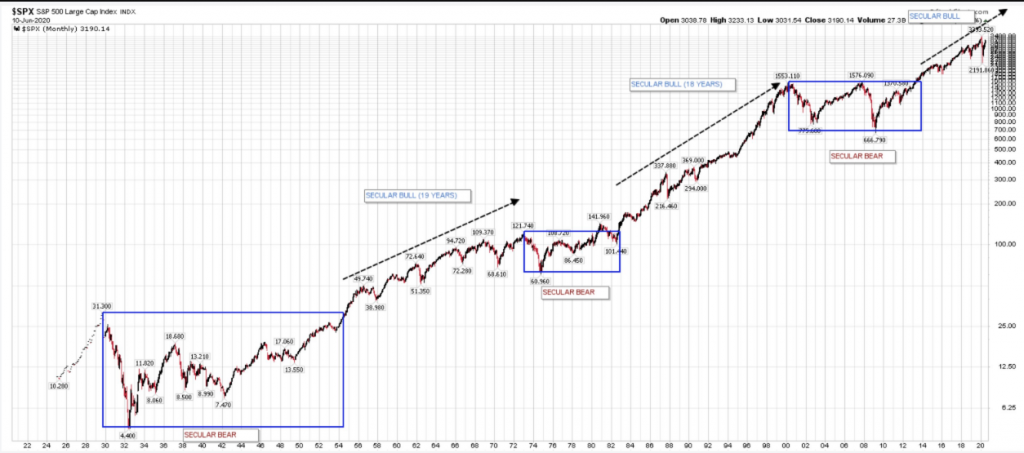
And the chart below is a perfect depiction of what Saut was offering to investors with regards to a secular bull market. In the chart below, we see a secular BEAR market (boxes) begin in 1929 and end in 1954. It was followed by a 19-year Bull market (arrows) before beginning another secular BEAR market from 1973-1983. Another secular BULL market commenced in late 1982 and persisted over the next 18 years and before another secular BEAR started in the late 2001, culminating in 2014.
Research Report Excerpt #4
Much of the economic data does point to a V-shaped economic recovery, initially. But after the V-shaped recovery we may see wavy patterns on the second leg of the anticipated recovery.
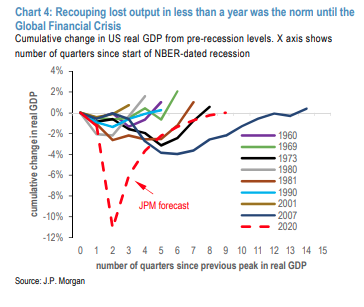
The one bright side of the even steeper slide is that it could point to a sharper recovery at least in the short term, said Ed Yardeni of Yardeni Research. He projects the third quarter to see a 20% rebound followed by a 5% gain in the fourth quarter.
“Beyond that, we agree that it could be a swoosh with low single-digit growth rates. We don’t expect that real GDP will recover back to its Q4-2019 record high until late 2022.”
“So the initial V-shaped rebound could eventually turn out to be a swoosh. This outlook allows for the possibility of a second wave of COVID-19 infections, though not as bad as the first wave and without another round of lockdowns.”
J.P. Morgan sees even greater improvement in the 3rd quarter and beyond as noted below, but in keeping with the chart just above, the firm aligns with Yardeni’s outlook:
J.P. Morgan: “Our view has been that the post-GFC period is the
appropriate template for the next two years, but that it might be tough to distinguish between a typical and an atypical recovery this summer when global growth rates exiting lockdown could be extraordinary (JPM forecasts 35% annualized quarterly growth in Q3 and 9% in Q4).”
Research Report Excerpt #4
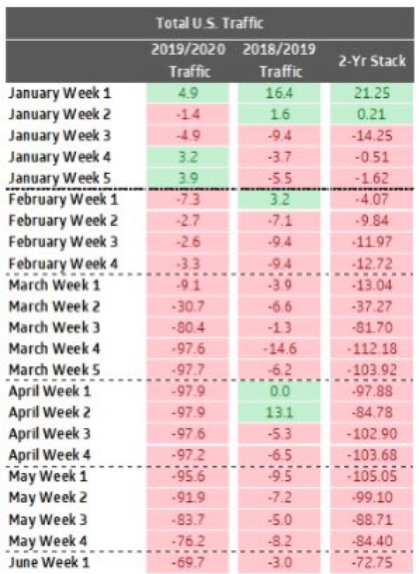
- US retail traffic, last six weeks:
- * down 97.2% * down 95.6% * down 91.9% * down 83.7% * down 76.2% * down 69.7%
Research Report Excerpt #5
It’s your job as an investor to sift through the hyperbole to find the facts in the data, and of course we will help facilitate the process. All we’ve heard over the past week is how the infection rate has increased in a handful of states. By the end of the week, naturally the market faltered but the infection curve actually fell again Friday and with the number of tests rising to a record level. (Positive test results percent ticked higher on Saturday)
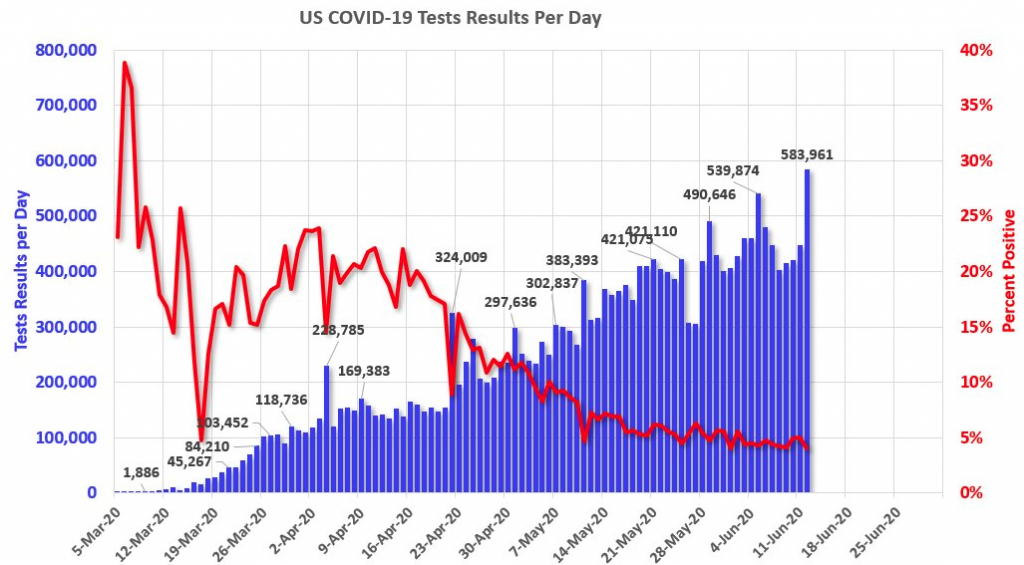
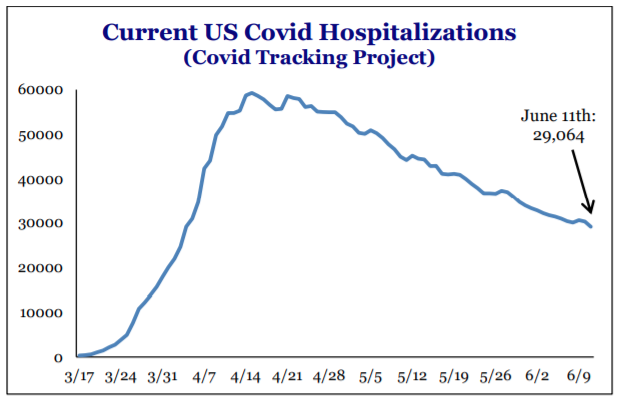
Not only did the infection rate drop back to the lowest levels since tracking the pandemic began on Friday, but hospitalizations continue to break down to new lows.
Research Report Excerpt #6
For Finom Group members whom join us in the Trading Room throughout the trading week and wonder why we focus on credit spreads, the following chart identifies the reason and why J.P. Morgan also took recognition in recent notes to clients: (chart from Guggenheim)
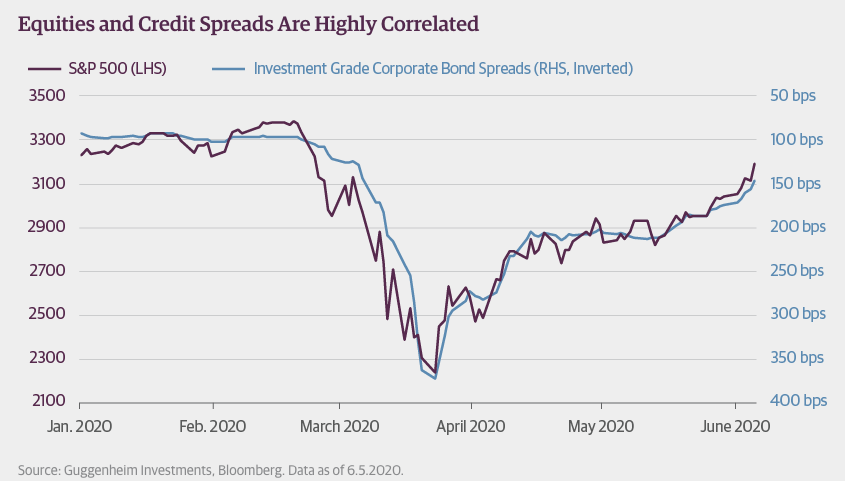
Equities and credit spreads are highly correlated. When they are found widening, equities come under pressure. When credit spreads tighten, equities typically rise in value.
Research Report Excerpt #7