Investors and traders are likely pulling their hair out at the roots, bumbling and tumbling through one of the longest and deepest bear markets in history, and without a recession to boot… yet! One of the BIGGEST issues for many investors contending with this ongoing bear market is how out of cycle it seems. Think about what happened last year, now that we are more than halfway through the first quarter of 2023. If the conclusion drawn after deep consideration is as simple as the word “nothing”, and not to diminish the impacts of a Russia/Ukraine war, from an investors perspective that is probably pretty accurate. Nothing really happened. I mean, for all of the recessionary, profit margin, housing and manufacturing crash cries alongside the fastest and/or greatest rate hike cycle in history, nothing of great consequence happened when juxtaposed with the average, American household’s standing. If that’s the case, why the ongoing bear market? Why does the fear of an even greater downturn in markets persist, f0r which investors feel they simply can’t shake and history does not offer any hopeful examples? Or… does it? A better question, as an investor; “Why have so many forgotten that markets are forward-discounting mechanisms engaged in an ongoing operation.
Before we take a look at some data for similar macro-market circumstances, what I’d like to suggest is that no matter how popularized, no matter how sophisticated, and no matter how eloquent a thesis pertaining to the next move in markets or a price target for the year-end, nobody actually knows for sure where the market will be next week, next month, or by year-end. Nobody! All any market participant, analyst, or investor can do is pay attention to trends, follow a disciplined strategy for long-term investing and let the history of the market repeat itself into perpetuity and by going higher over time. Anything outside of an uptrend is opportunity, as history has proven.
As appealing as it may seem to try to time in and outs of the market, for fear of large drawdowns, the following chart identifies this as a futile and nonsensical exercise.
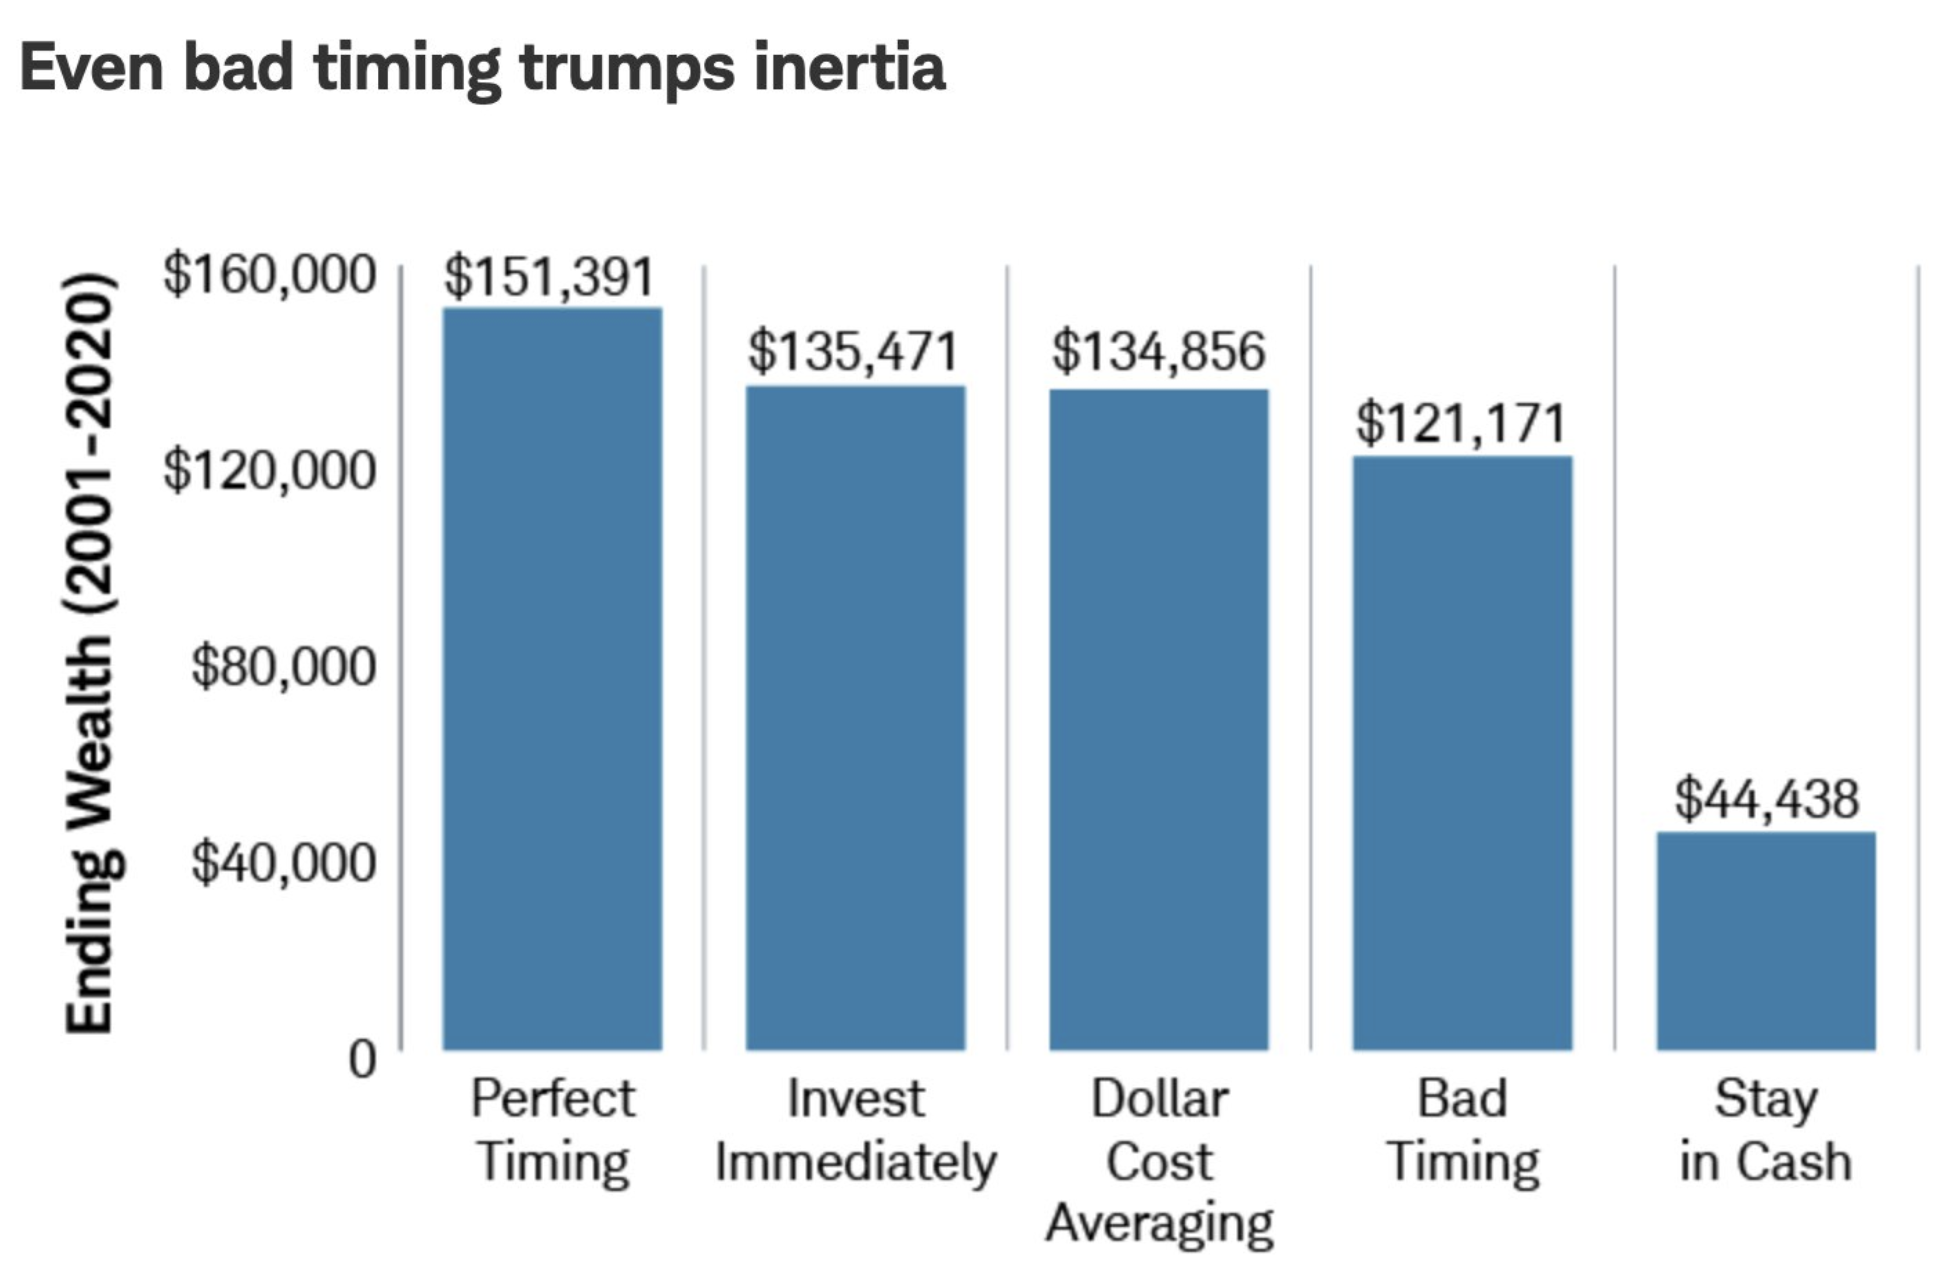
The lure of outperforming the S&P 500 with market timing exercises is often a sign of ignorance or a “non-investor” altogether, putting on shows of analyzing market conditions, while maintaining a perma-cash pile. Even the best market timer has only minimally better performance than “Buy Any Time/DCA/Bad Timer.” That’s a whole lot of time wasted trying to time market ins and outs for only a modest chance out modest outperformance, compared to the alternatives.
There are a litany of Wall Street strategists littering the investor airwaves daily, and with opinions about the interim and full-year outlook for the markets’ direction. The opinions, price targets, and analysis are very wide ranging, with the most bullish thesis seeing the S&P 500 go as high as 4,750 to the most bearish thesis finding the benchmark index falling all the way to 3,400, in the current calendar year.
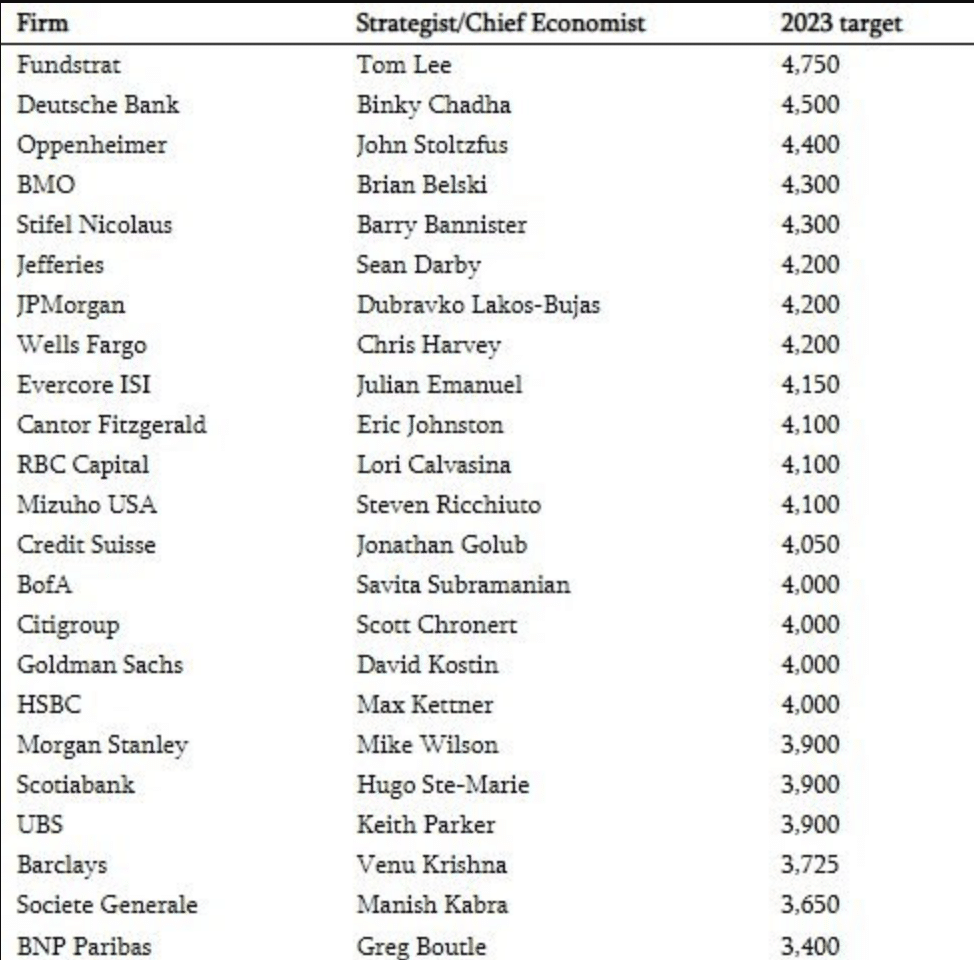
I’ve long since been of the opinion that the market would be able to achieve 4,350 in the calendar year, and remain with this outlook for Finom Group members. My full-year 2023 Outlook and analysis can be reviewed with a Contributor or Premium membership, but for now let’s discuss why the downside targets may be fashioned by hope, rather than analysis or precedence.
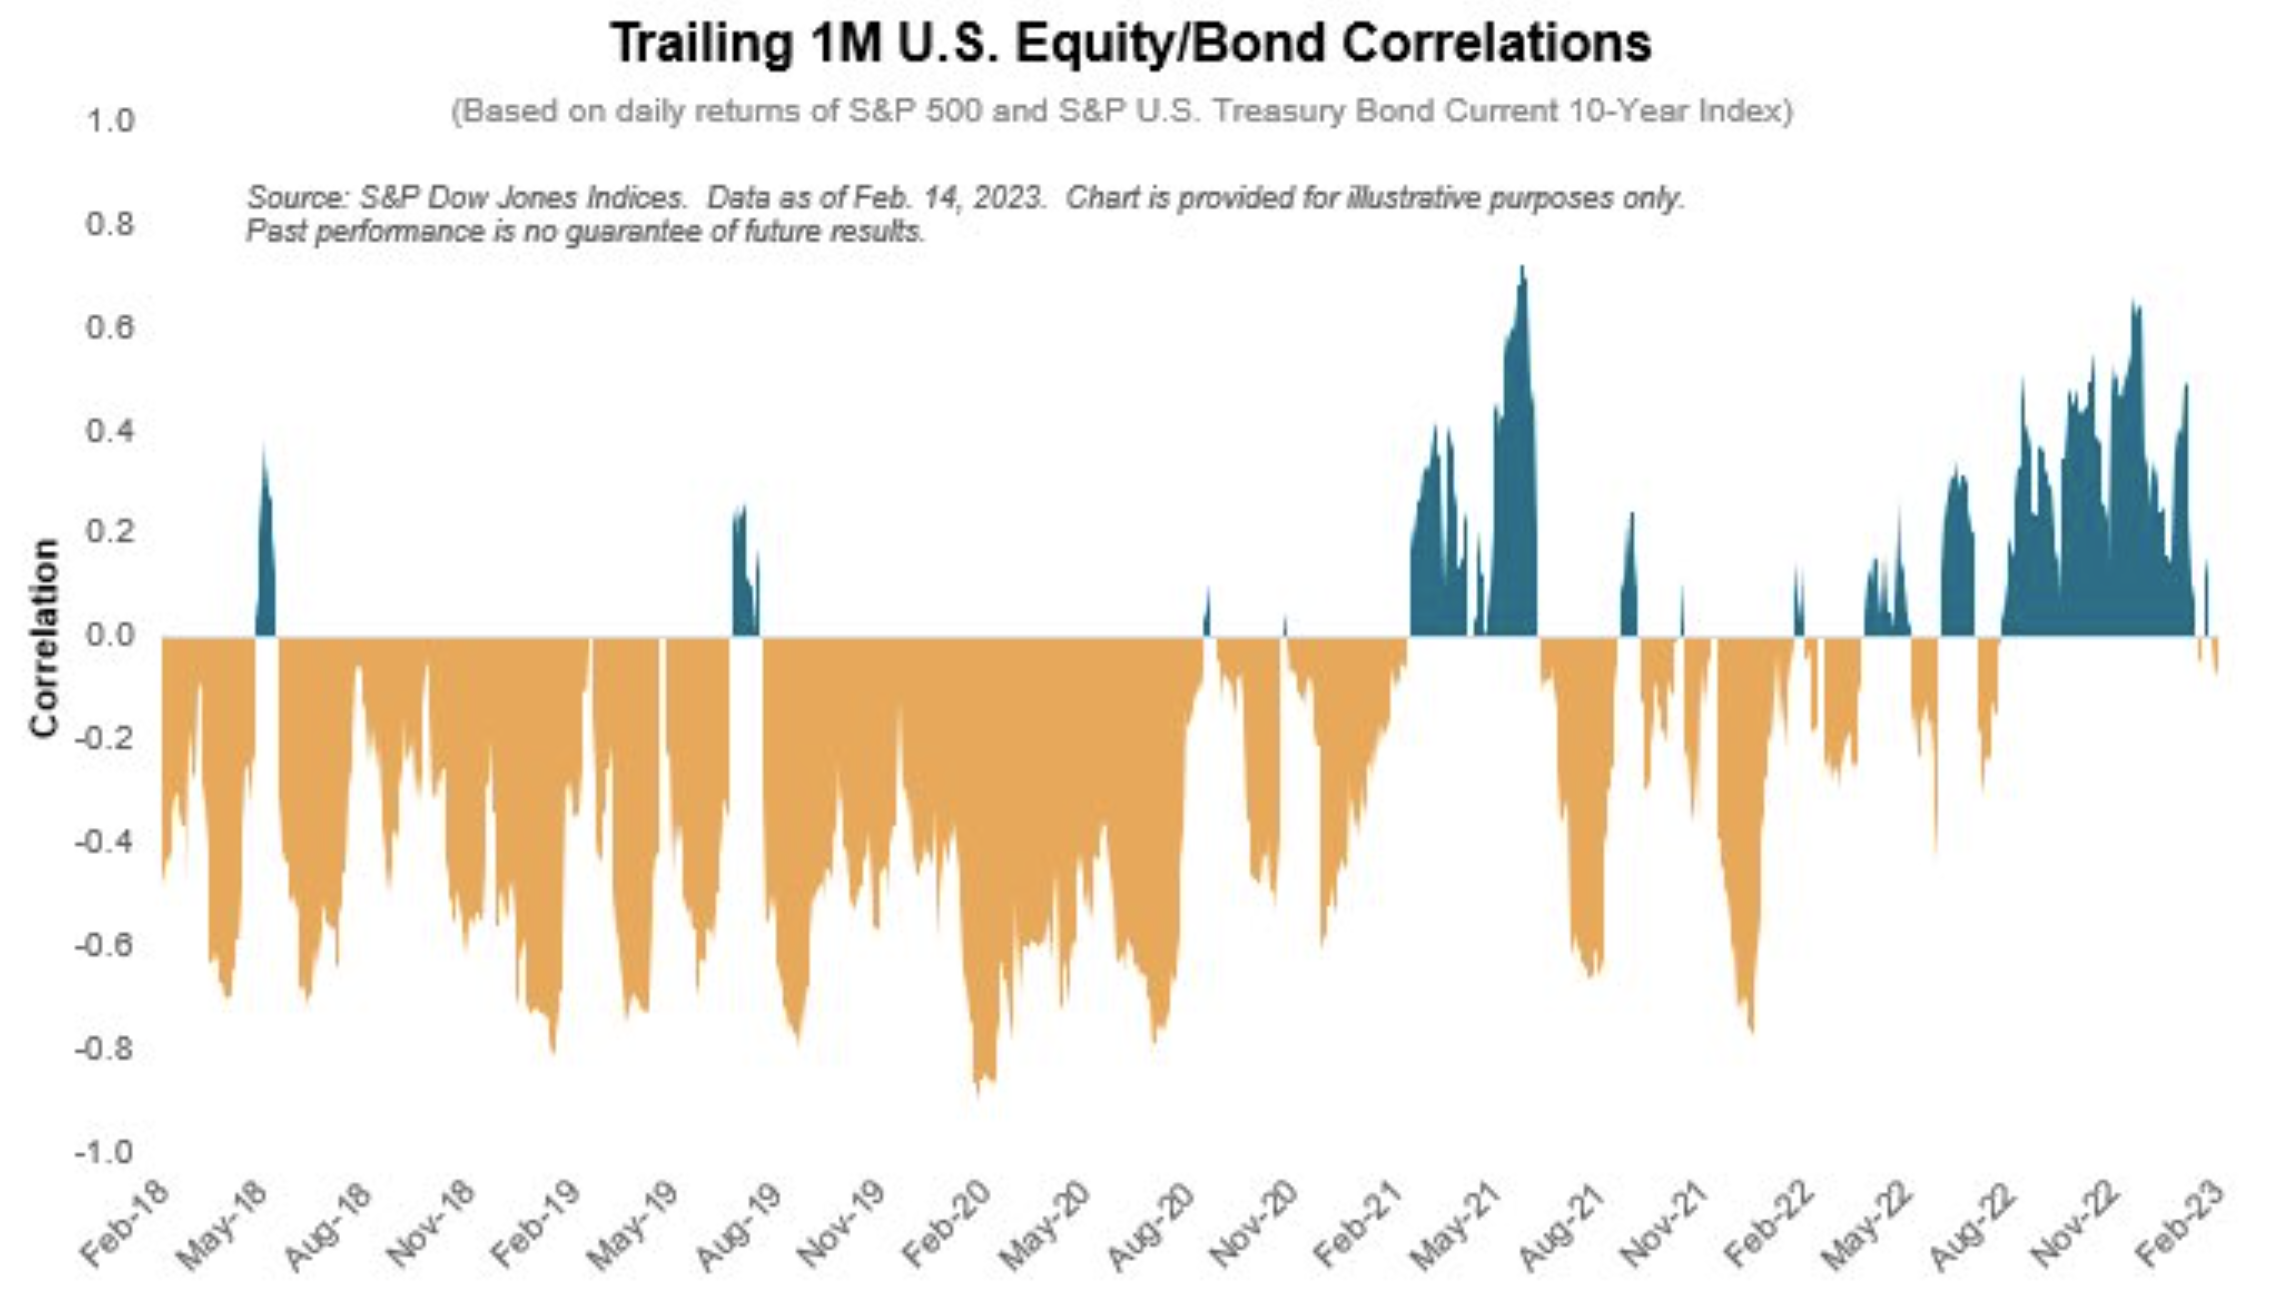
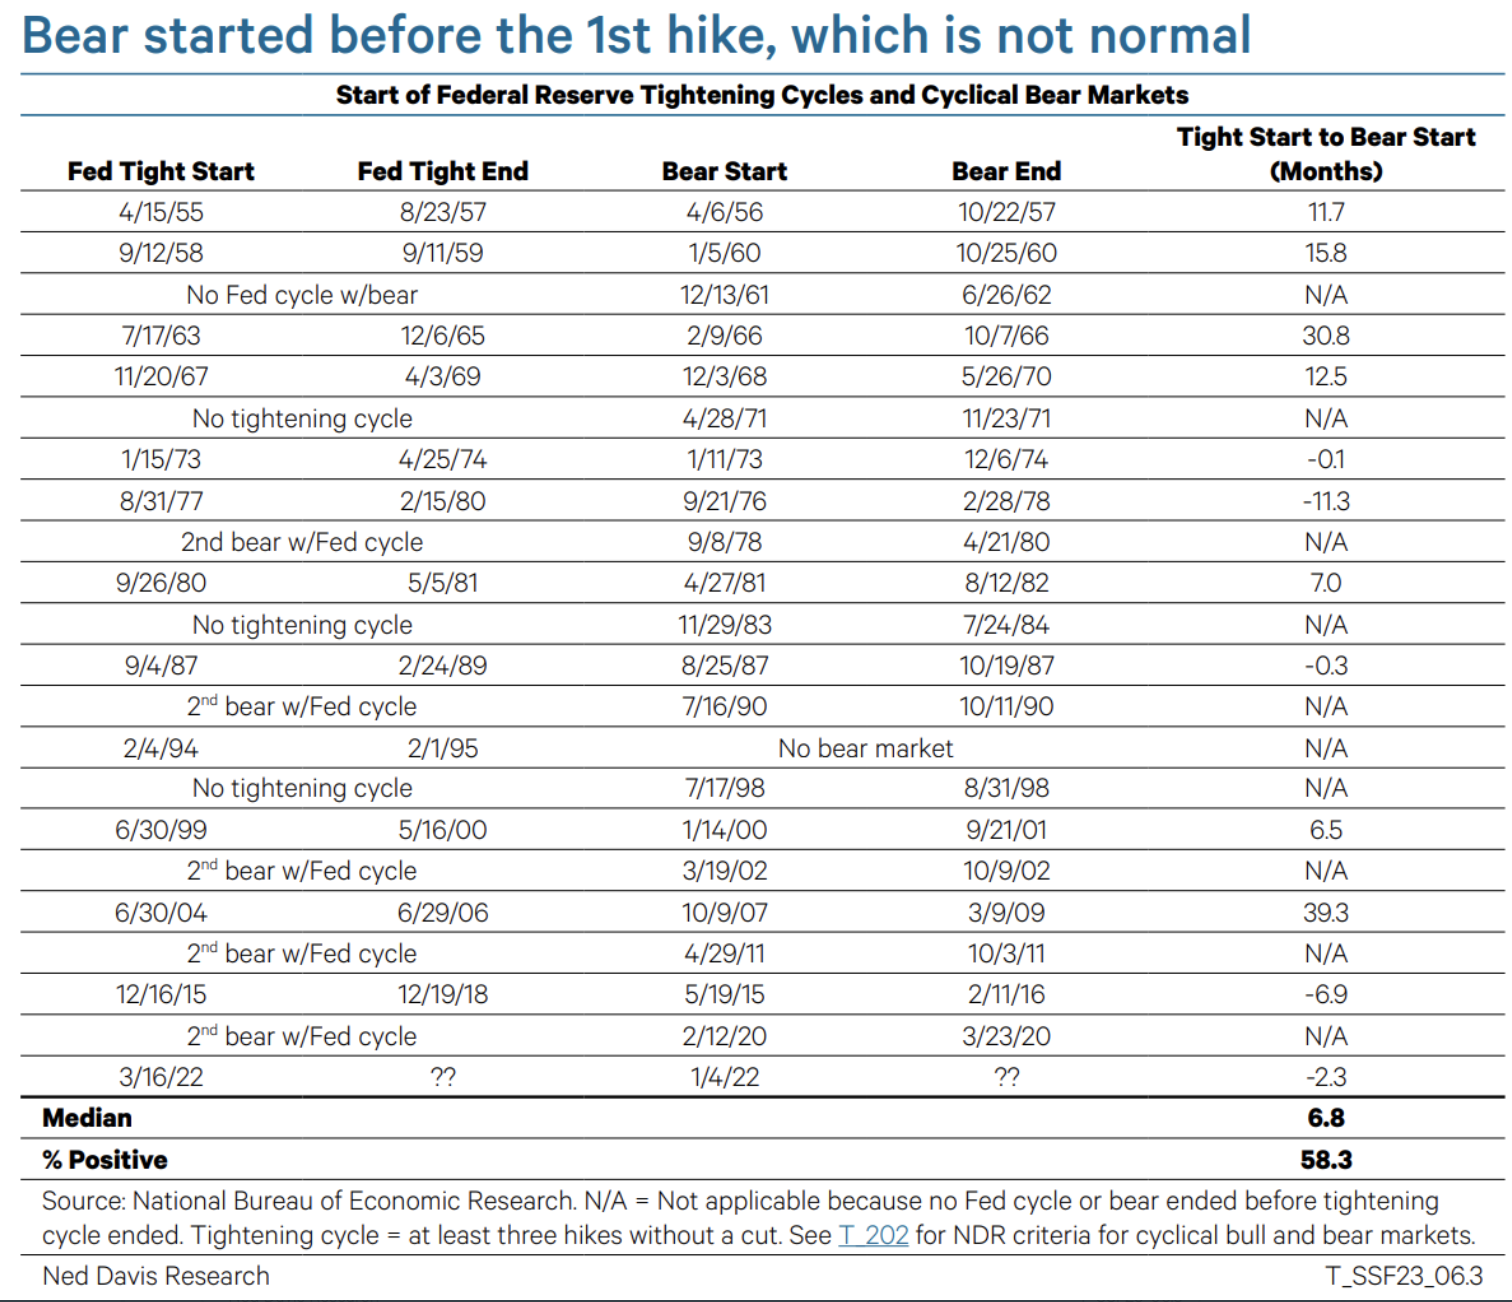
There’s been a lot made of the ongoing rate hike cycle. “Don’t fight the Fed” has been the drumbeat, which in and of itself has no historic legitimacy or practicality. At Finom Group, we thank the Fed for the value it creates, if it is even created, during rate hike cycles and even though rate hiking cycles are typically met with higher prices. Go figure right!
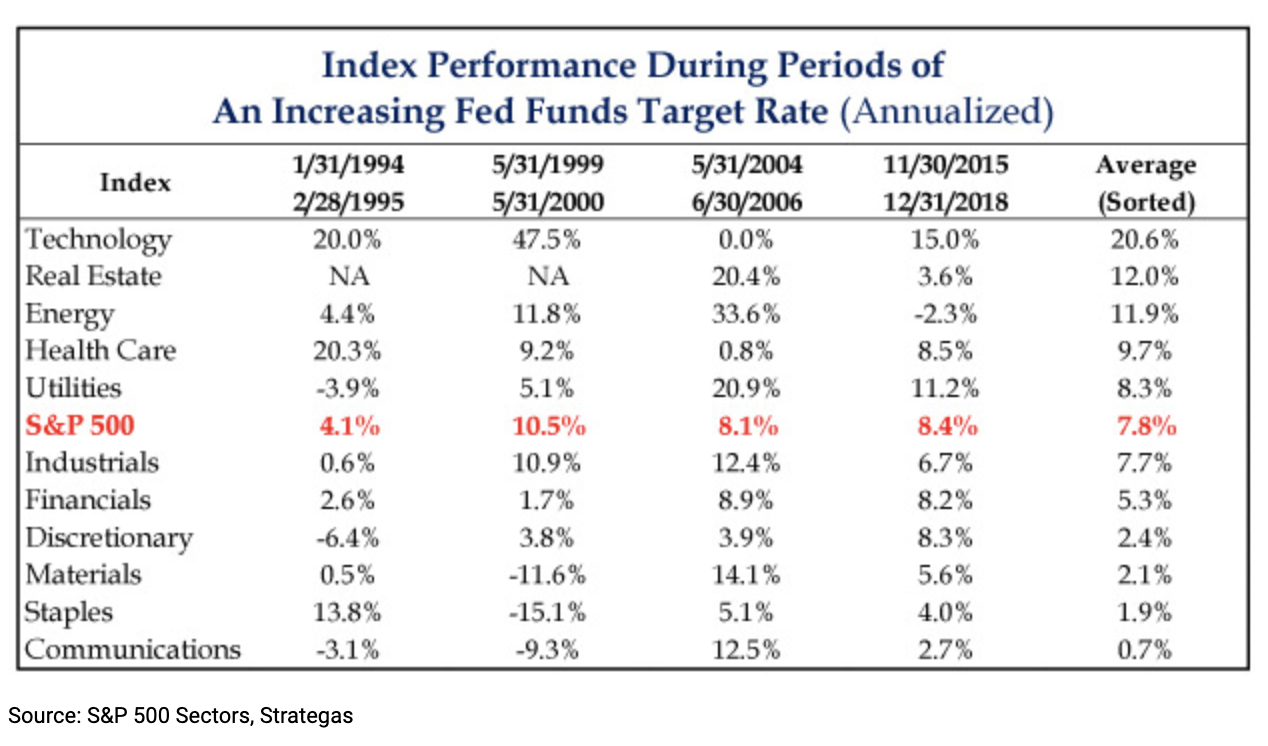
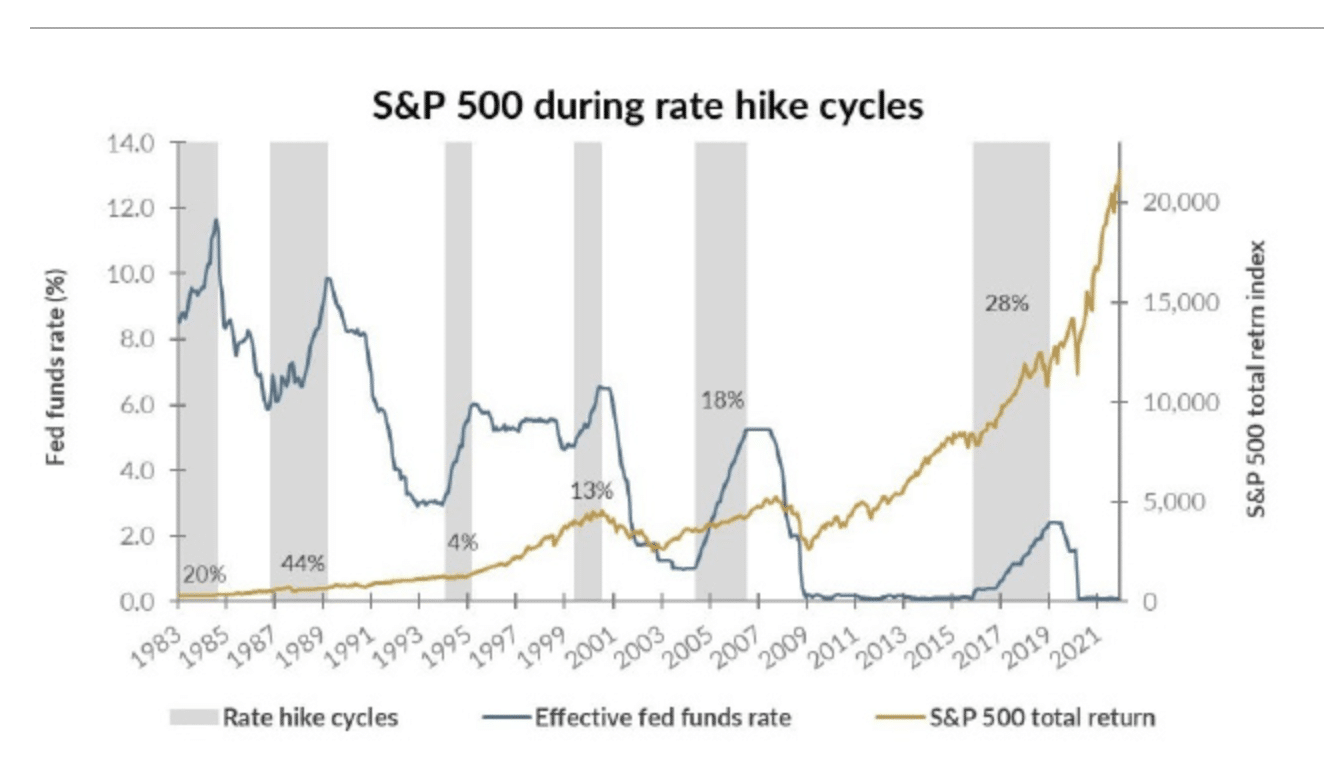
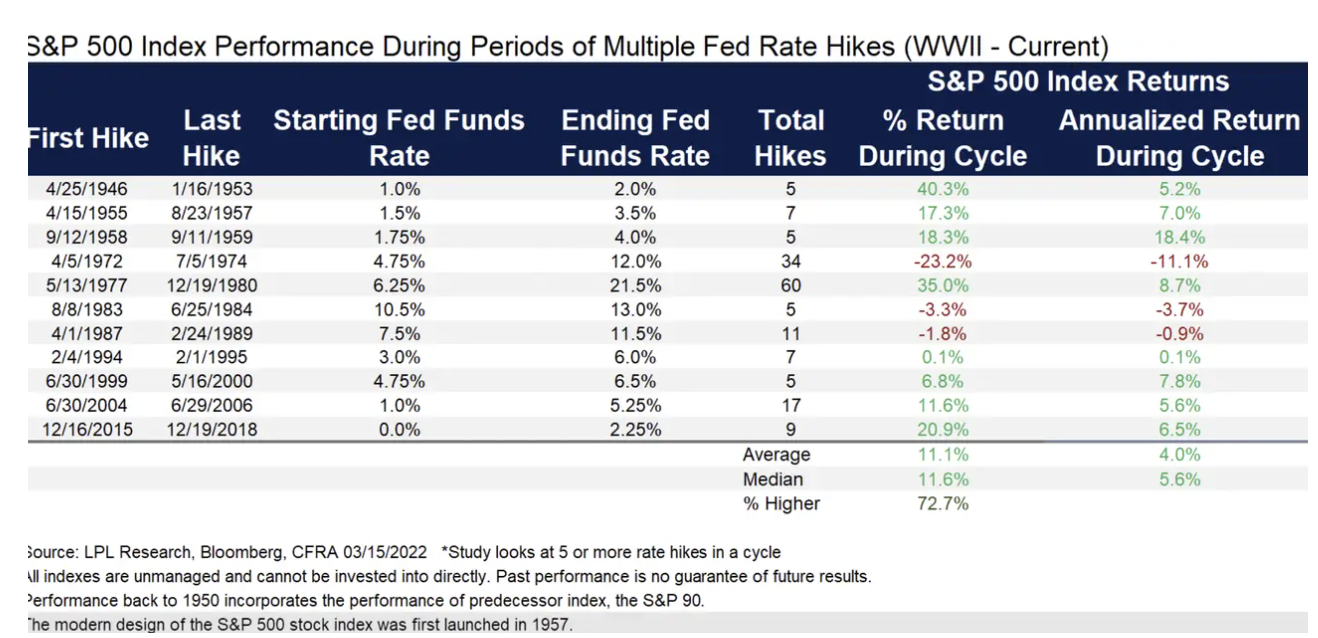
As demonstrated by the table and chart above, past rate hiking cycles have been met with higher S&P 500 prices more often than not. I could go all the way back to 1950, and the story is very much the same.
- Since June 16, 2022, the Federal Reserve has raised rates 6 times, from 1.5% to 1.75% to 4.50% to 4.75%. Since then, the S&P 500 is +9.5%, the NASDAQ is +7%, and the Russell 2000 is +15.52%. Tell me more about how rising rates are bad for stocks.
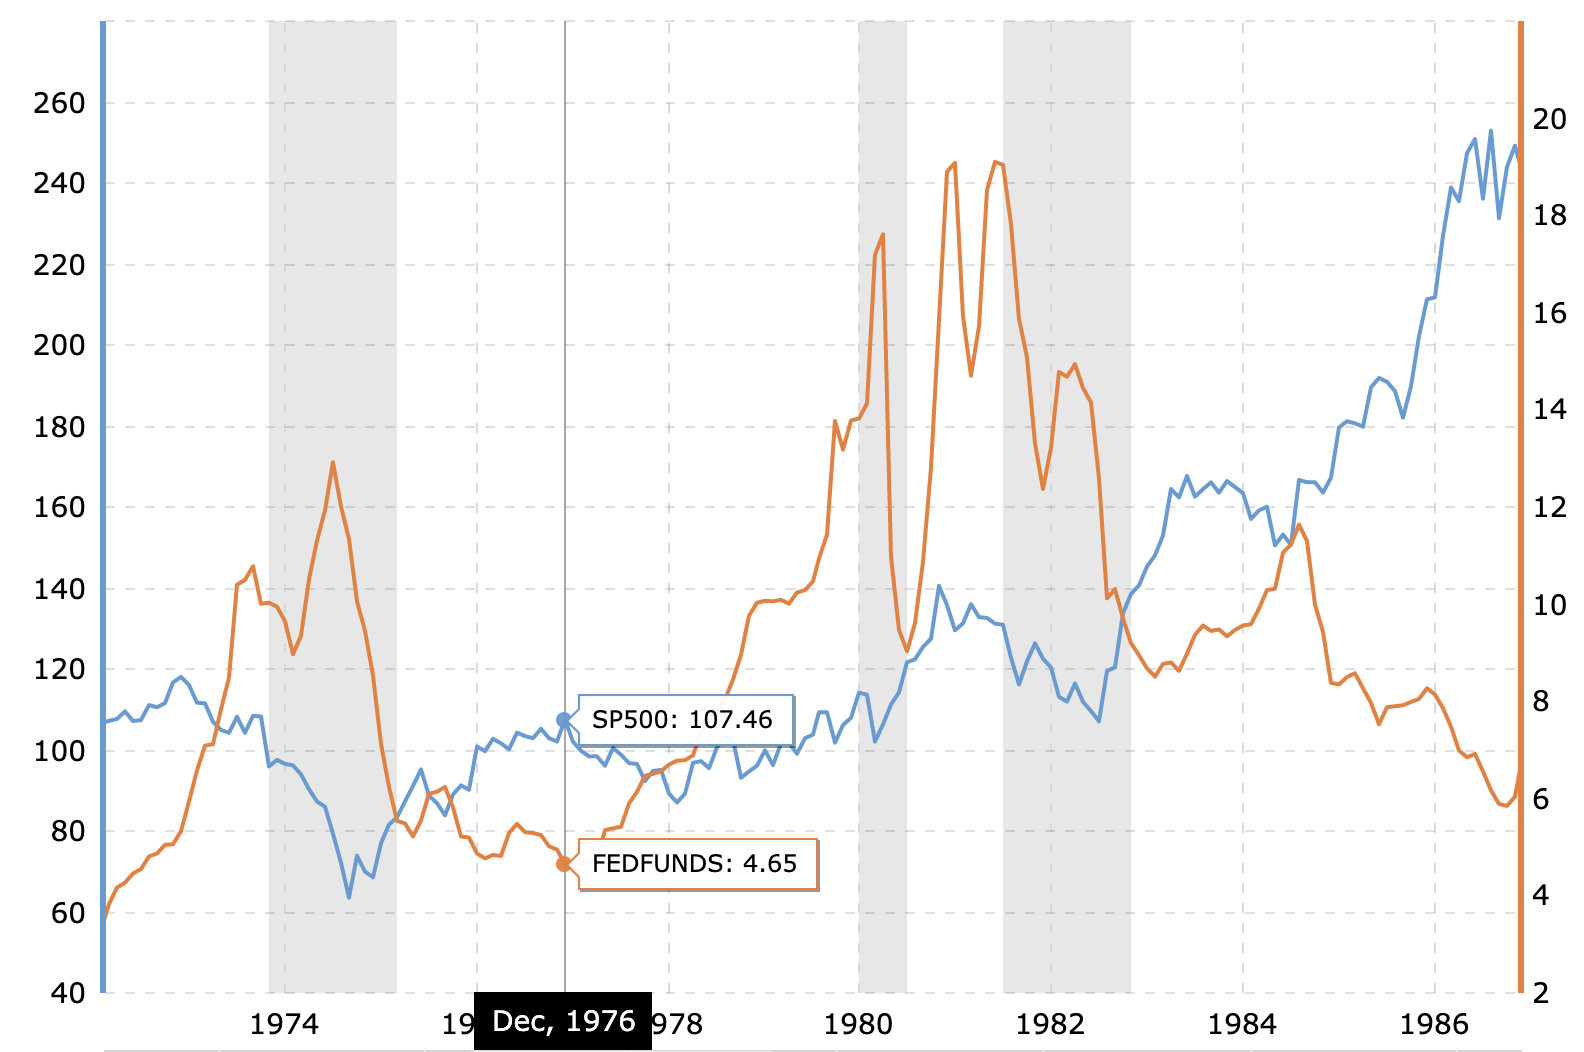
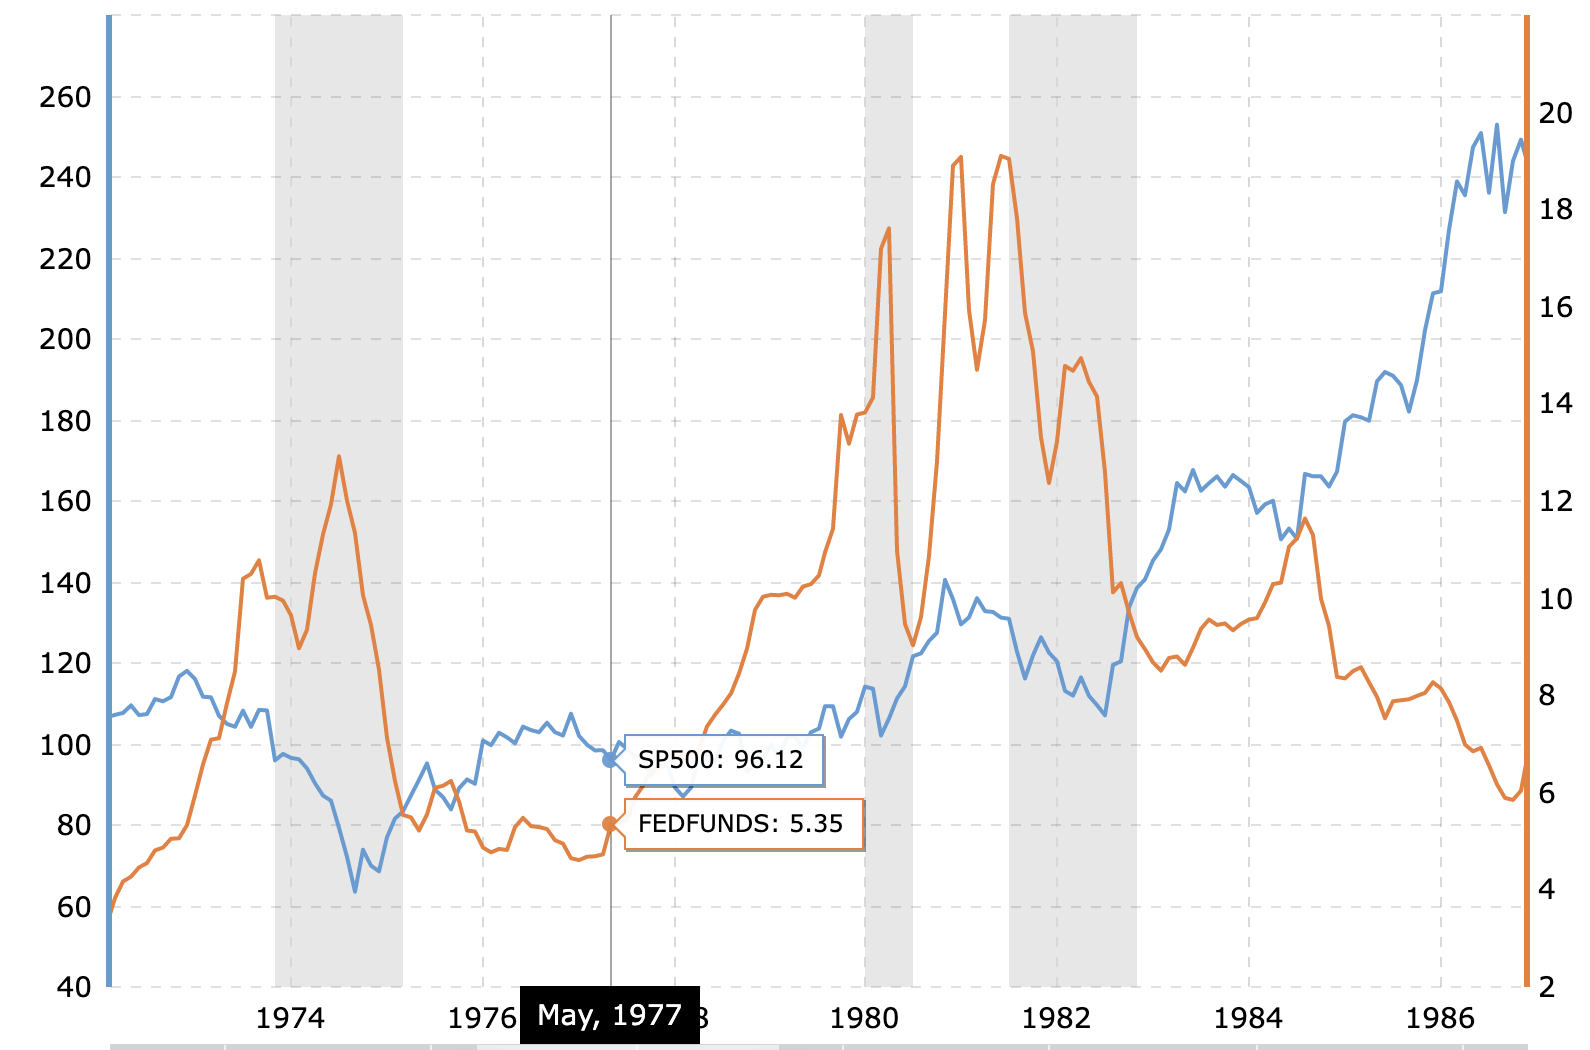
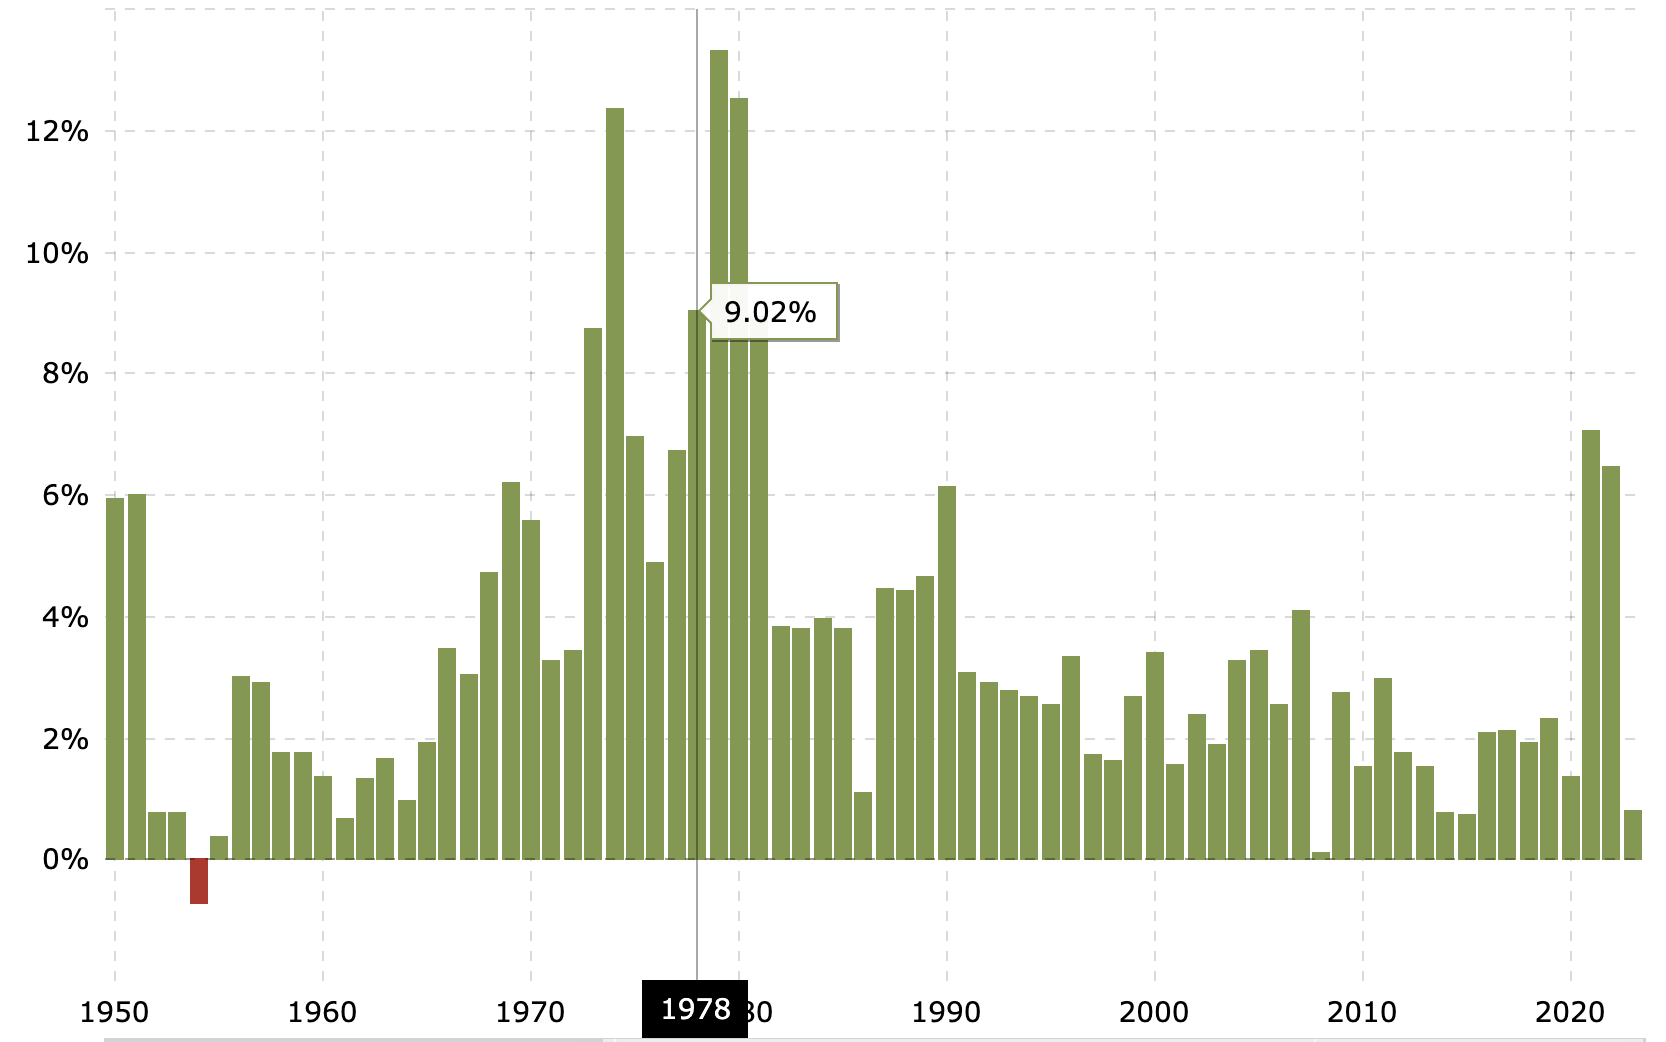
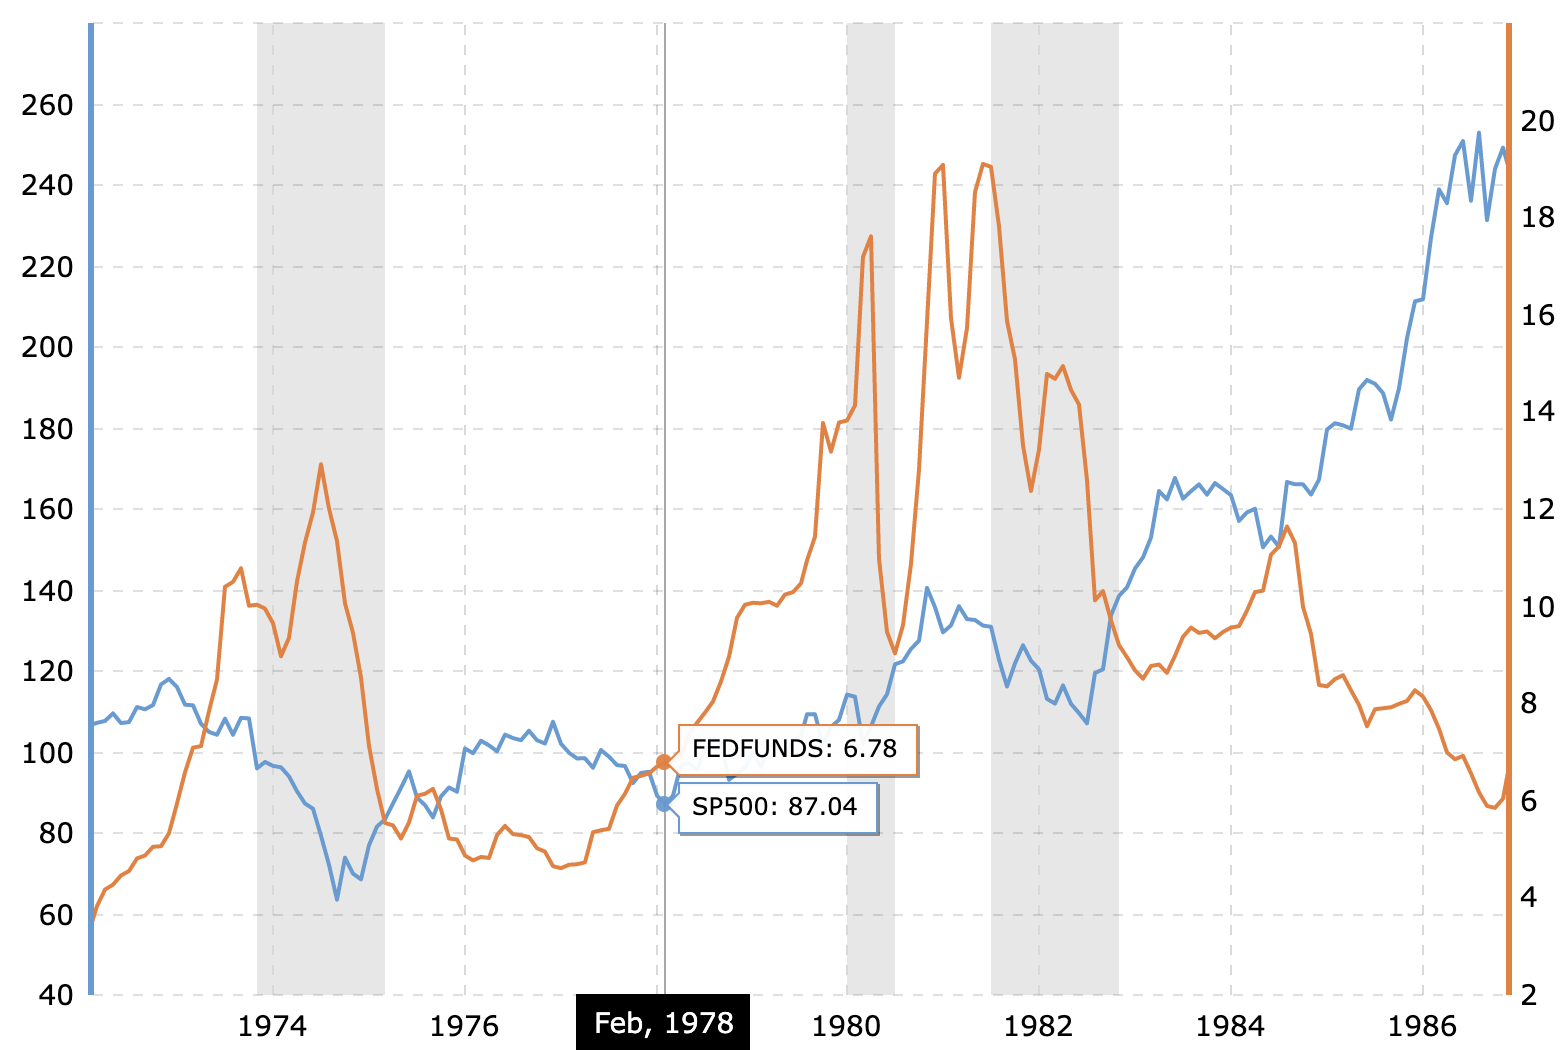
There are always outliers, like the mid-70s and early ’80s, but both periods were still eventually resolved with higher S&P 500 prices. Remember that there are usually two key reasons that the Fed is embarking on a hiking cycle 1) Economy is “too” strong. 2) Inflation is above the Fed’s target objective.
Given the two key reasons typically associated with rate hike cycles, many strategist and even Fed members, are highly cognitive and nostalgic when it comes to the present day rate hiking cycle, as it is one that is centered on fighting inflation akin to the mid-’70s and early ’80s. So here is where things get rather interesting, in my opinion.
I’m often perplexed by the table-pounding from the bears who remain of the opinion that a new low and/or another negative return year for the S&P 500 is afoot. It’s almost as if they believe the 28% decline (on intraday basis) and 25% drawdown on a closing basis happened… because. Don’t get me wrong, many have and continue to suggest the drawdown was to right size the valuation of the market with respect to higher rates, and in those moments last year I would have agreed, especially with the specter of high inflation and a Fed that does typically raise rates just high enough to find a recession. Here we are, yet, in a new calendar year and nearly 1-year since the first rate hike. A recession, however, does not seem any closer today than it had in Q4 of 2022. While some may not fancy that subjective analysis of the economy, here are two of many, many statistics that don’t lend favor to a near-term recession:
- As of September 2022, the U.S. economy was creating 400k+ jobs over a 6-month period. There’s never been a recession within 12 months, after an average of creating greater than even 300k. Historically speaking, a perfect 97–97. We’ve built up a great many jobs and with a near-record level low Unemployment rate.
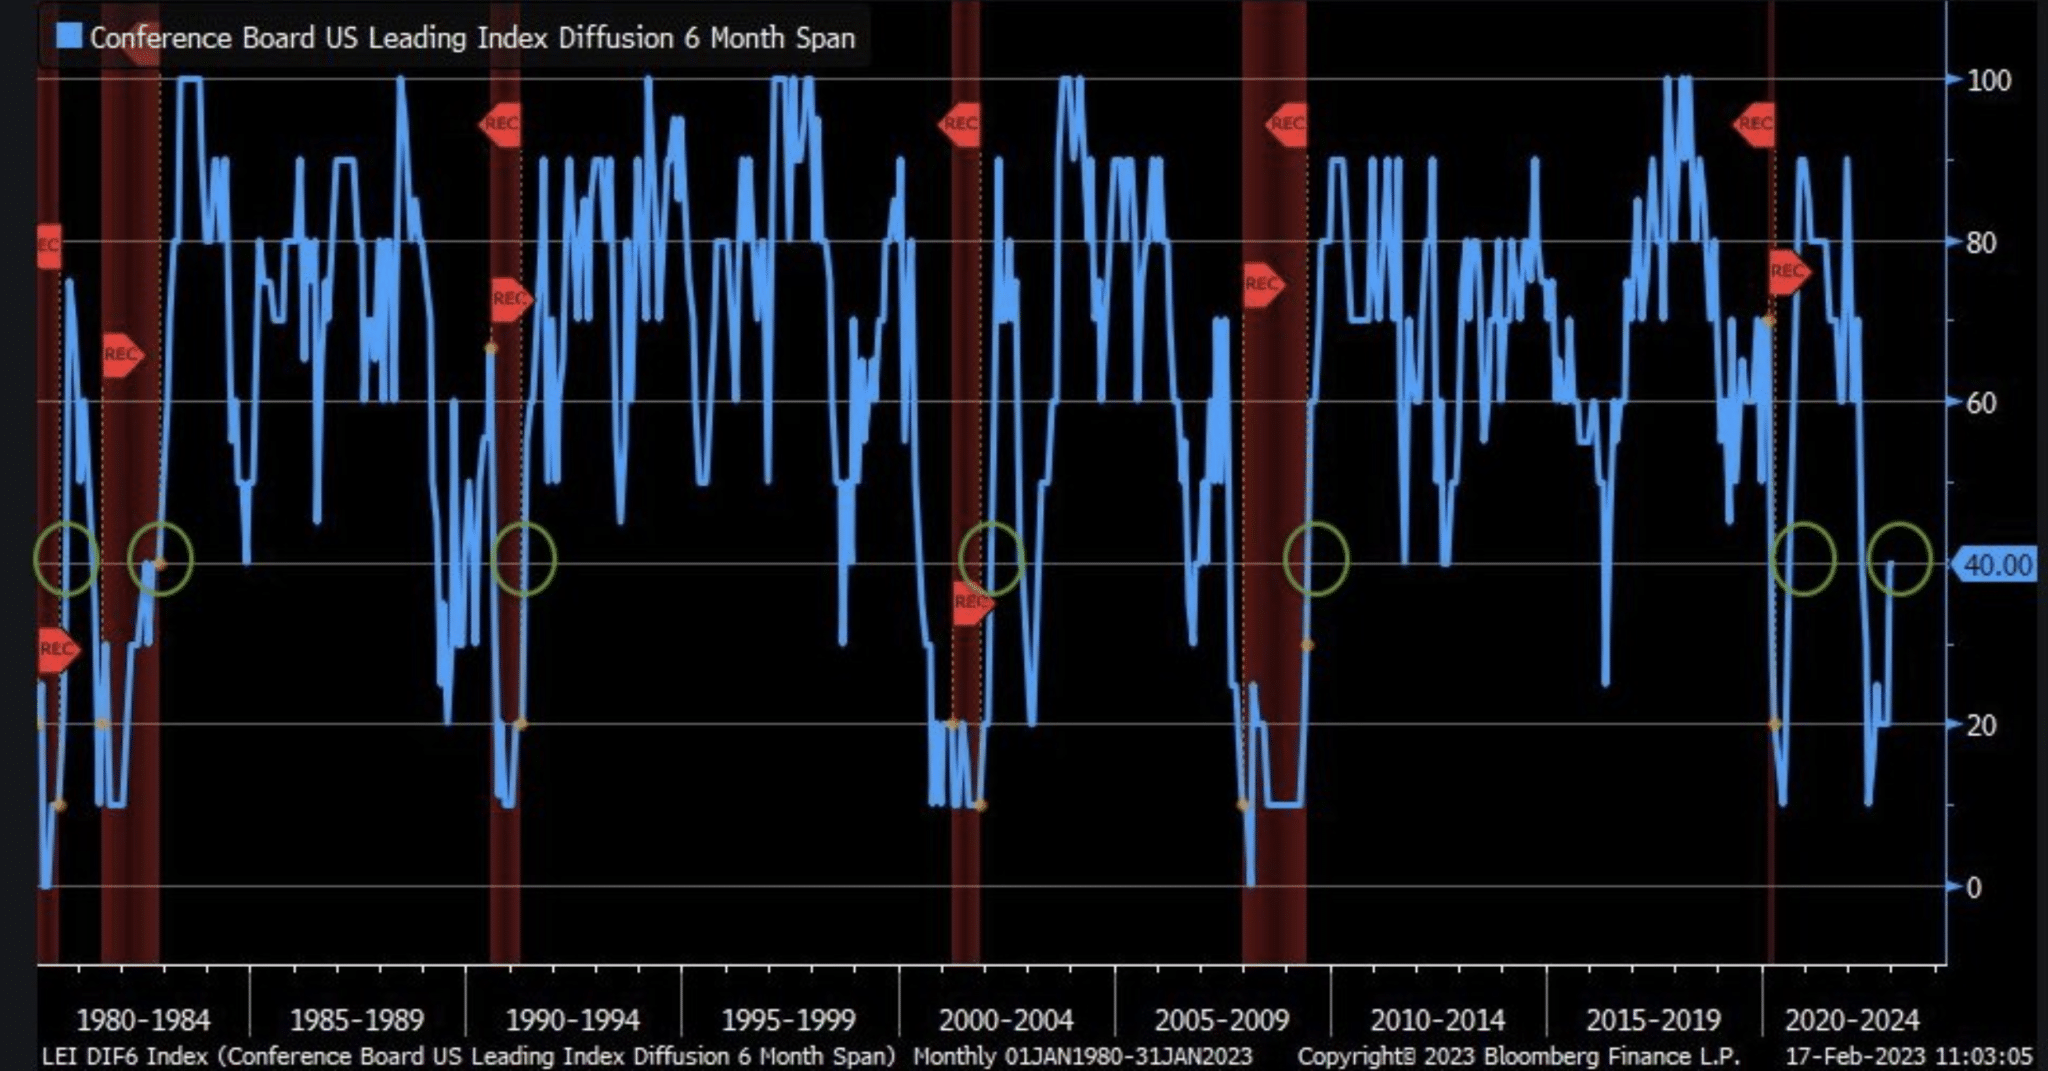
- In the past 40+ yrs, when the Conference Board’s LEI diffusion index drops under 20 and then rebounds to over 40, the recession risk has already passed (green circles)
- According to most data whereby the LEI was down 10 consecutive months. By Conference Board Leading Economic Indicators, the economy “should” have fallen into recession in the Q4 2022 period. In the past, when annualized 6-month rate-of-change in LEI sank to < than -5%, the longest gap until a recession was 4 months.
- In this cycle February is month 6.
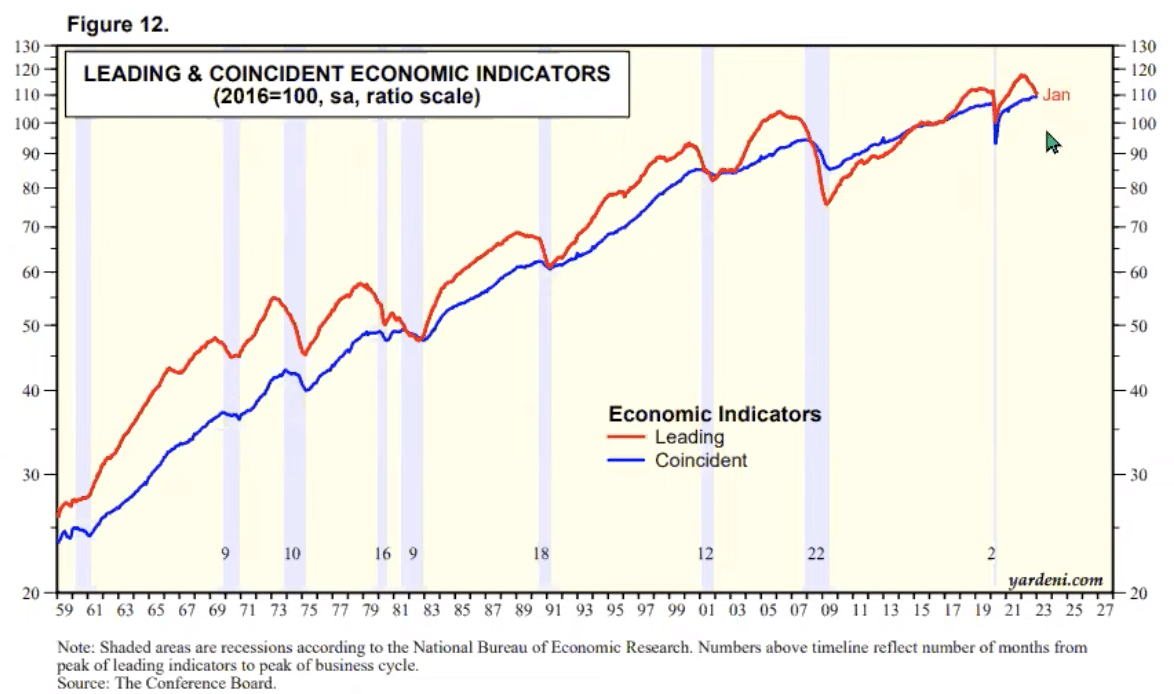
- Terribly difficult to find the National Bureau of Economic Research labeling a recession taking place when Coincident Economic Index is at an all-time high, despite the Leading Economic Index itself having declined for 10 consecutive months.
- Unprecedented times we are living through as investors.
Here’s something I found humorous last year. There was concern that the Fed was hiking rates into a seemingly overvalued stock market. When we look at the Bank of America table below, however, something should jump out at investors. The average P/E multiple when the Fed is hiking has been 15.8X, going back to 1971.
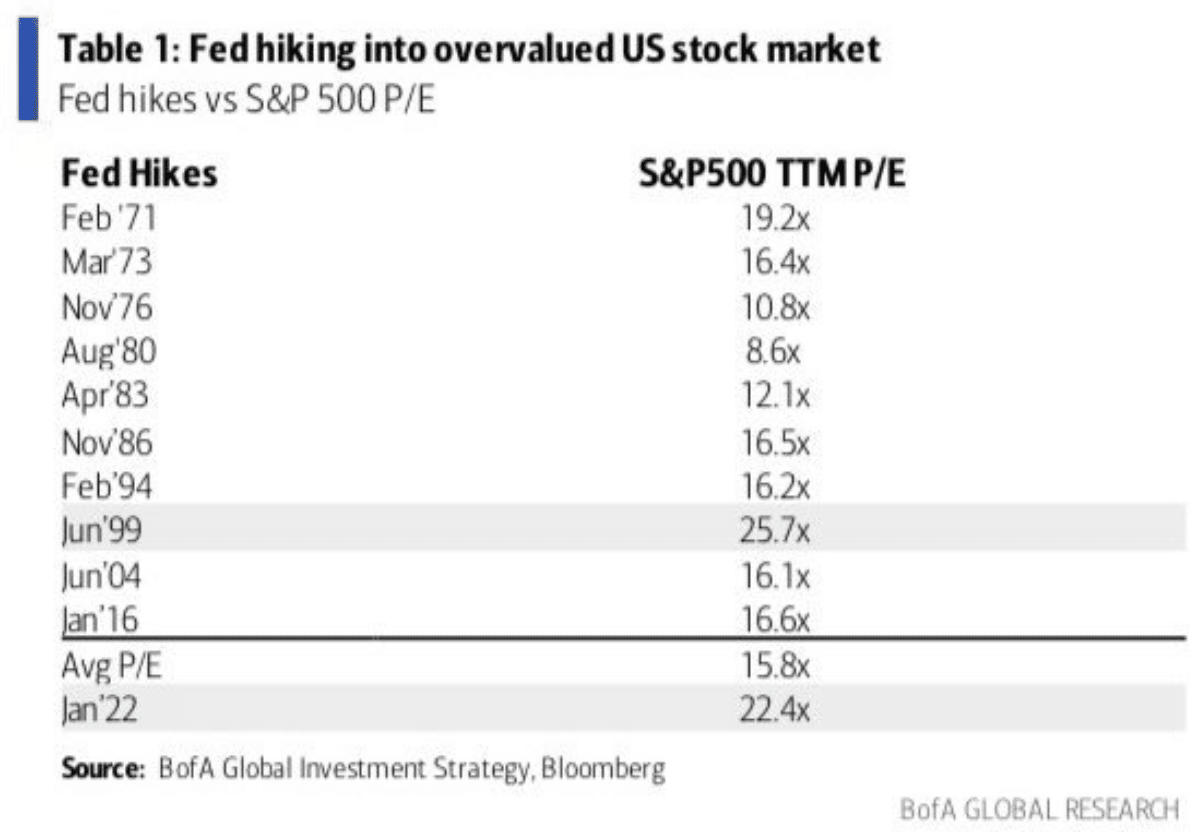
BIG PICTURE: That is generally the case. Most of the associated examples have a P/E above the average, based on Bank of America’s own data. How highly valued is simply relative and hyperbolic fodder. Nonetheless, Fed hiking into highly valued markets IS THE NORM! In most of the cases shown, if this issue of valuation was a concern, it would have kept you from seeing markets move higher in the majority of the examples.
So here is what I really want to talk about, or possibly debunk… Again, while most would have held the opinion that higher rates, higher inflation would define the 2022 bear market, it’s unlikely to define the path forward or for 2023 as a whole. First, rarely are there back-to-back down years in the market. The last such occurrence was 2000-2002, and before that 1973-1974. Keeping in mind that we can mostly agree on the rationale for last year’s decline, we can also suggest or pile on to the theory that markets are a forward discounting mechanism, and largely what they are discounting are two key ingredients: 1) Earnings Per Share (EPS) 2) Inflation.
It’s often a widely accepted rationale; the market discounts future earnings. What is not widely accepted, and more frequently overlooked, is that the market is actually more response to the trend of inflation than most ANY OTHER variable. If we only consider that EPS rose in 2018 and 2022, yet the market was down in both years, well then we have to consider that both of these years were discounting the likelihood of an EPS decline/slowdown in 2019/2023 OR the years that followed. That was, in fact, realized in 2019 and we’ll find out if that is the case here in 2023. Moreover, what this exercise renders more clearly is that the market has already accounted for 2023 EPS by way of the 2022 bear market, if not in part, and of course if accurately.
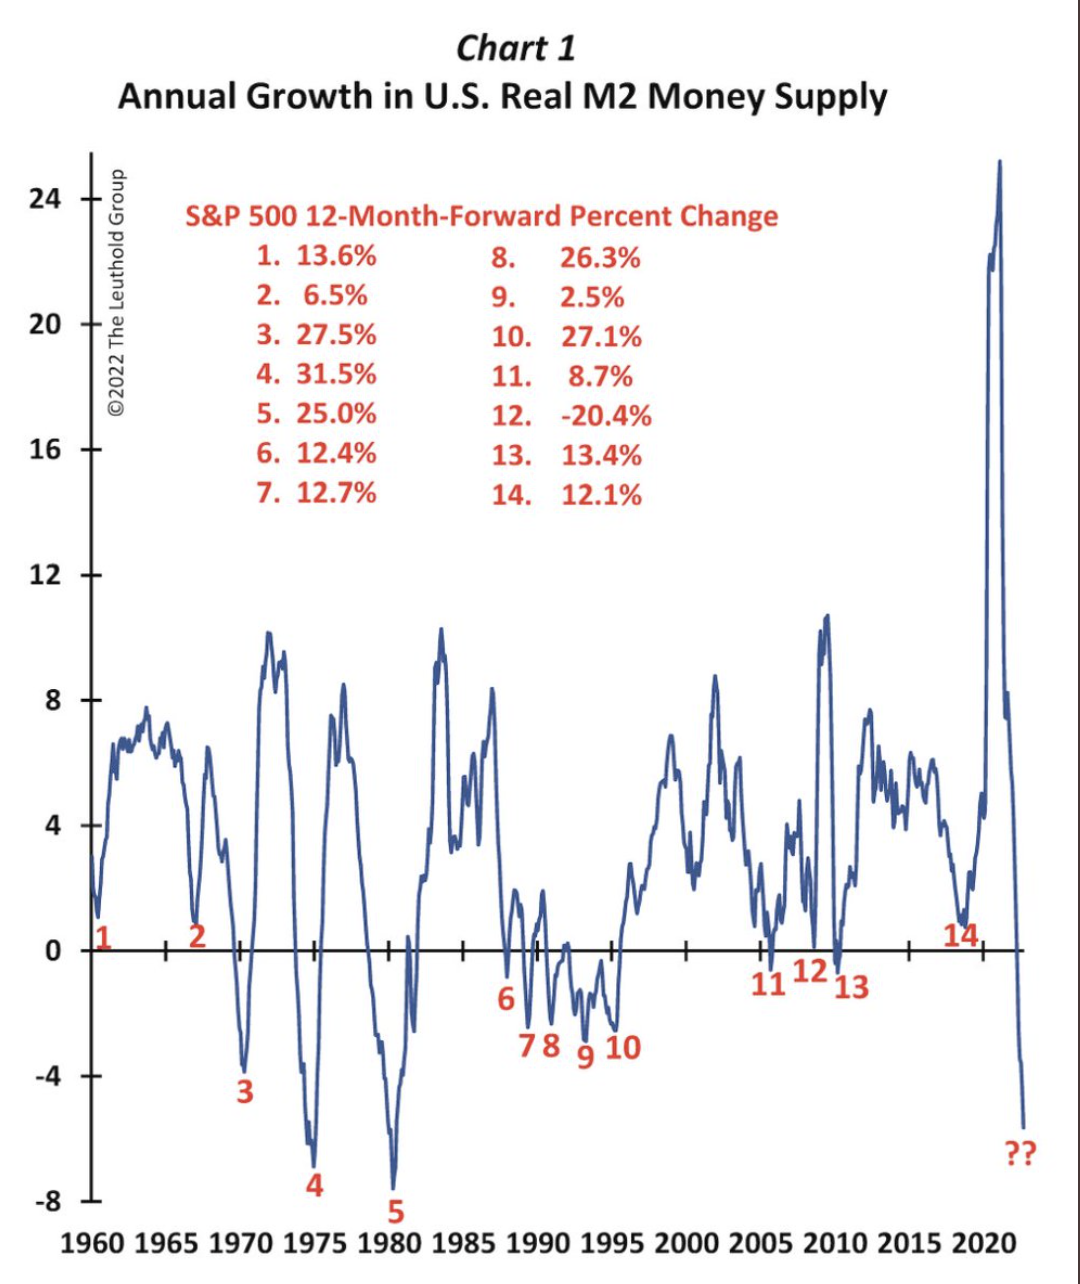
The chart below, from the Leuthold Group, goes a long way toward outlining the aforementioned concept of forward discounting markets.
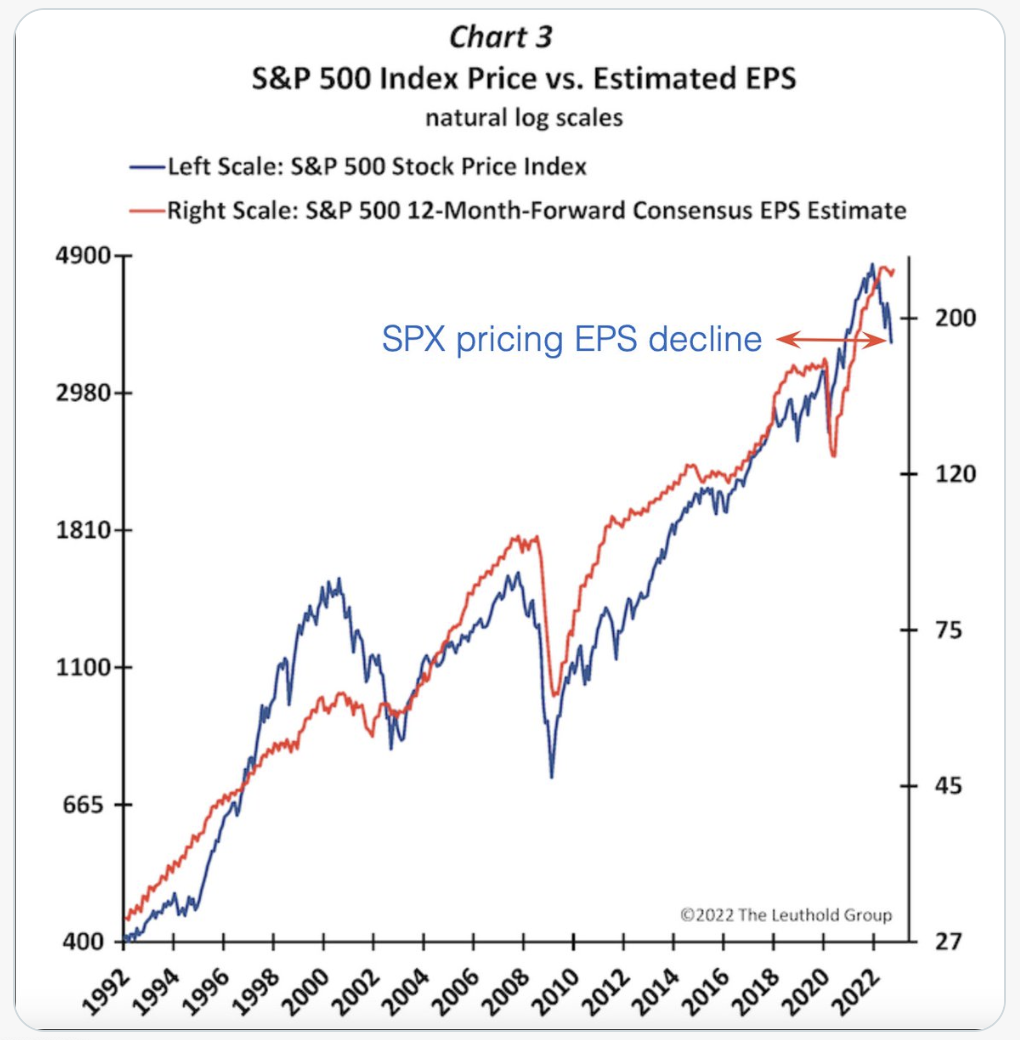
“…the market has already accounted for 2023 EPS by way of the 2022 bear market, if not in part.” I reiterated the “in part”, because while this does example nicely and appear logical, here is what we know about the annual S&P 500 performance when earnings are positive or negative. Warning, this may irritate some fo the bears who have fallen in love with the “earnings down, markets down” narrative. Simply put, that is not how it works.
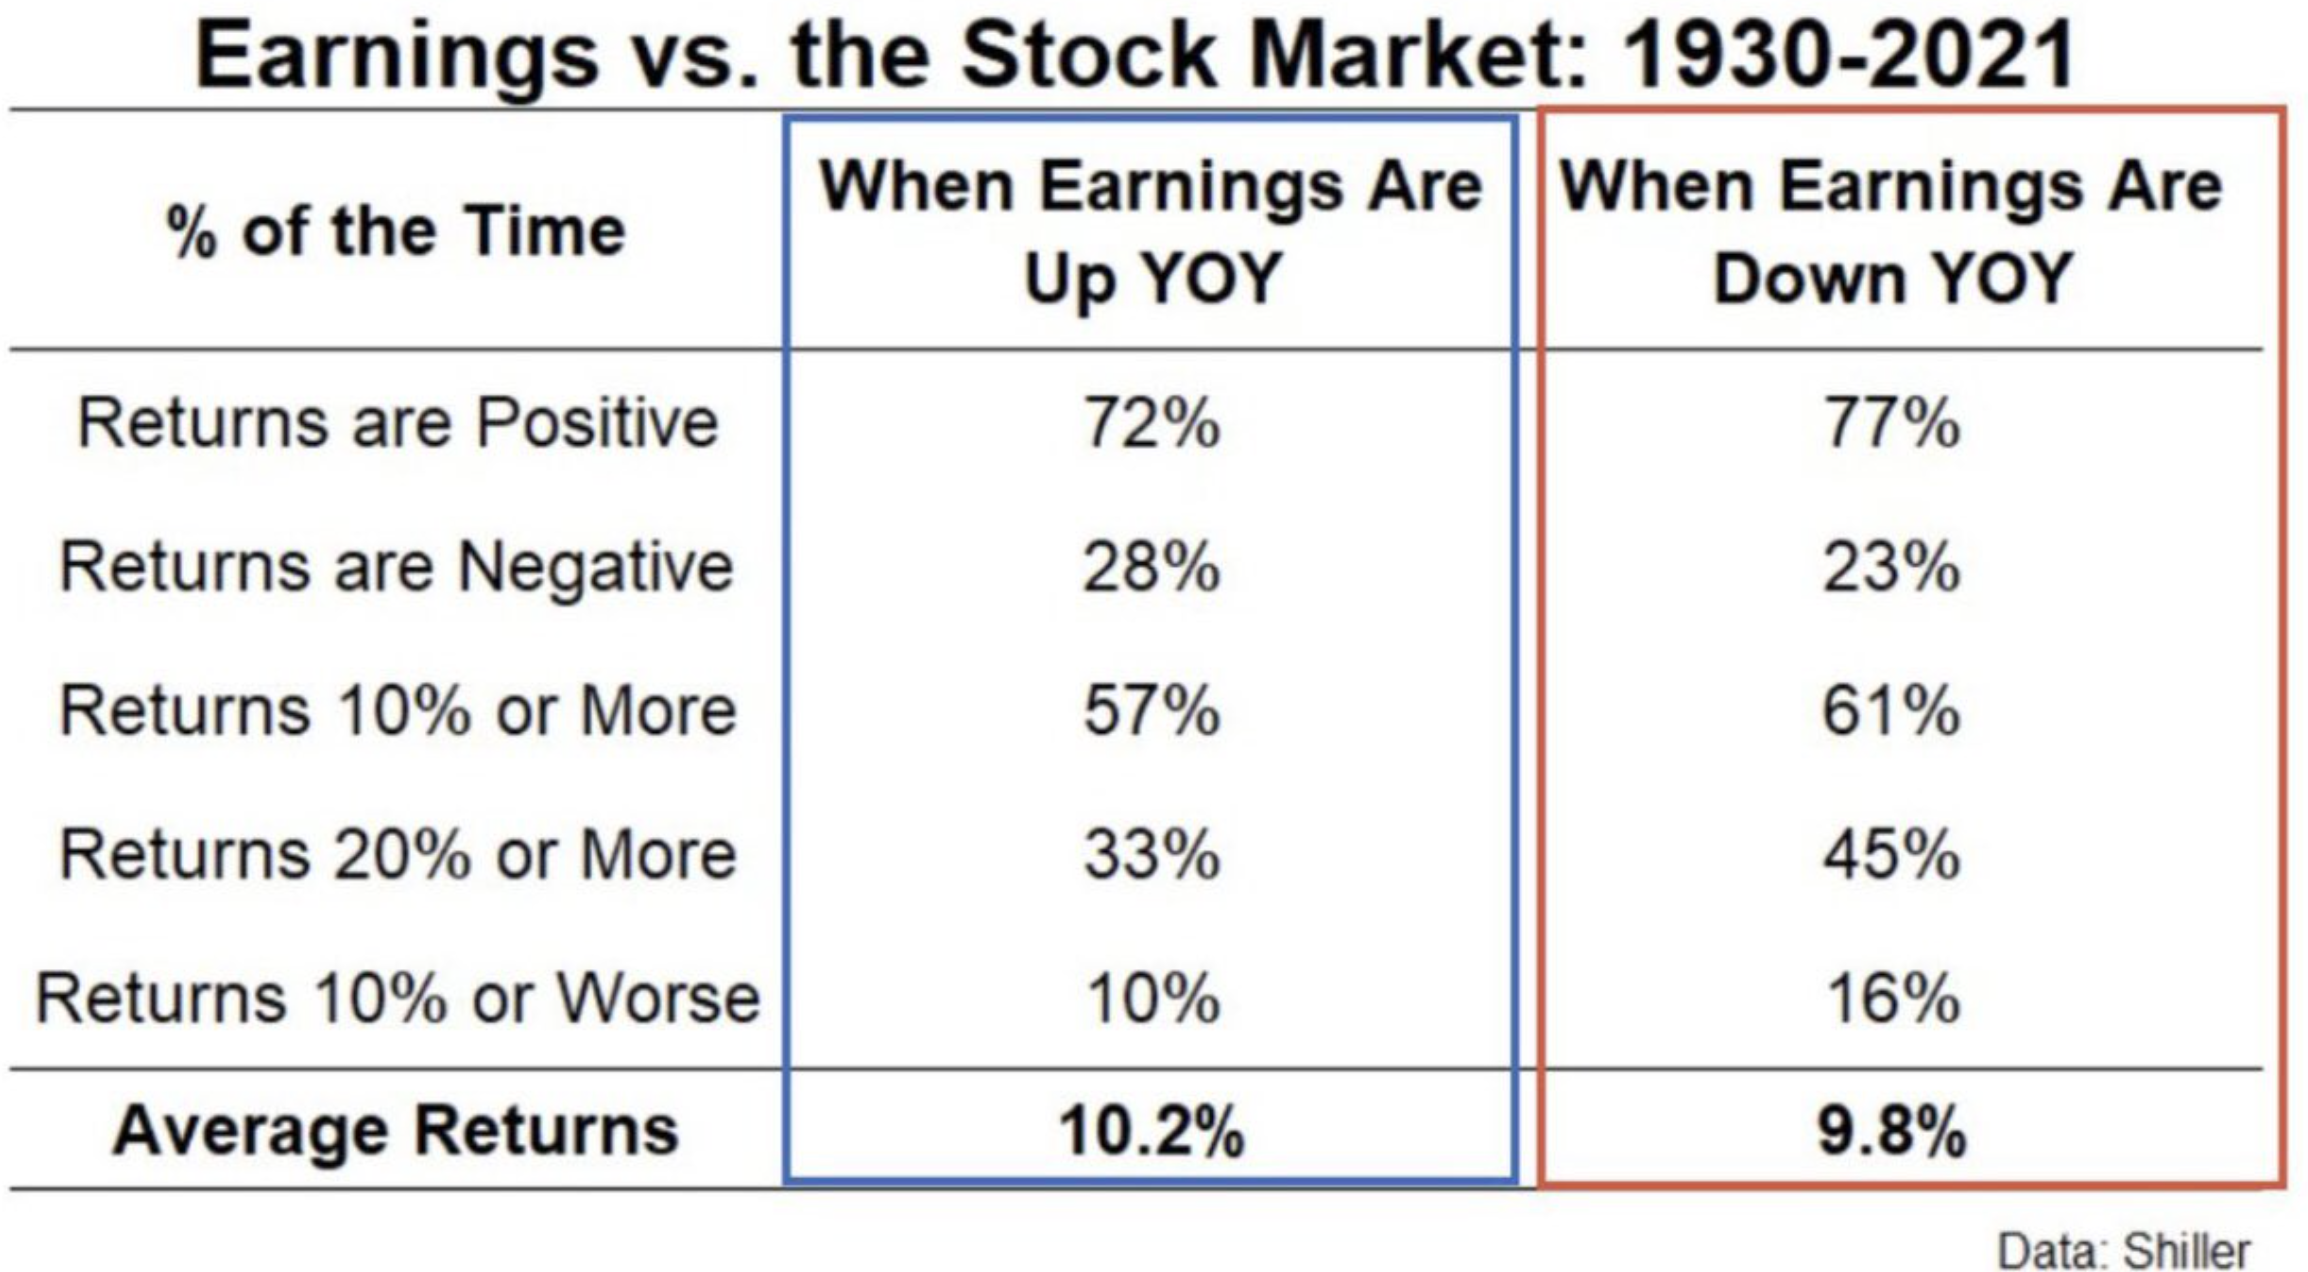
As shown in the table above, when EPS is DOWN Y/Y, the market has been higher 77% of those years, since 1930. In 2019, EPS was flat to lower by -1%, depending on GAAP and Non-GAAP earnings. Even so, the S&P 500 delivered a 31% total return for the calendar year. This is just one of the majority of examples when down EPS equals ⬆️ S&P 500 for the year.
One of the biggest ⬇️ years for the market in history was 1974. You guessed it; EPS was sharply higher Y/Y in 1974. The market recovery began in 1975 and you guessed it again, EPS was ⬇️ that year while the S&P 500 delivered another double-digit, positive return. Just as 1974 was forward discounting negative EPS for 1975, with a negative return, 1975 was discounting a resurgence in EPS for 1976, with a positive return.
It should come as no surprise that EPS expectations amongst strategists are all over the map for 2023, just like their 2023 price targets for the S&P 500. The current consensus estimate for FY2023 EPS stands at ~$223/share, per Yardeni Research. This is a relatively flat Y/Y EPS estimate, which doesn’t seem all that bad considering analysts were very late in reducing 2023 estimates, and may prove late if they need to adjust them in the future, up or down. History, nonetheless, suggests that outside of a recession an EPS decline/slowdowns have already been priced via the bear market of 2022. Maybe this is what Morgan Stanley’s chief equity strategist Mike Wilson is failing to acknowledge via the chart below:
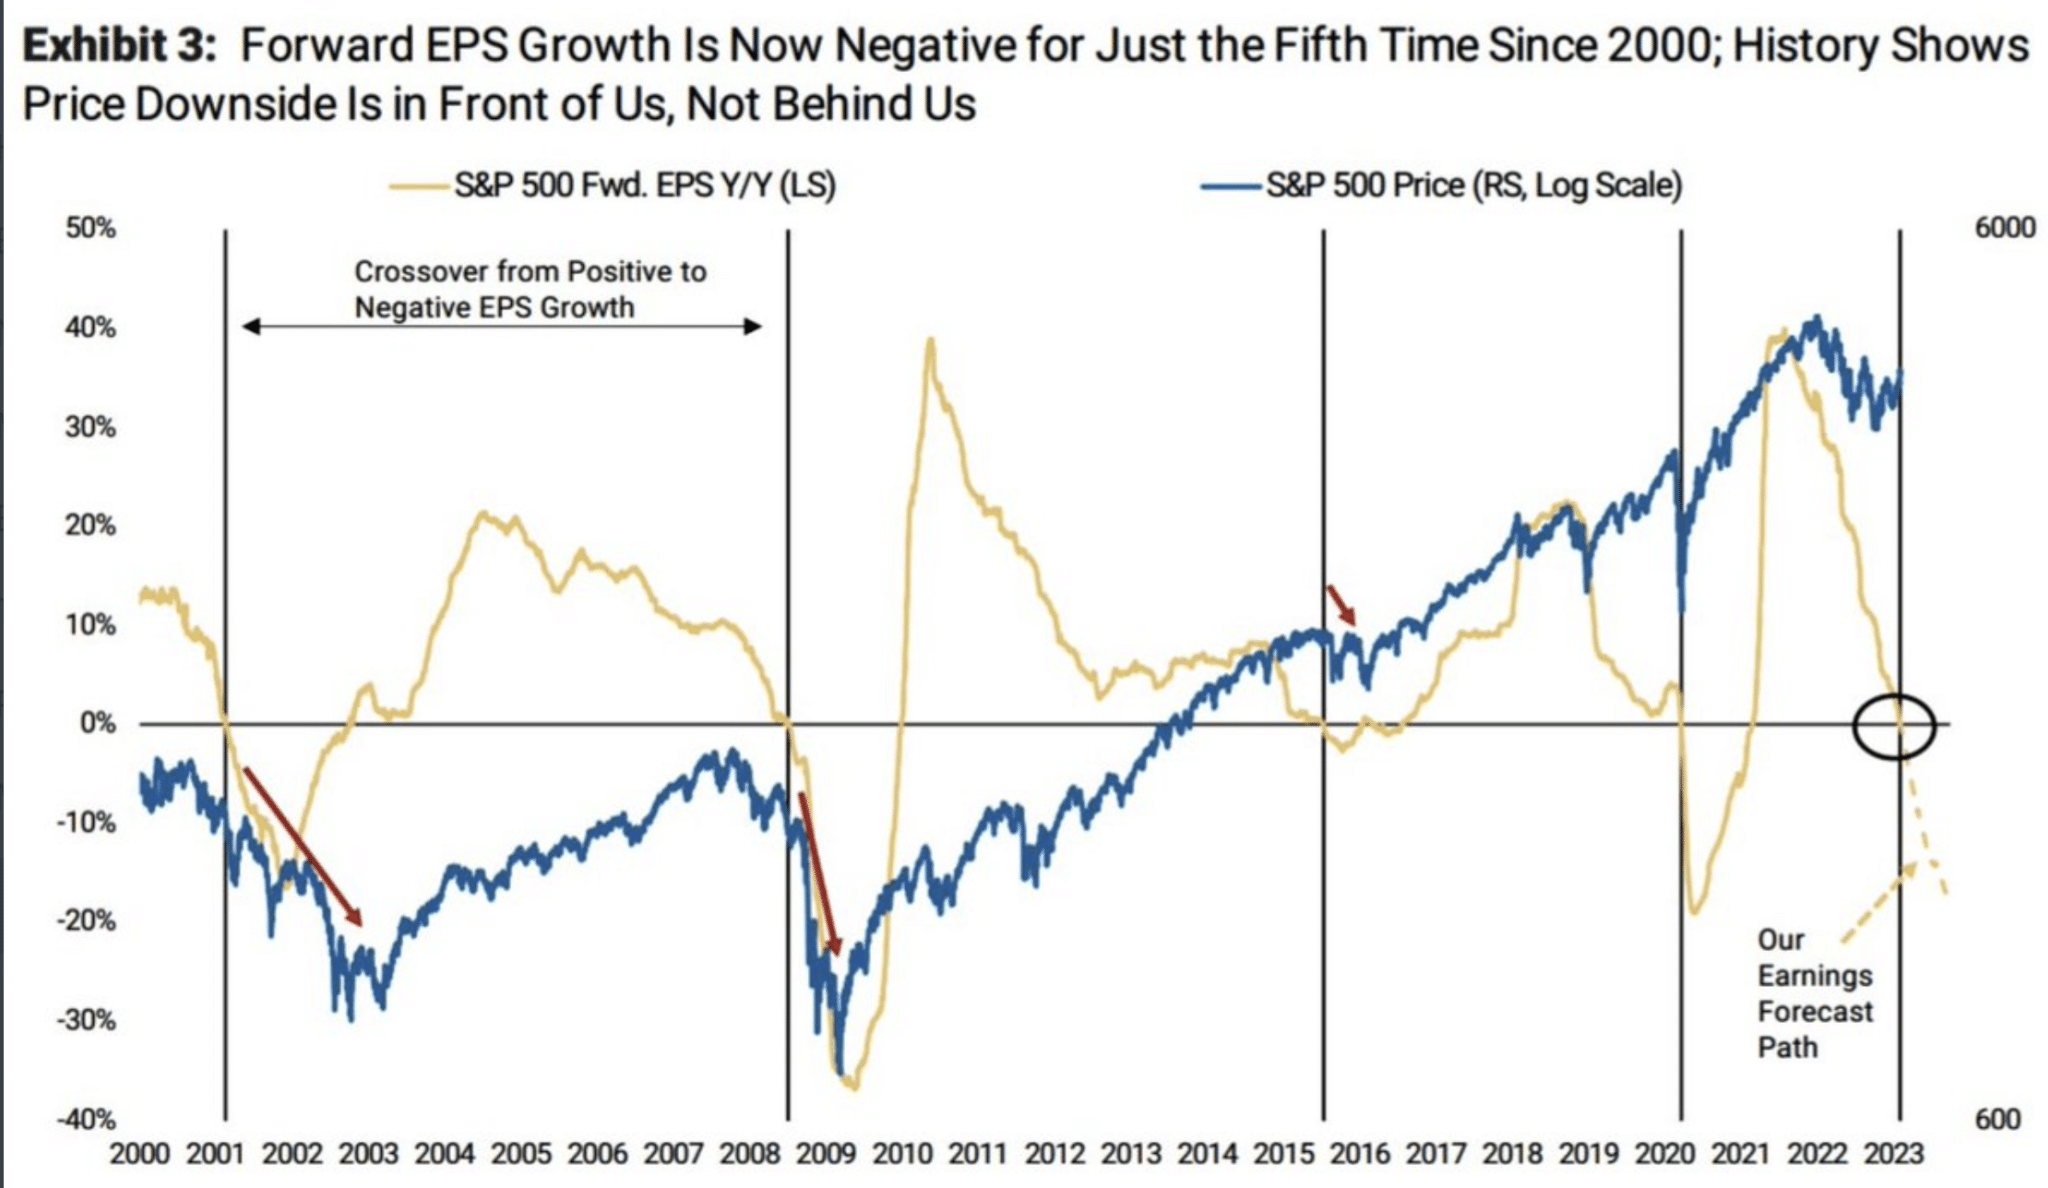
Mike Wilson: “Only the 5th time since 2000 that forward EPS is set to decline. Each previous occurrence there was downside in S&P500.”
There’s only one issue here! In NONE of the prior occurrences did the S&P 500 fall 25%+ prior to the forward EPS declining Y/Y, like it did already in 2022. Another example of forward-discounting at work, yet for some reason a top Wall Street strategist cares not for this factually evidenced, historic understanding.
With the EPS outlook in mind, many strategists/analysts/investors are also concerned that while the S&P 500 may not decline much for the year and by year-end, it won’t achieve much in the way of multiple expansion to drive significant upside. The argument usually centers on a misnomer that valuations are already too high or didn’t find a typical bear market trough of 14-15X forward EPS. If we know that an EPS decline/slowdown and derating cycle was priced in 2022, due in part to higher rates, then we also recognize it would prove logical to use a P/E derating exercise and not an average P/E bear market trough. This is especially true because P/E’s tend to expand over time, ex-DOTCOM, and no Fed rate hike cycle began at the same annual P/E multiple.
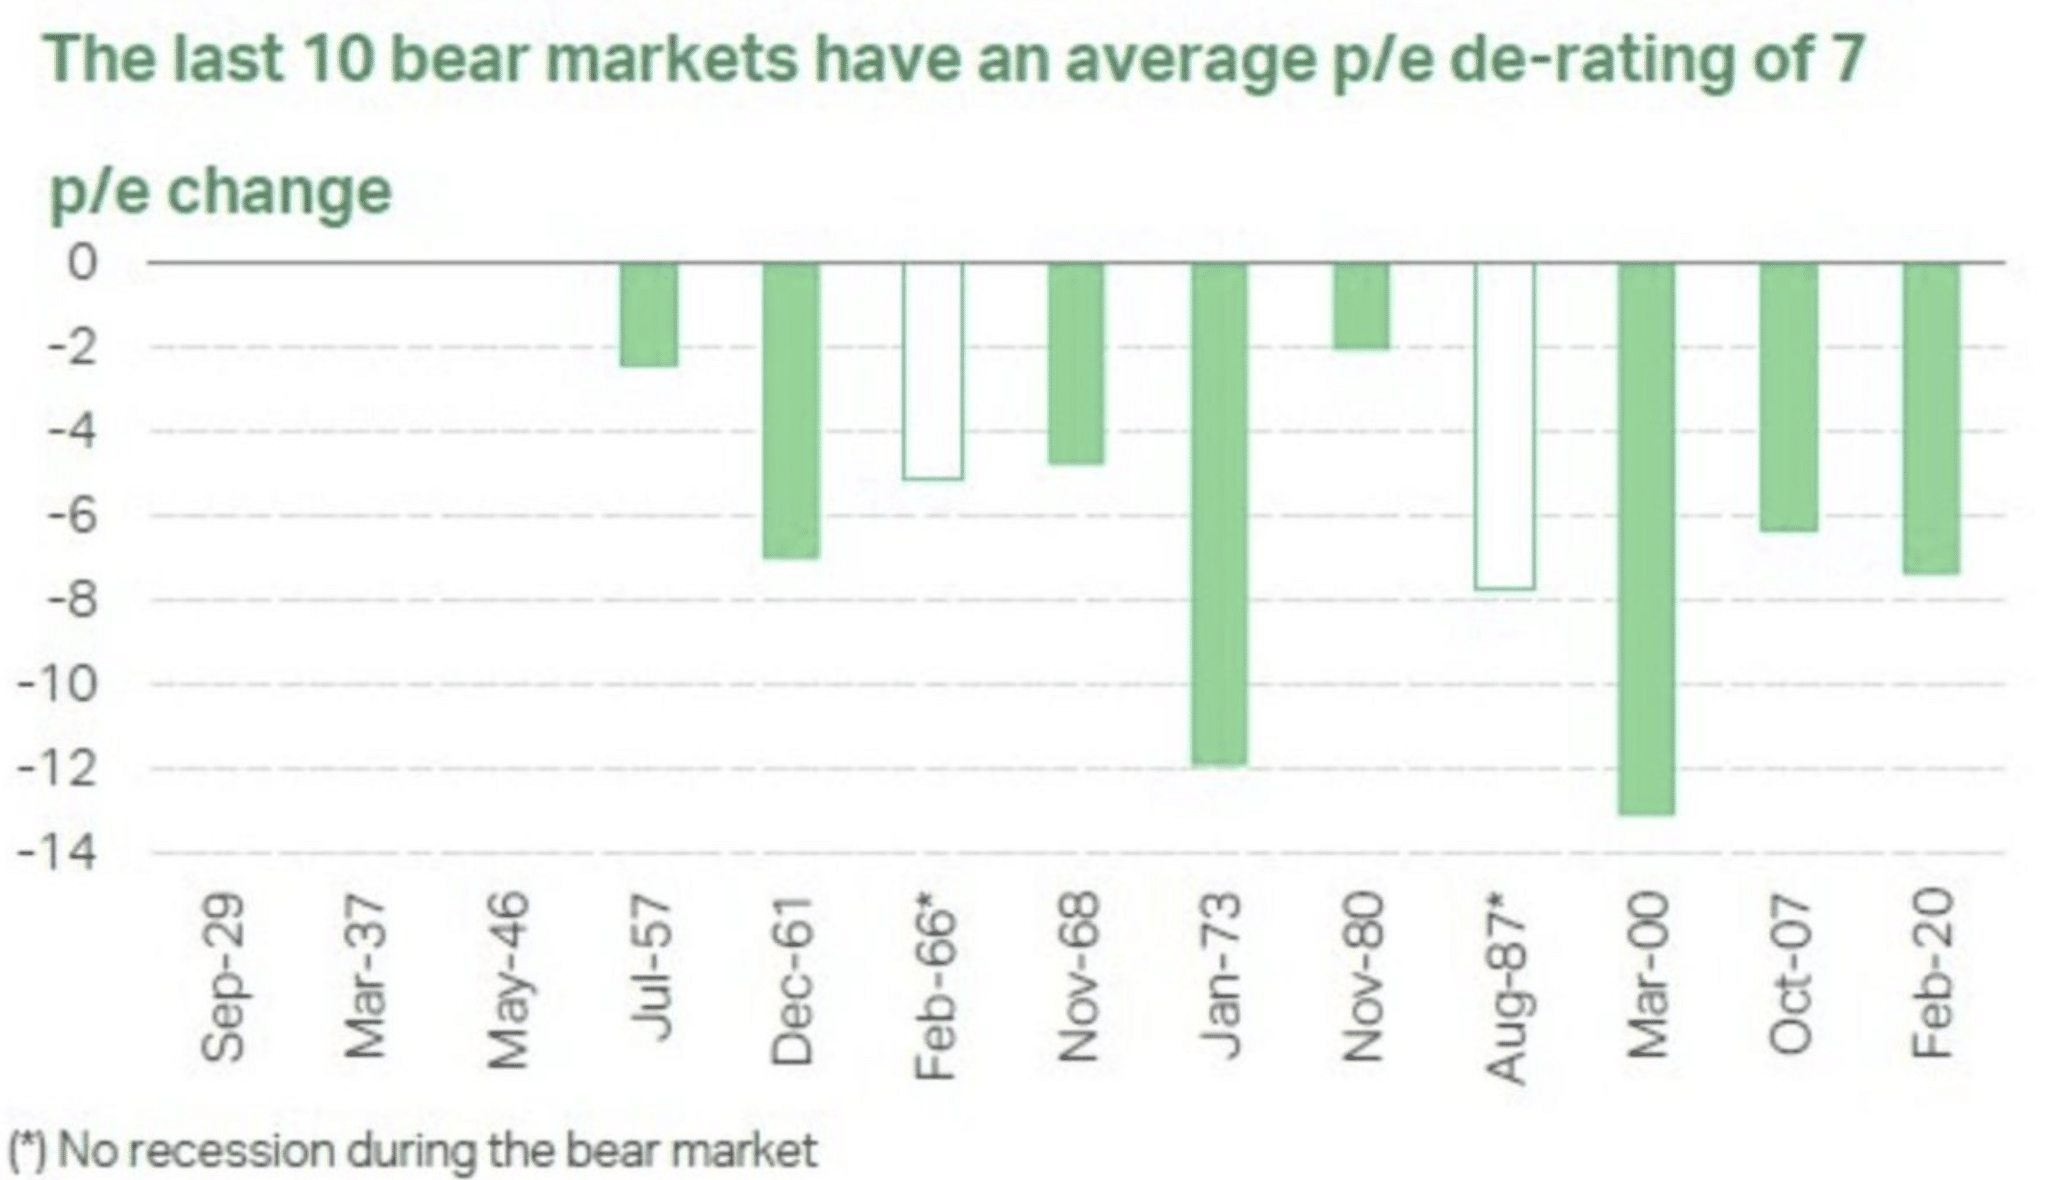
According to the J.P. Morgan data above, the Median P/E derating since 1957 is 7 multiple points. In 2022, the S&P 500 began the year with a 22X multiple, and it derated down to 15.6X at its lows or nearly 7 multiple points. You can pick-nits all you want, but sounds like 2022 has accommodated for both an EPS decline/slowdown and a derating cycle that was predicated on higher rates.
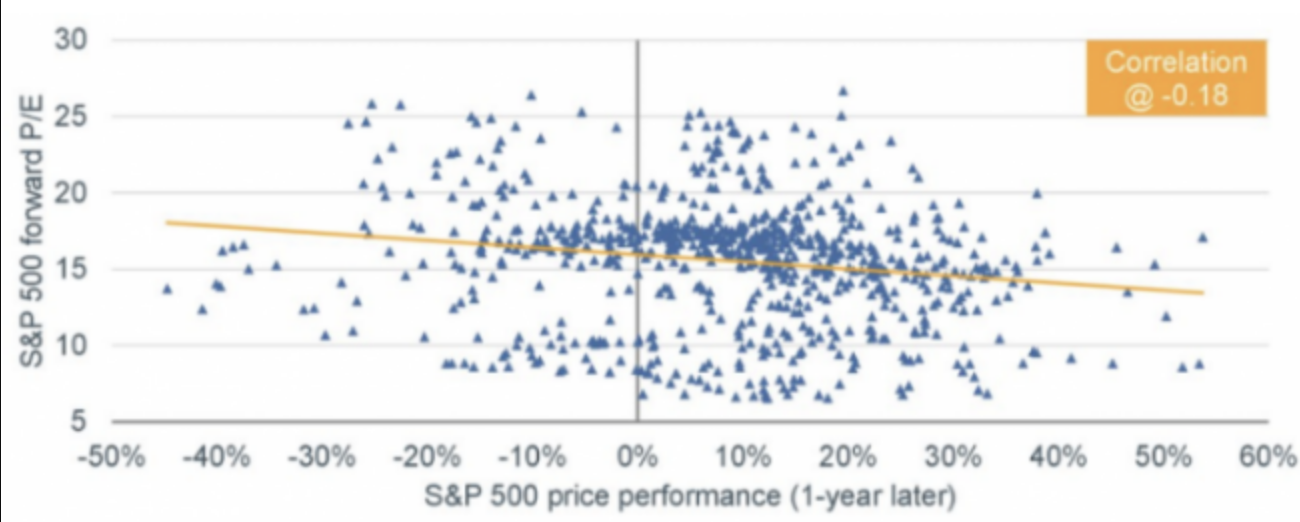
Moreover, it has rarely proven a good idea to fear value due to the possibility of even greater market declines/value showing up in the near future. As we have turned a new calendar year, I would remind investors that there is NO CORRELATION between the S&P 500 P/E multiple and forward 12-month returns, NONE!
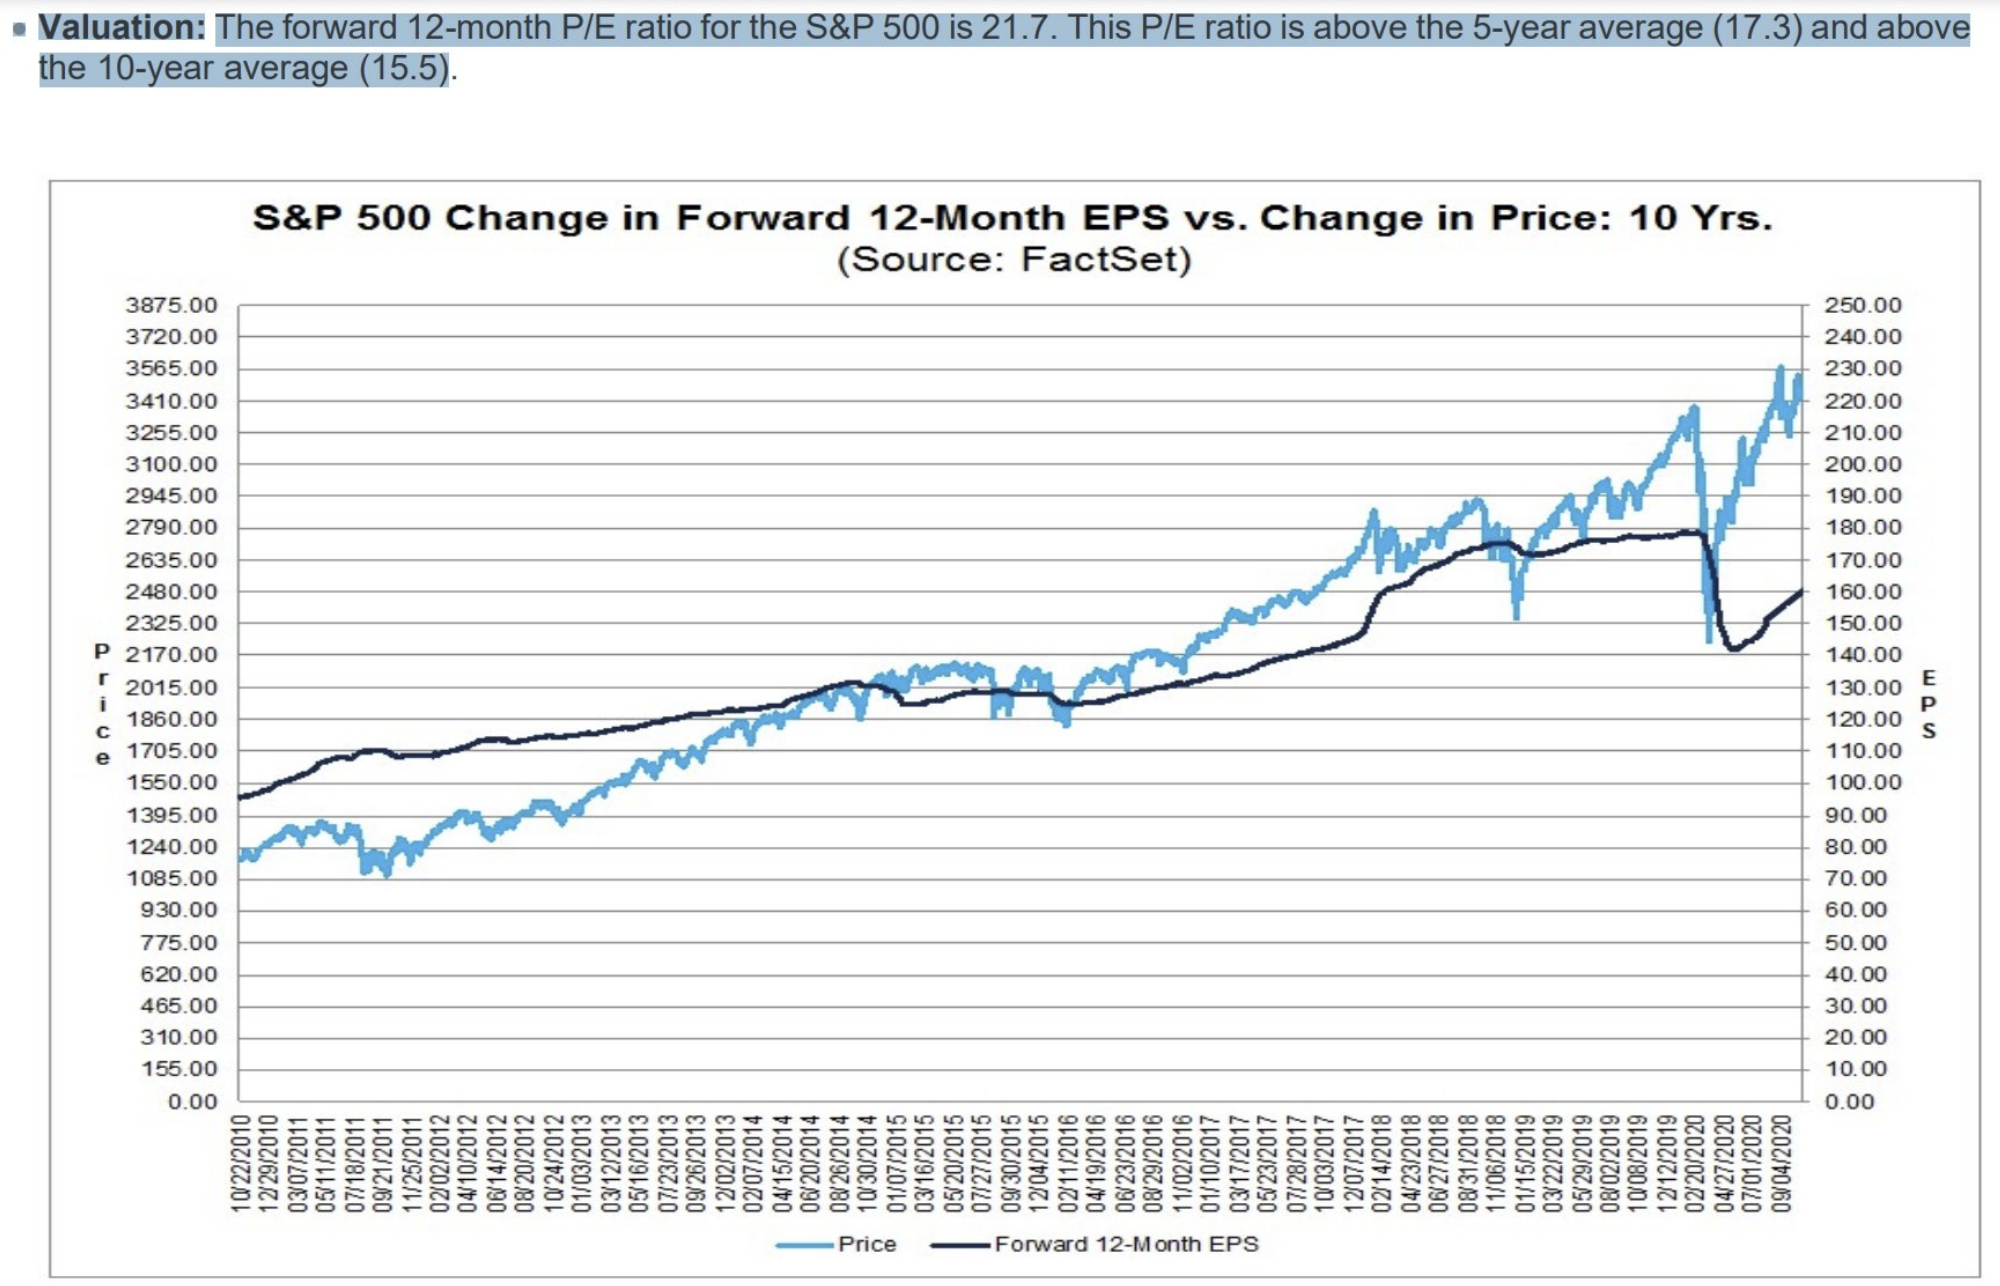
And if you are feeling nostalgic, here is another healthy reminder of how market troughs happen, and the subsequent valuation sentiment deters would-be investors from buying value when it has been presented, even at what is deemed rich valuations. Back in 2020, during the pandemic period, the market trough in late Q1 2020. Earnings estimates fell sharply. The market, nonetheless, climbed through the remainder of 2020, with the richest valuation since 2000, and while the global economy was in lockdown-mode. The following screenshot and highlight was taken from the Q3 earnings period, whereby the S&P 500 was already carrying a 21.7X multiple.
- The market is so friggin’ expensive, right?
- Said everyone in Q3 2020 when the global economy was still in lockdown, and every day thereafter.
- Chart above details the Q3 2020 P/E Multiple which was higher then, than it is today at 18X.
- This is how it works, this is how it always works?
Argument: “But the Fed dropped rates to zero and was doing Quantitative Easing.” Absolutely true, and yet very few were able to accept this and elevate its benefits over the threat of a pandemic, daily death counts rising, and still yet no vaccine. We make excuses for the market finding favor after the fact, however, many failed to engage the bullish trend in real-time, given valuation concerns.
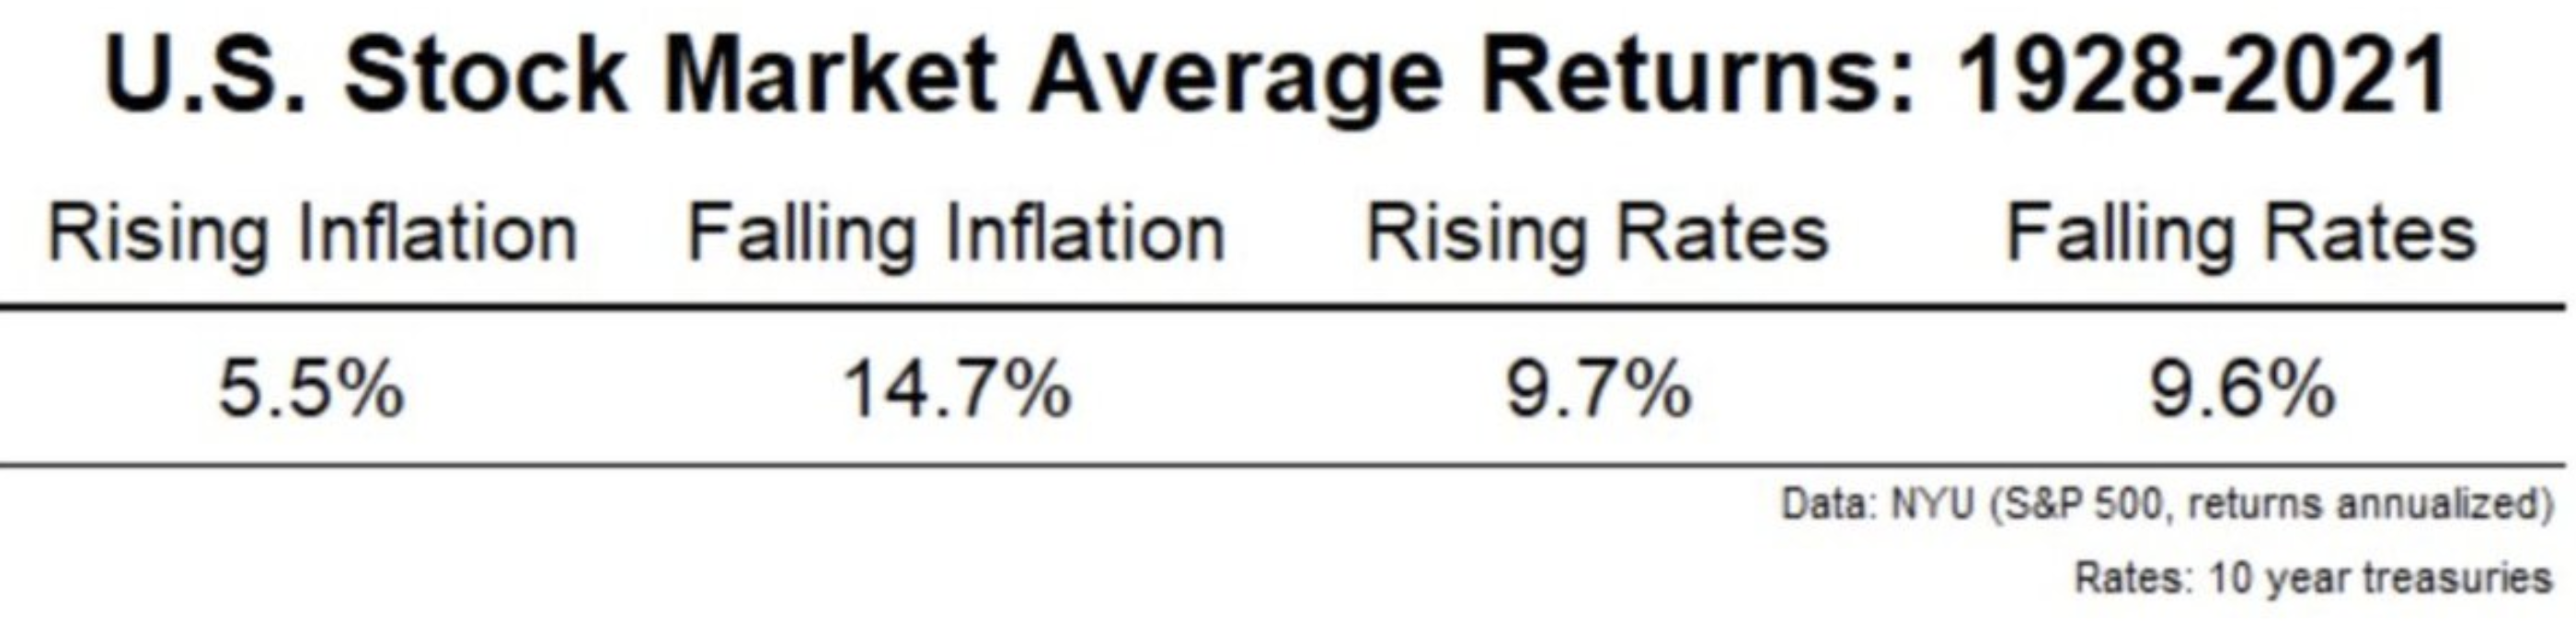
The following table is why I don’t make a lot of friends. Much of what we hear promoted in the financial and social media is pure bunk. As already recognized, the stock market tends to rise as rates rise, largely because the economy is strengthening to a point that the Fed fears overheating, and attempts to curb the economic pace with rate hikes. This usually does not impact corporate profits, at least in the interim.
Portfolio Manager: “Come in and have a seat Mr. and Mrs. Smith. The main reason we didn’t engage the bear market this cycle is a belief that we’re not out of the woods yet, and greater value lay ahead.Mr. and Mrs, Smith: “That sounds reasonable; so we should see some positioning and investments commensurate with your fees in the near future? Glad you are being cautious and prudent, but we would like to see activity associated with the fees.”Portfolio Manager: “Absolutely, I’ve been doing this for 20 years and we’ll have strong value to consider leveraging capital soon.”