
With over 40 years of combined investing experience, Finom Group founders have never seen the existing macro-market conditions. The post-pandemic period has given way to a rapidly evolving outlook for both the economy and markets, with analysts, strategists, and investors forced to maintain a hightened degree of alert, flexibility, and open-mindedness unlike levels from cycles of the past. We all have models, but the utility of those models is being tested by some of the highly unique and unprecedented conditions of the day. From supply line constraints that are rapidly normalizing and through the highest inflation regime in 40+ years that coincides with the fastest rate hike regime in 40+ years, market participants are hoping for more normalization and the ability to maintain disciplines. Whether or not success will be found for market participants going forward will likely depend on discipline! With that said, let’s get into some macr0-market details, shall we?
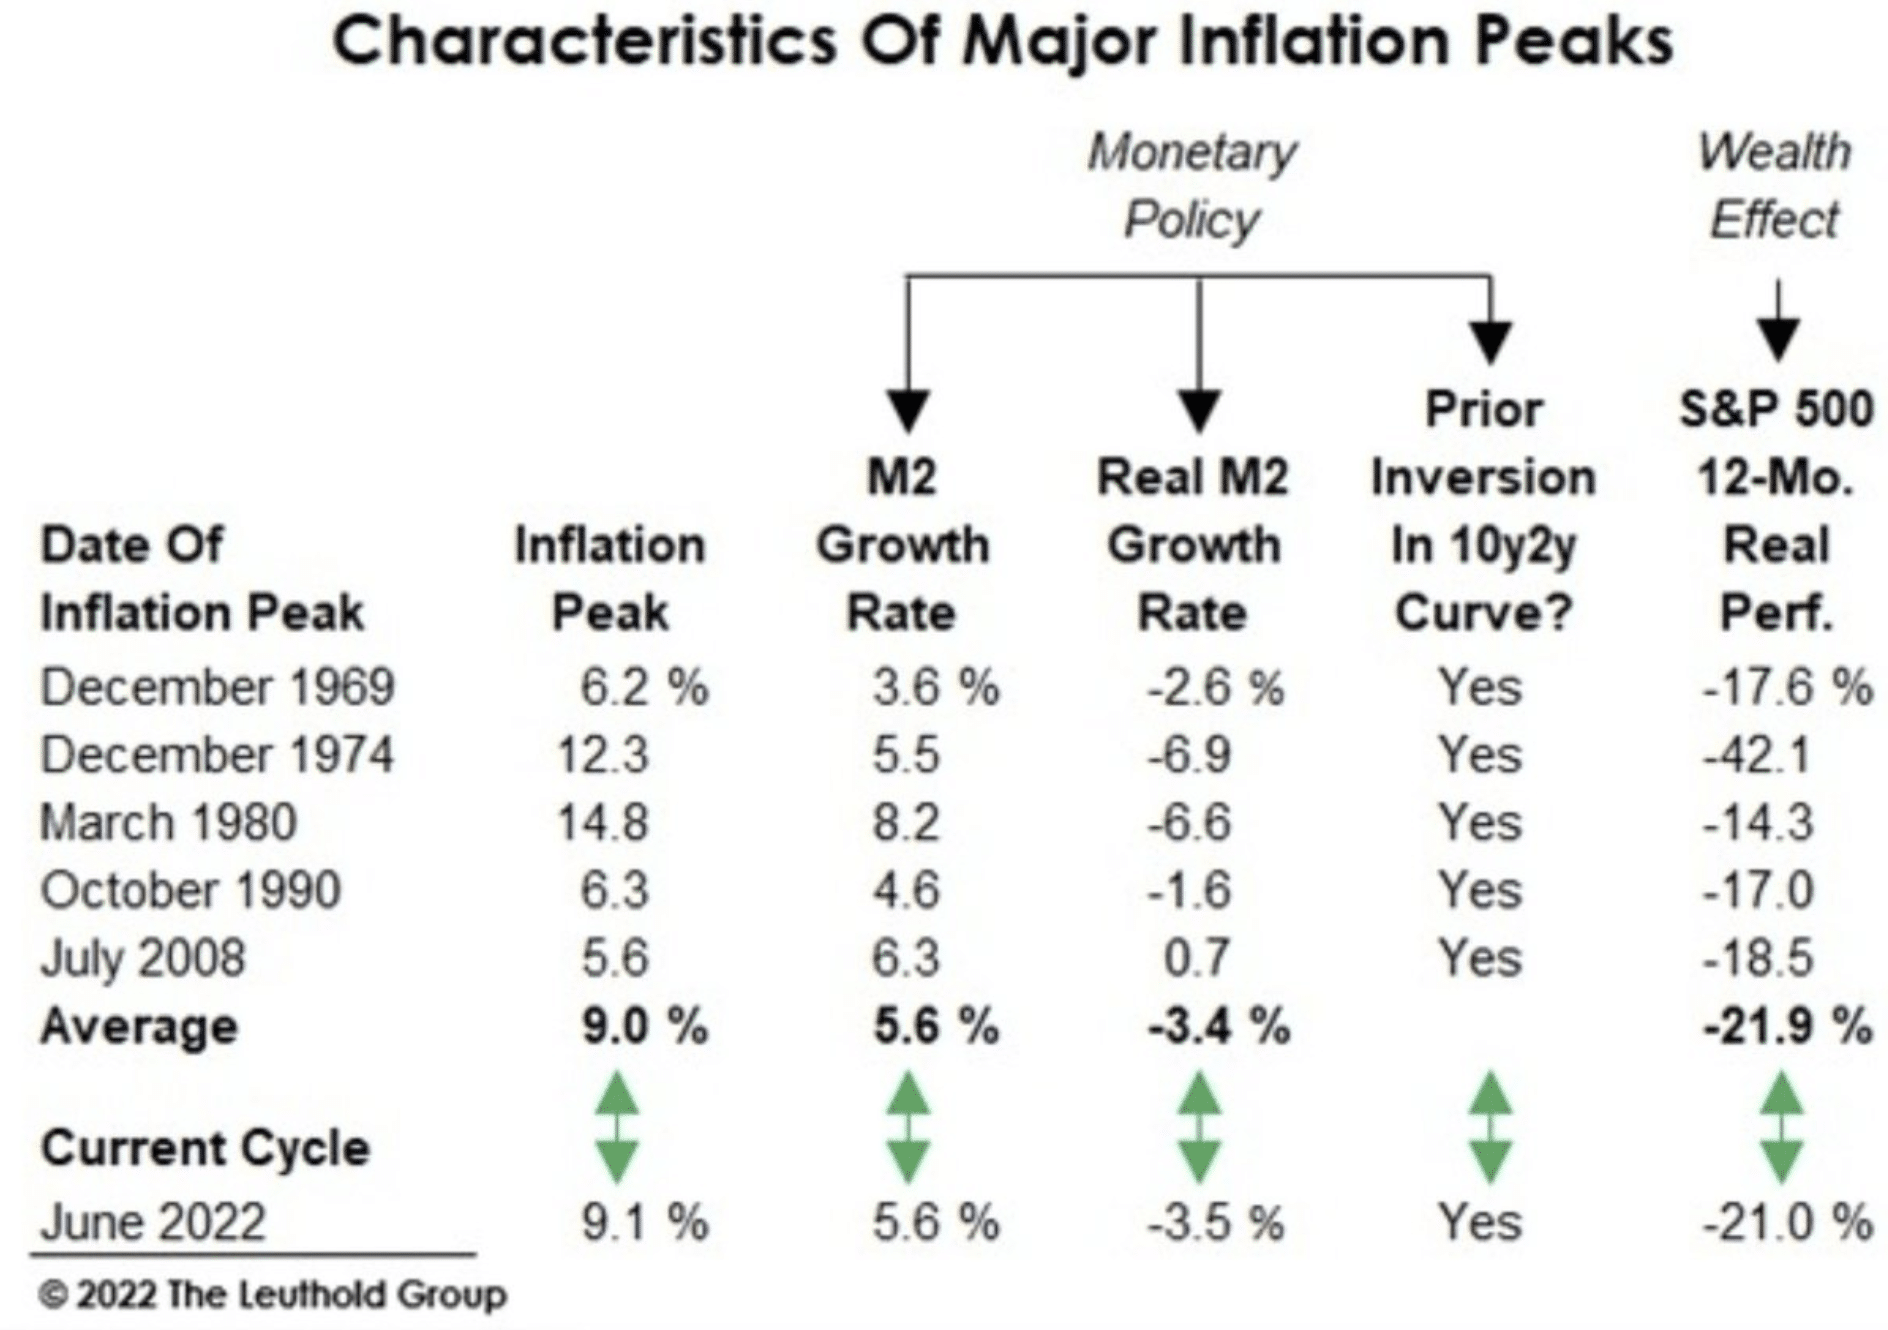
J.P. Morgan’s Marko Kolanovic highlights the belief that recession risks are elevated heading into 2023, but… Investors have never had to consider 8%+ annulized retail sales. Historically, there has never been a recession within 12 months of core retail sales running at an 8%+ annualized rate. Retail sales are currently running an annualized 9% rate, as recognized in the chart below. In the chart above, we can also compare previous HOT inflation regimes and peaks to the present day’s HOT inflation regime. The causes for the current HOT inflation regime may be unique, but the impact is “average” compared to history.
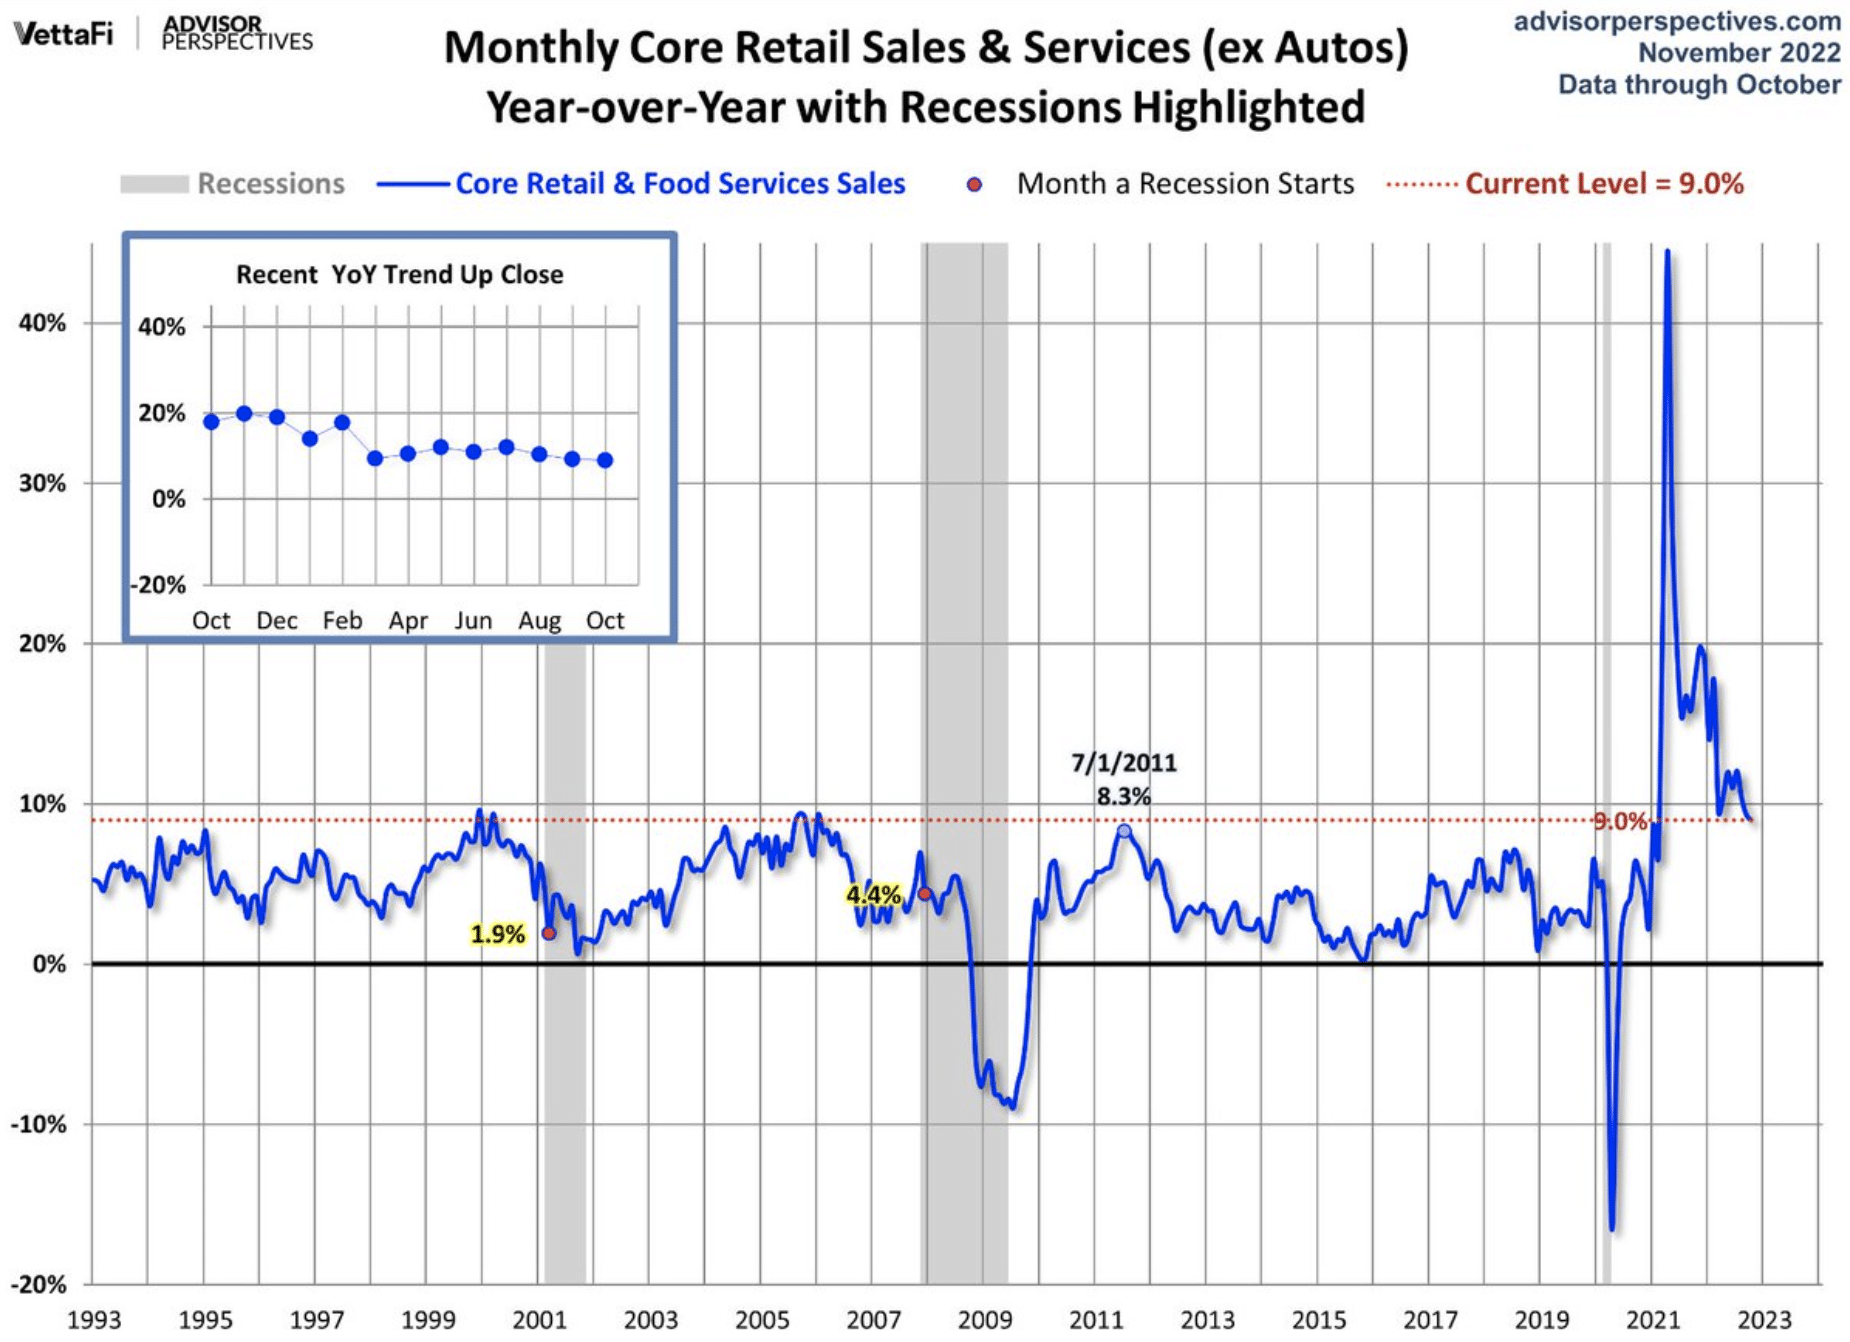
So while recession risks remain high, given some other notable conditions such as inverted yield curves and housing declines, market participants have never had to consider retail sales this high with a seemingly pending recession, $1.4trn in excess household savings, which is enough to last still yet another 12-18 months, 10mm+ job openings, and what may have proven “peak inflation back in June without an actual recession forcing inflation lower. See, in the previous HOT inflation regimes, they all found a disinflation trend while the Fed was raising rates and essentially forcing a recession. That’s simply not the case during the current HOT inflation and Fed rate hike regime. Models simply dont exist for the current conditions, even with the wealth destruction during a HOT inflation regime proving perfectly average compared to history.
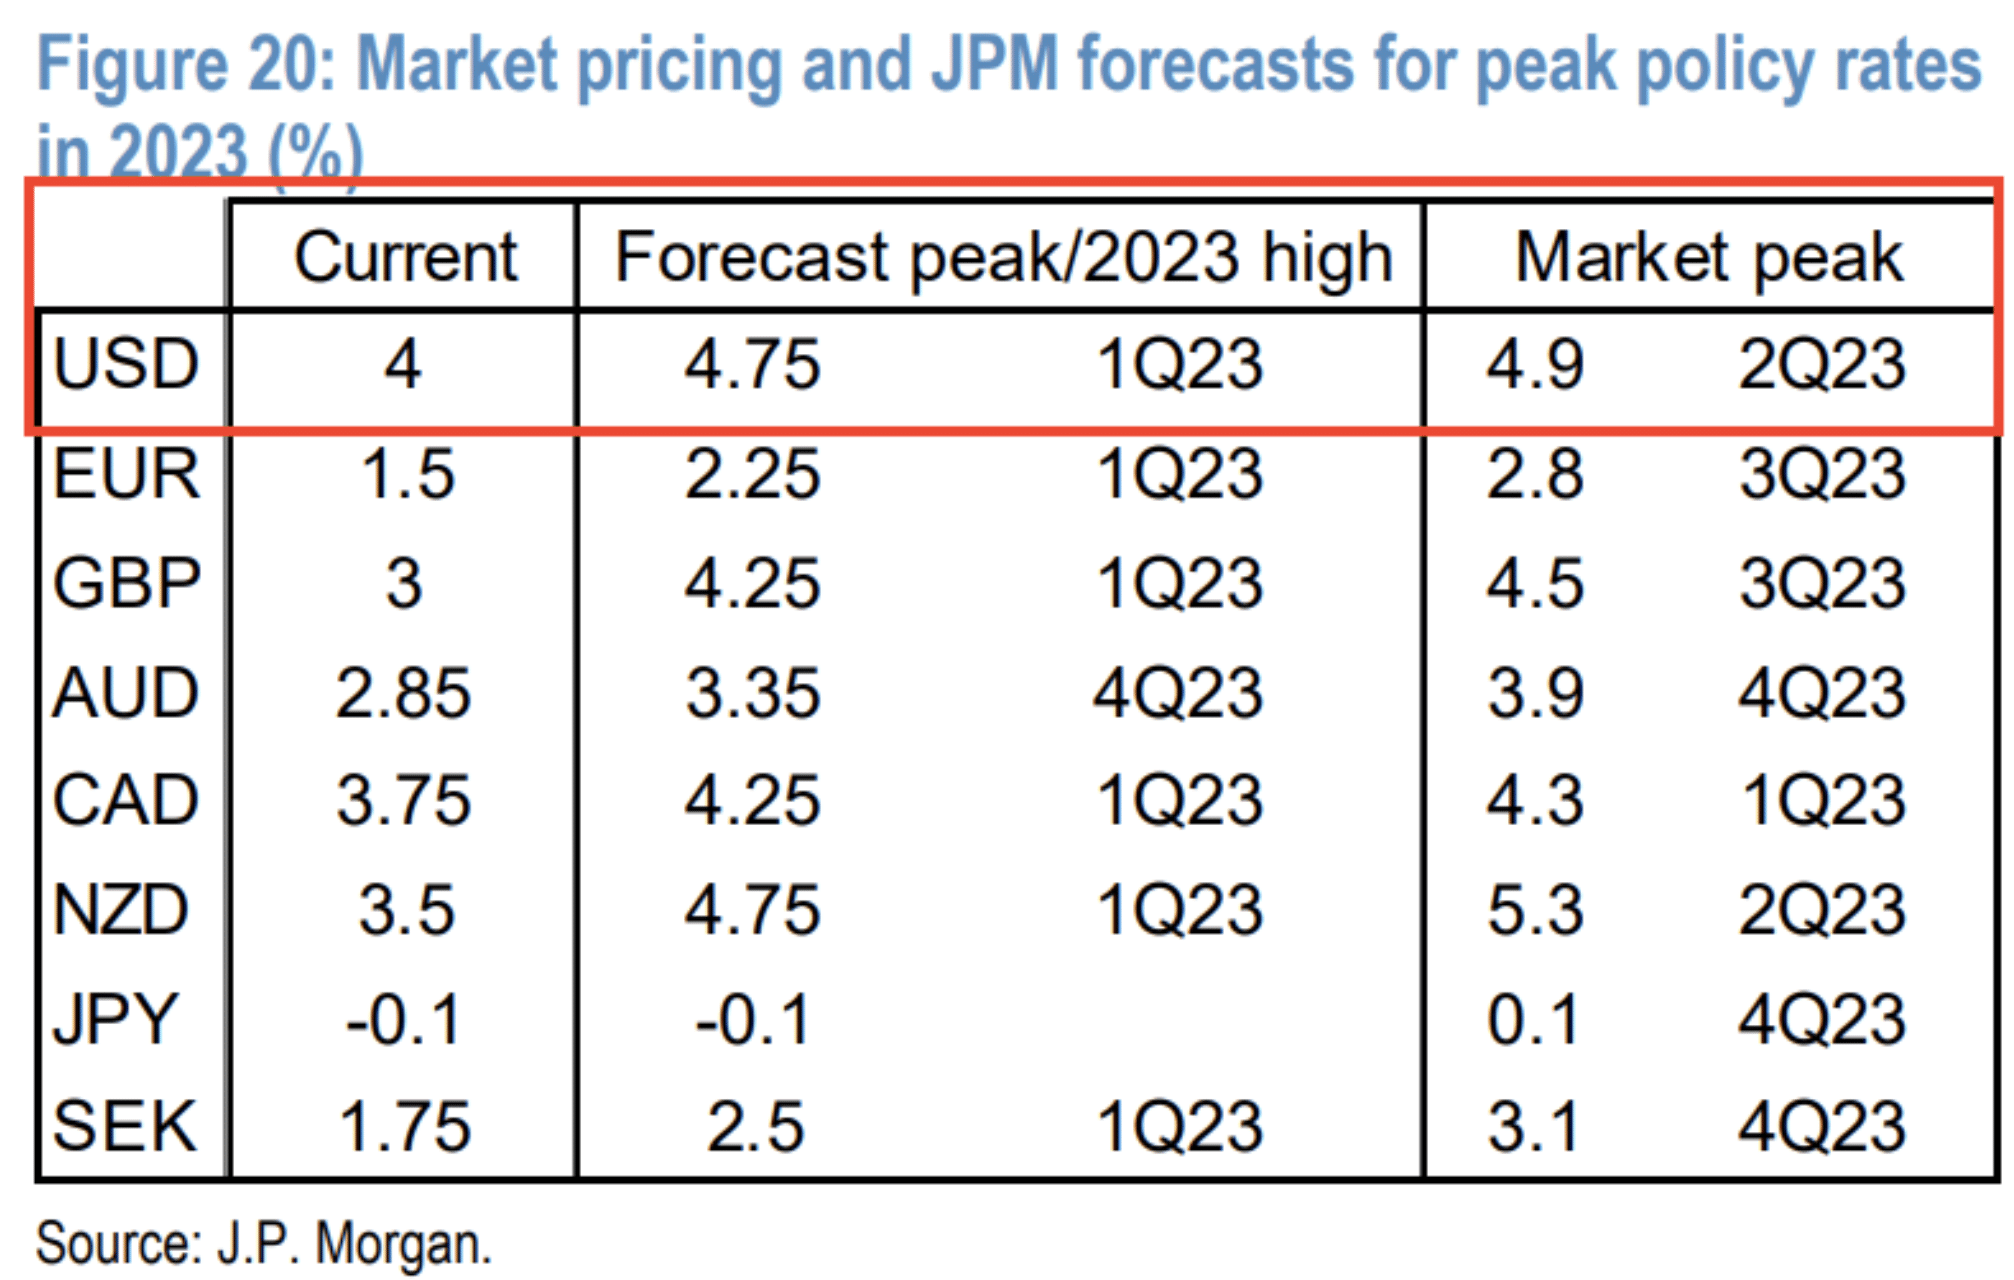
Speaking of rate hikes and J.P. Morgan’s team…, The team believes that while the terminal Fed Fund Rate is being projected to achieve 5% or greater from the current FFR at 4%, J.P. Morgan doesn’t forecast it getting to that point. Yes, most Fed officials have been messaging a rate at, beyond, and around 5%, but that may simply be “tough talk” until the disinflation trend is solidified in Q1 2023. Until then, the message from Fed officials will likely remain “hawkish” in order to contain the markets’ animal spirits and stave-off easing of financial conditions.

Down market years are difficult for investors to “stomach” and climb out from, but they are especially difficult when they occur outside of a recession, and prove the deepest and longest since 1950. We encourage investors to look at the glass half-full, recognizing that the only permanency in markets is that they trend higher over time. As such, the numerations in the tweet above maintain the Finom Group focus. This is truly and logically a great opportunity, but it will demand the appropriate emotional quotient and discipline in order to be realized by investors.
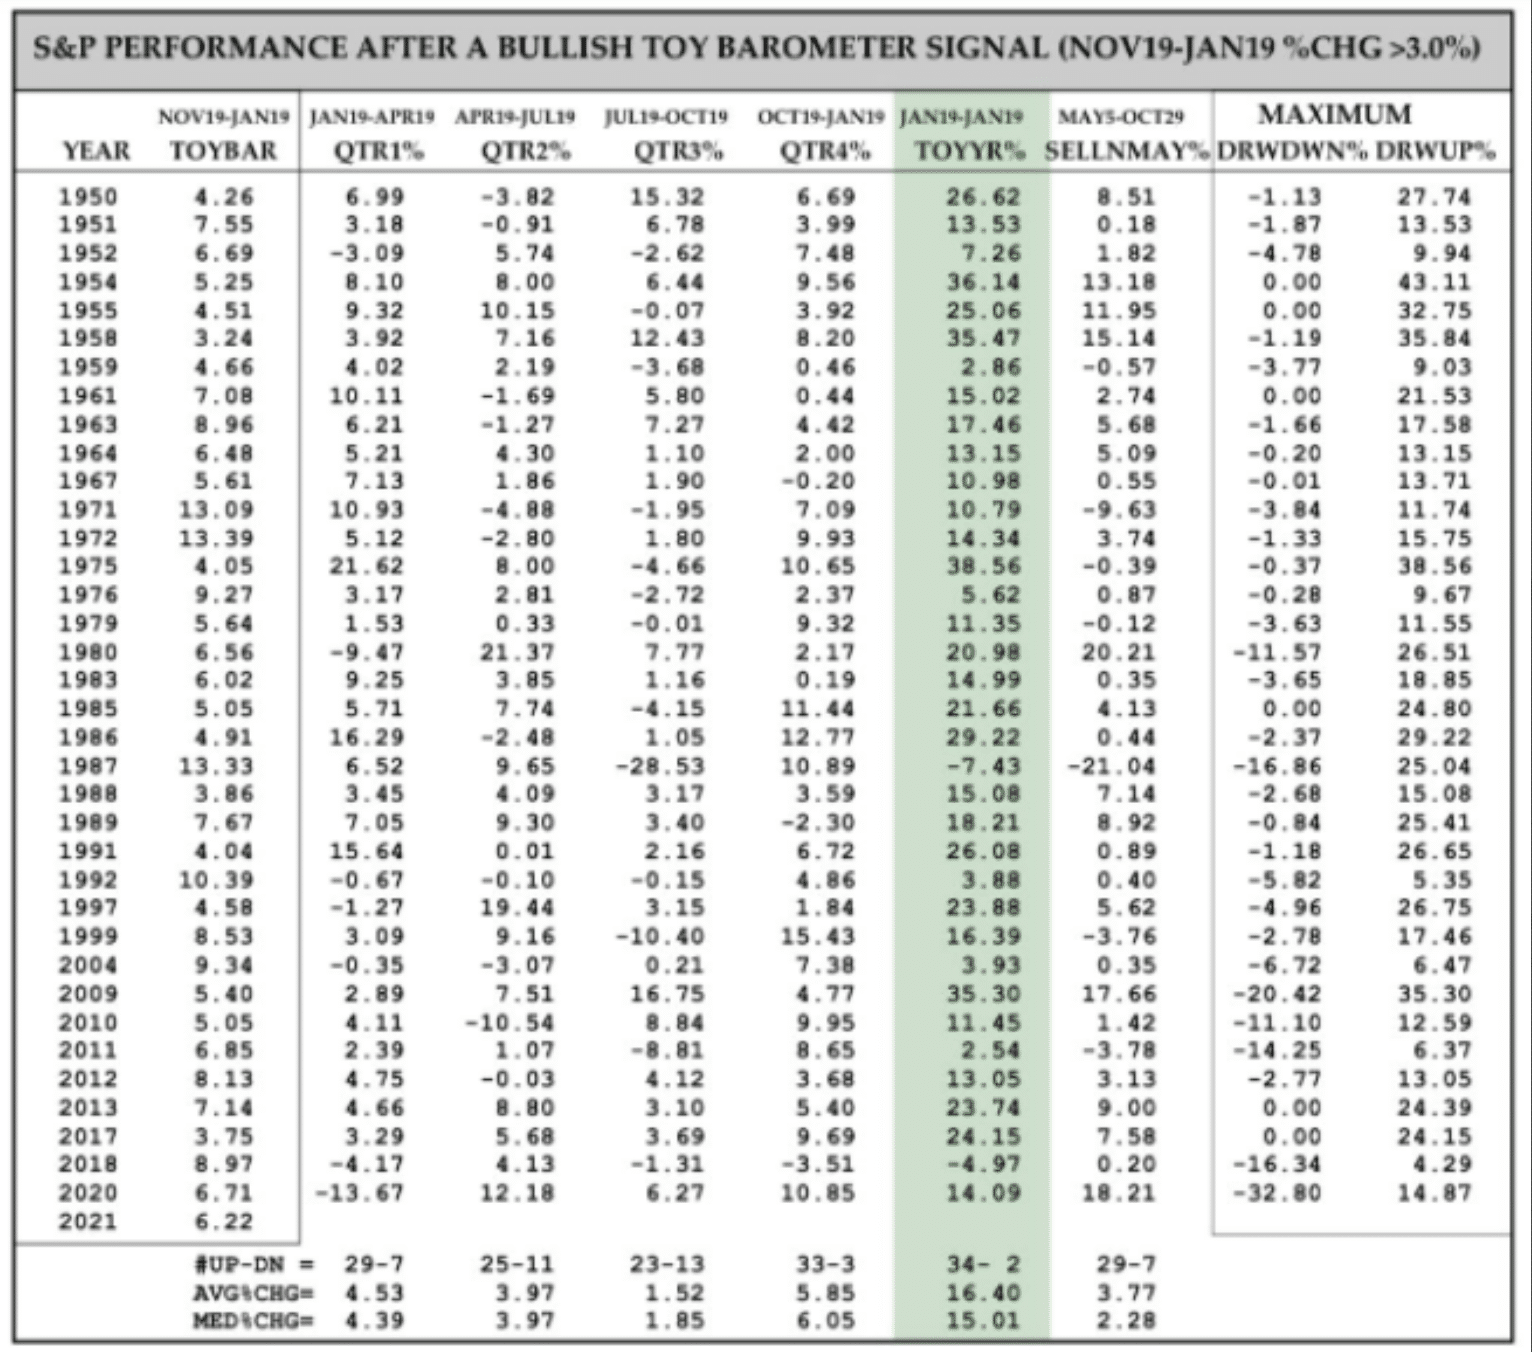
The TOY Barometer by famous quantitative analyst Wayne Whaley is depicted in the table above. Wayne Whaley was a quant before quants existed. He has a math background and has been managing money since the late 1980’s. He considers the TOY Barometer to be the single most reliable seasonality barometer of forward stock market returns, so much so that he’s said if he could only make one trade/year based on one indicator, this is the indicator he would use. TOY is an acronym for Turn. Of. Year. The seasonal dates it tracks is from November 19 to January 19 of a new calendar year, hence turn of year.
Whaley’s goal was to identify what he called the “kingpin of seasonal barometers.” He stated:
“I implored my computer to take a few seconds to exhaustively study S&P performance over every time period of the year and determine which time frame’s behavior was proprietor of the highest correlation coefficient relative to the following year’s performance.”
What he found was there was a high correlation between the S&P 500’s returns between November 19th and the following January 19th and the S&P’s performance the 12 months following January 19. And since the 2-month period straddled the turn of the year (TOY) and the gift giving season, hence the TOY Barometer.
As shown in the table above, the history of the TOY Barometer, the 36 completed bullish signals have led to gains 34 times the following 12 months. The ONLY TWO losses were in 1987, the year of one of the biggest single-day crashes in history, and 2018, the year that included a 20% drop during the fourth quarter and while the Fed was raising rates and performing QT. Both or one of these two Fed operations is likely to end in 2023, which is why the TOY Barometer, as a gauge of future returns, becomes so highly relevant. Additionally, in 1987 and 2018, both years leading up to those failed signals were on the heels of significant gains in prior years, which is not the case for 2022’s start of the TOY Barometer period. Because November 19th falls on a weekend this year, the clock will actually start ticking the following Monday (November 21st). As noted in the TOY Barometer table above, what investors will be tracking is a gain, over the designated time period, of greater than 3 percent.
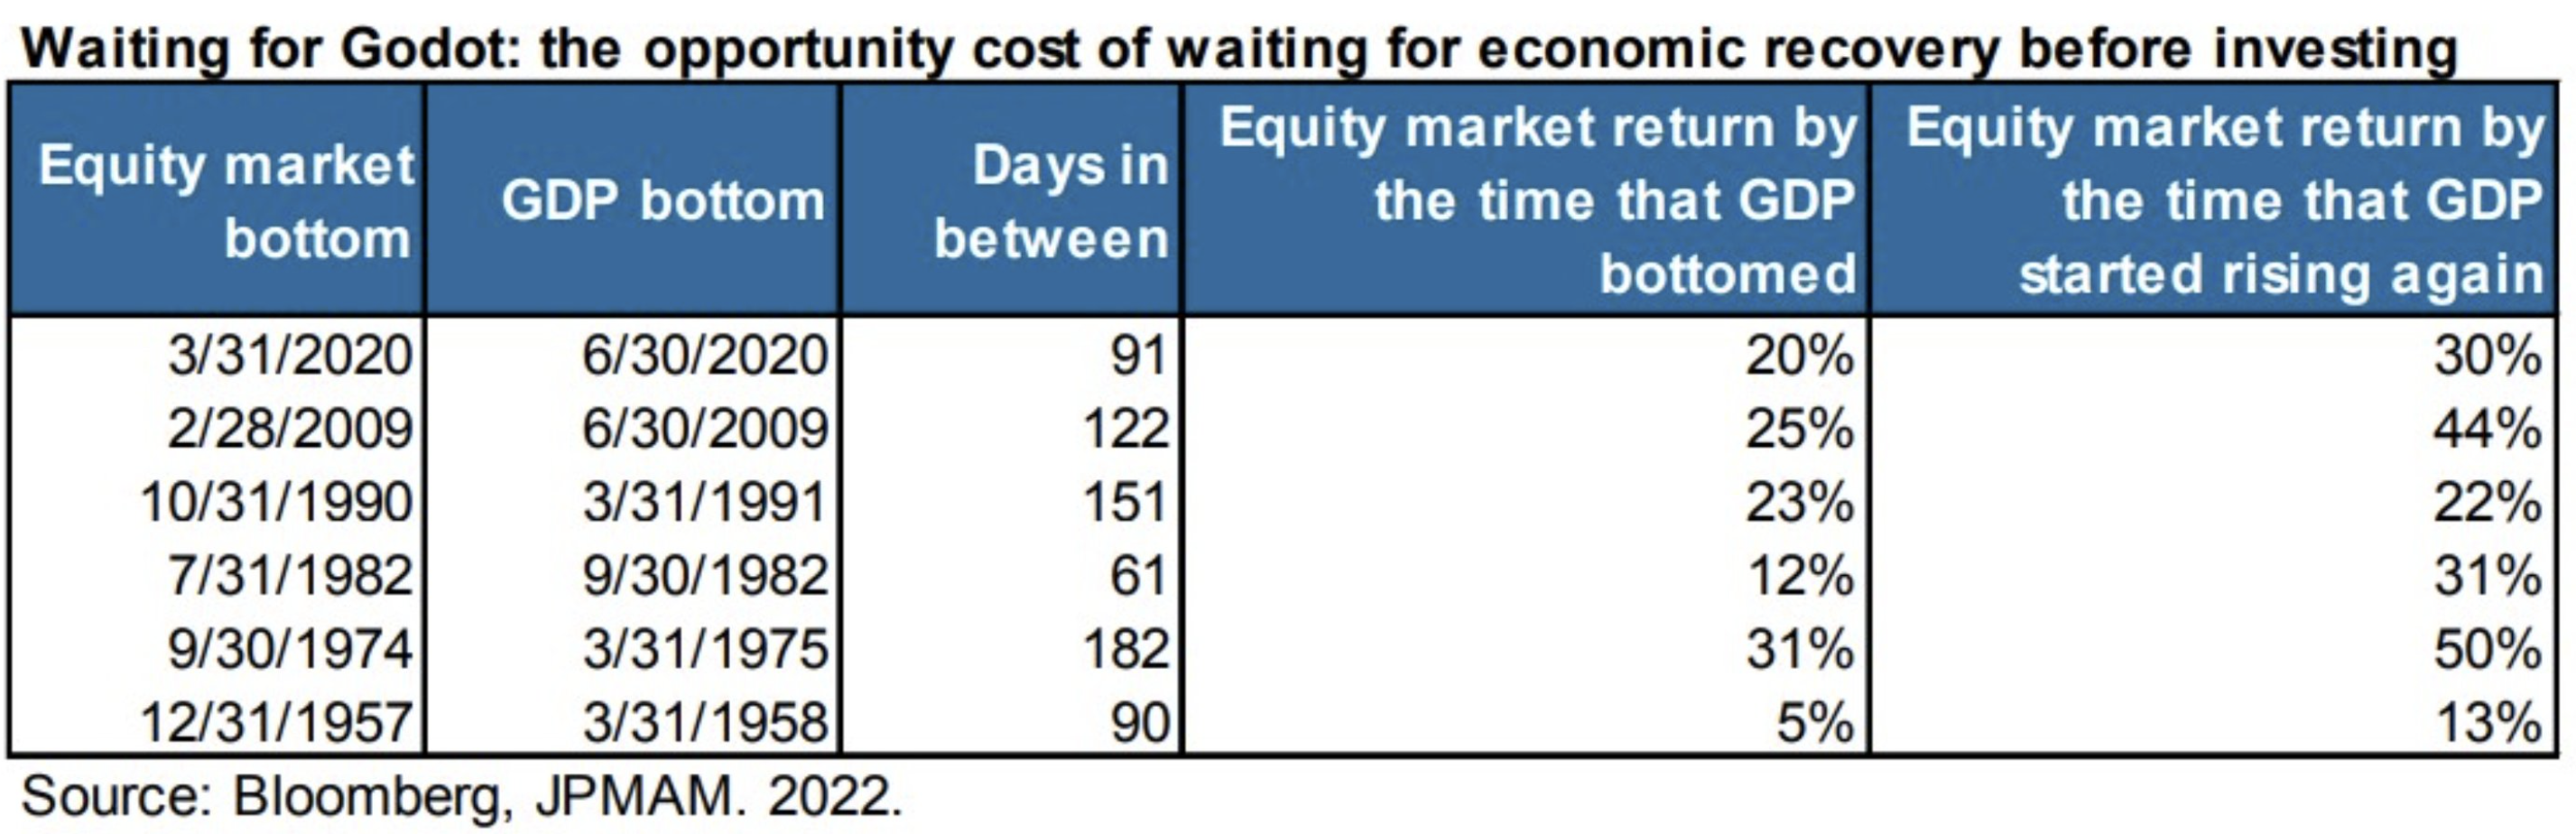
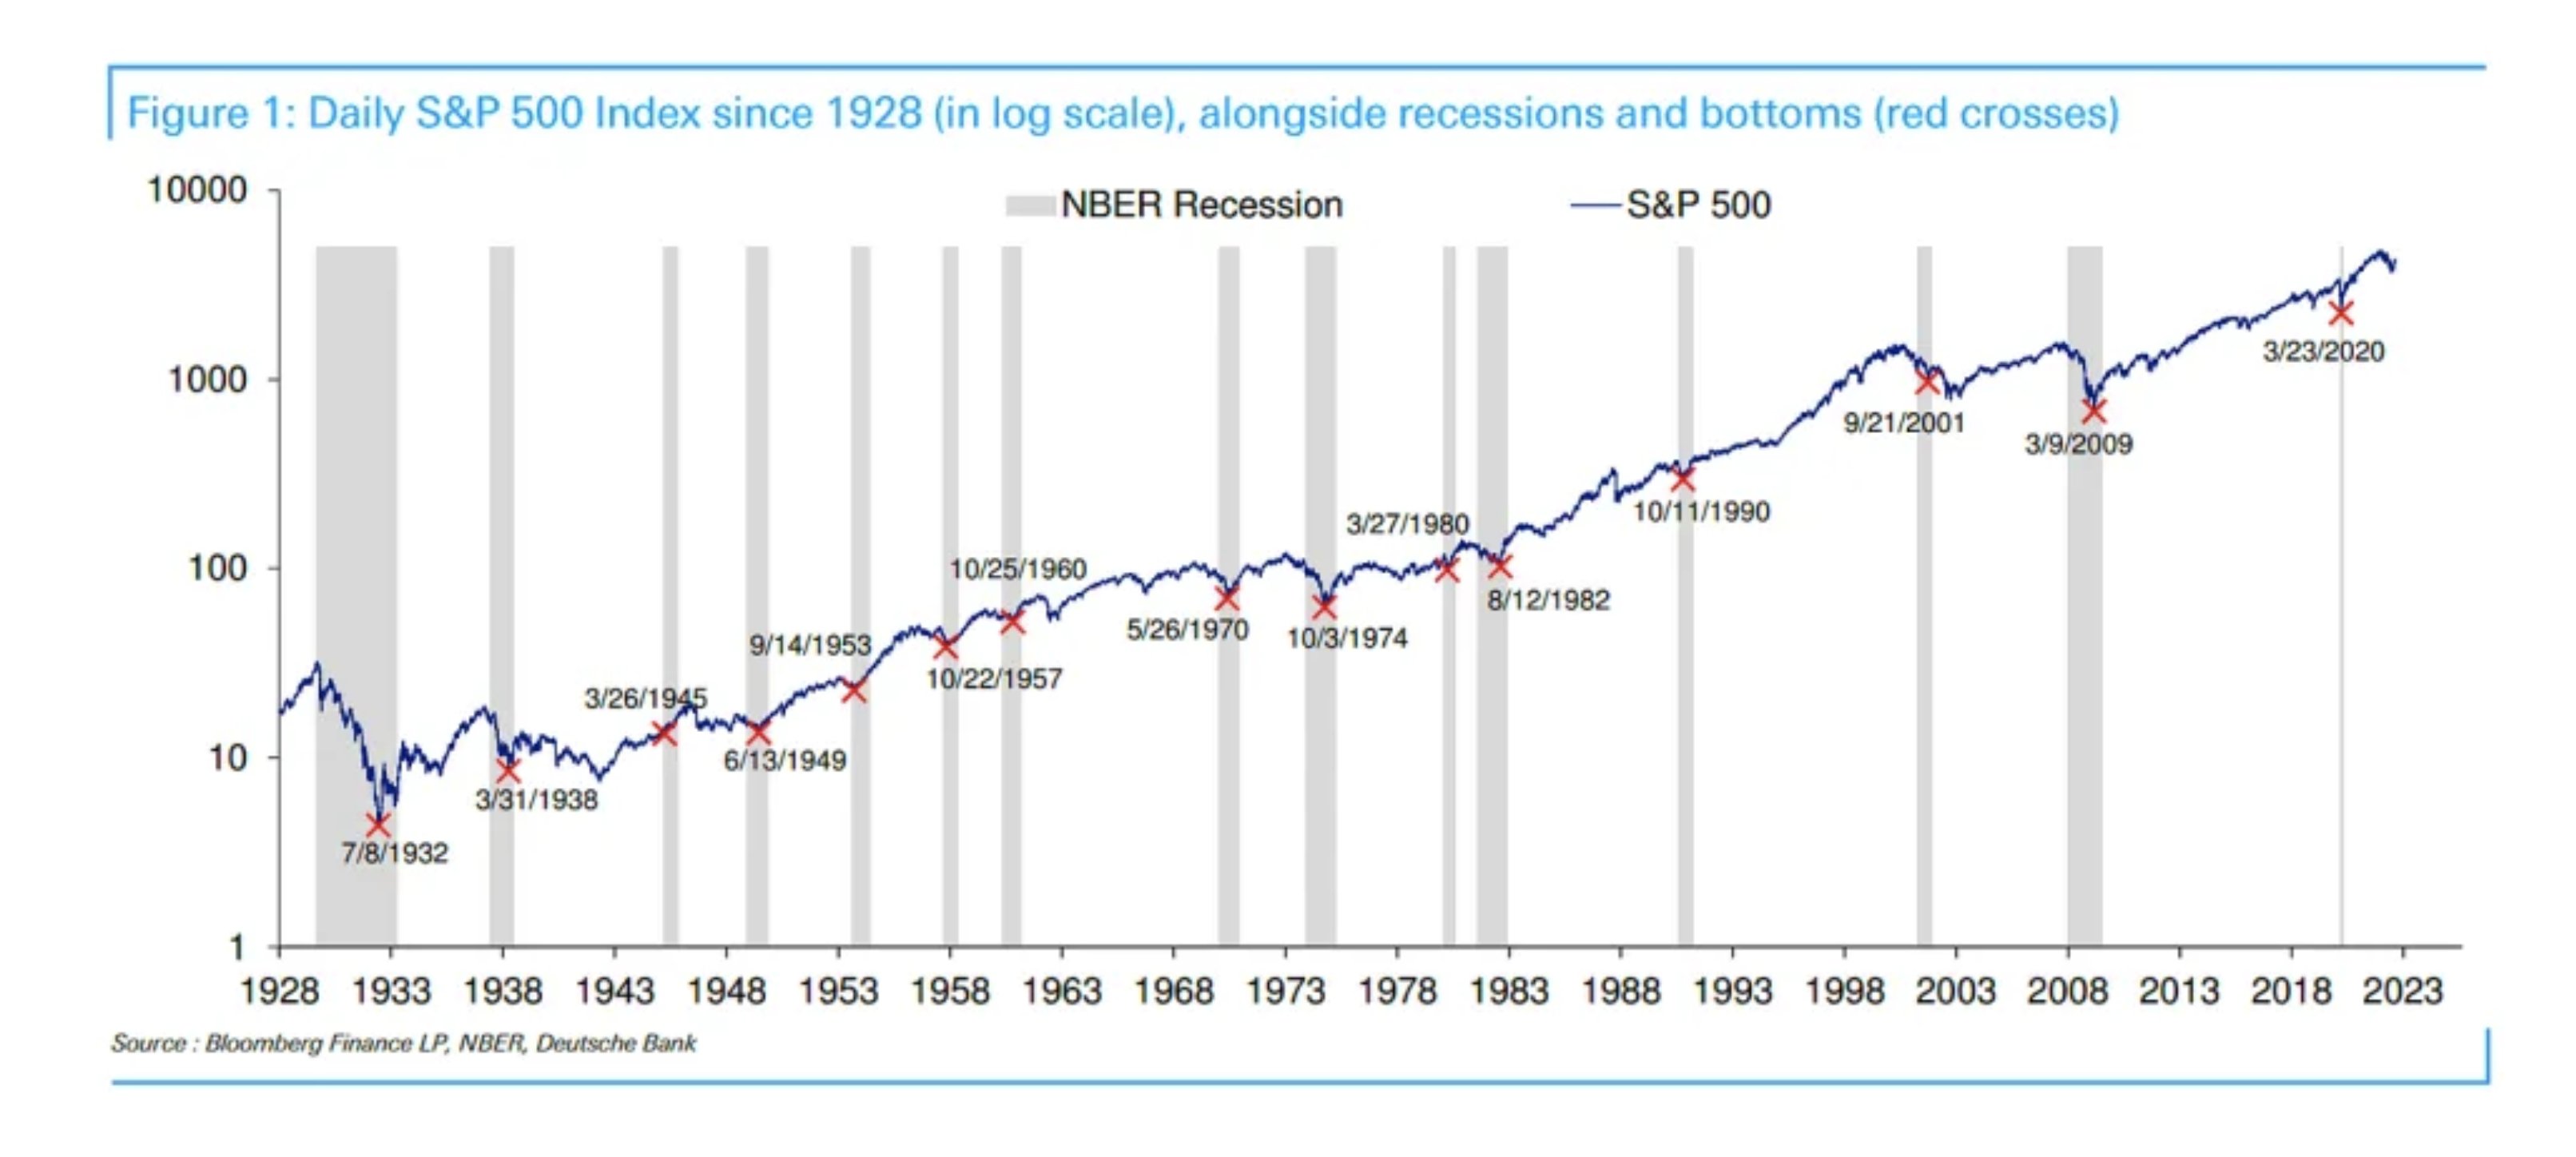
Nobody knows where and when the bear market will bottom, let alone whether or not it has already bottomed. Yes, many will profess to know, say all the right things leading you to believe they know, but indeed noboody knows. The fact is that even if you have a strong belief, the NEED to know proves irrelevant. The best approach to bear markets is to simply recognize that they all end. In fact, most end in October, historically. Moreover, trying to time a market bottom, holding far too much cash in order to curb drawdowns is often the recipe for “missed opportunity” otherwise known as OPPORTUNITY RISK COSTS. The table above identifies the time between Market and Economic bottoms! S&P 500 has historically bottomed roughly 115 days or ~4 months ahead of economic bottoms. OPPORTUNITY risk from moving to cash, trying to time market/economic bottoms for fear of drawdowns is HUGE! Why? Because the market has generally already gained 16% on average by the time GDP has bottomed, as shown in the table above. And when the economy is bottoming, trust that the headlines will not breed investor confidence.

Many investors question why it is that the market typically bottoms before the economy. The chart above is another nice visualization and way to answer that very quesiton. Typically the markets P/E begins expanding once a recession sets in. Remember that the market is a forward discounting mechanism, typically pricing a recession and earnings decline ahead of the actual recession occurring. By the time the recession is taking place, with YoY earnings faltering, the market has largely priced the event/s. After this market discounting operation, the market then begins to price the recovery process, for which the first signs of the process show up by way of P/E expansion. Investors begin to anticipate an earnings rebound with multiples EXPANDING. A usual signal is a trough in Industrial Production.
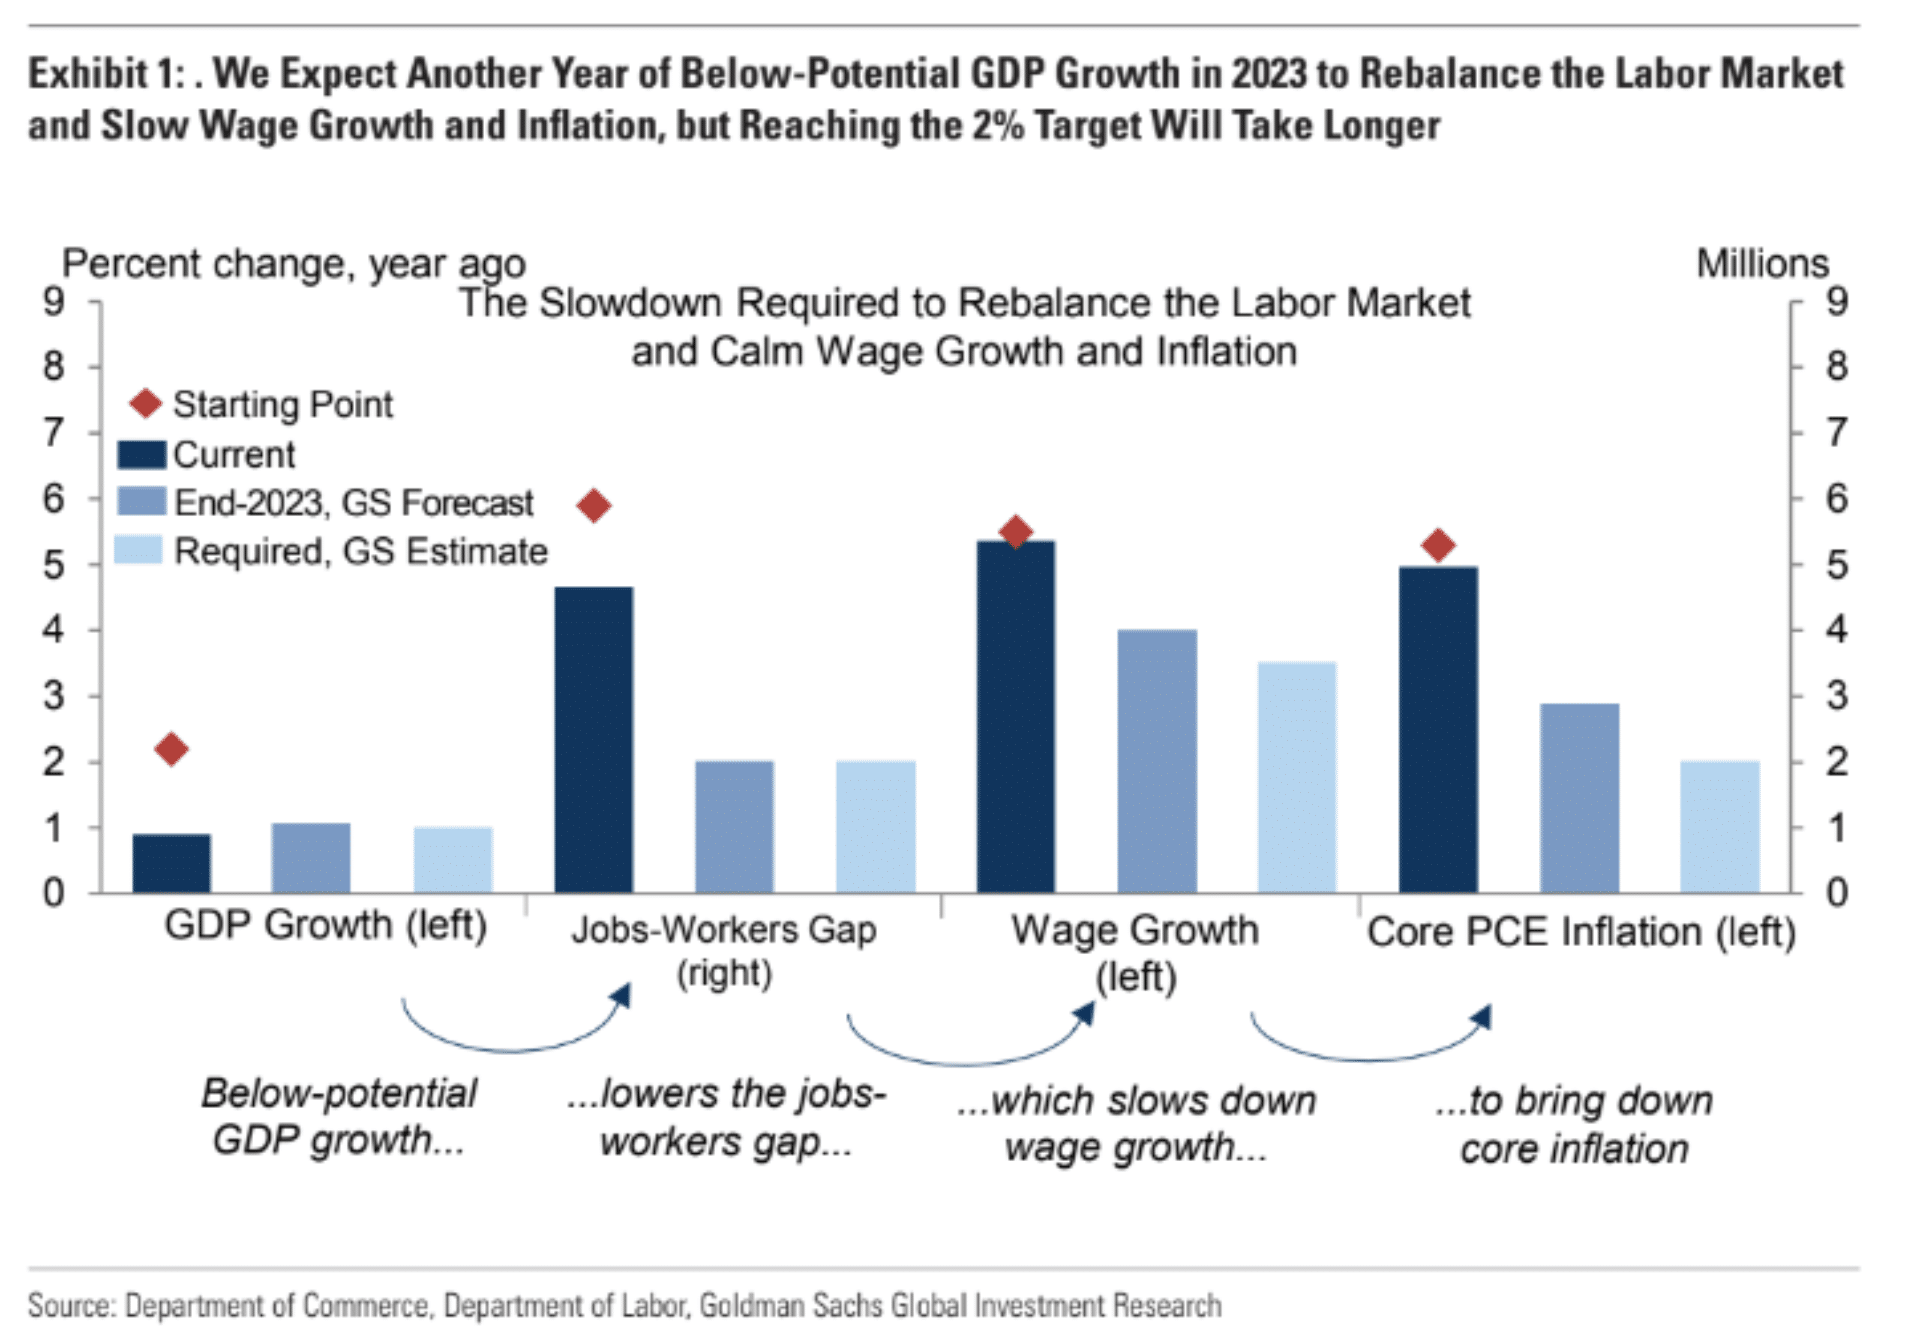
Enough from J.P. Morgan. Let’s look at some forecasts and highlights from the Goldman Sachs team. In their latest outlook, Goldman Sachs now expects another year of below-potential GDP growth in 2023 to rebalance the labor market and slow wage growth and inflation. Reaching the 2% target will, however, take longer. Note that the team is not calling for a recession, but recognizes the probability of a recession is rising with each rate hike implemented by the Federal Reserve. Goldman recently added another 25bps worth of Fed rate hikes to the firm’s forecast. They continue to expect a 50bp hike in December, 25bp hikes in February and March, and now add a 25bp hike in May 2023. This raises their forecast of peak Fed Funds rate to 5-5.25% (vs 4.75-5% previously & 4.9% peak in mkt pricing).
“Still see 35% probability U.S. economy will enter a recession in next 12 months … well below the 60-70% consensus in the latest Wall Street Journal forecaster survey because we still see a very plausible path … without a recession.”
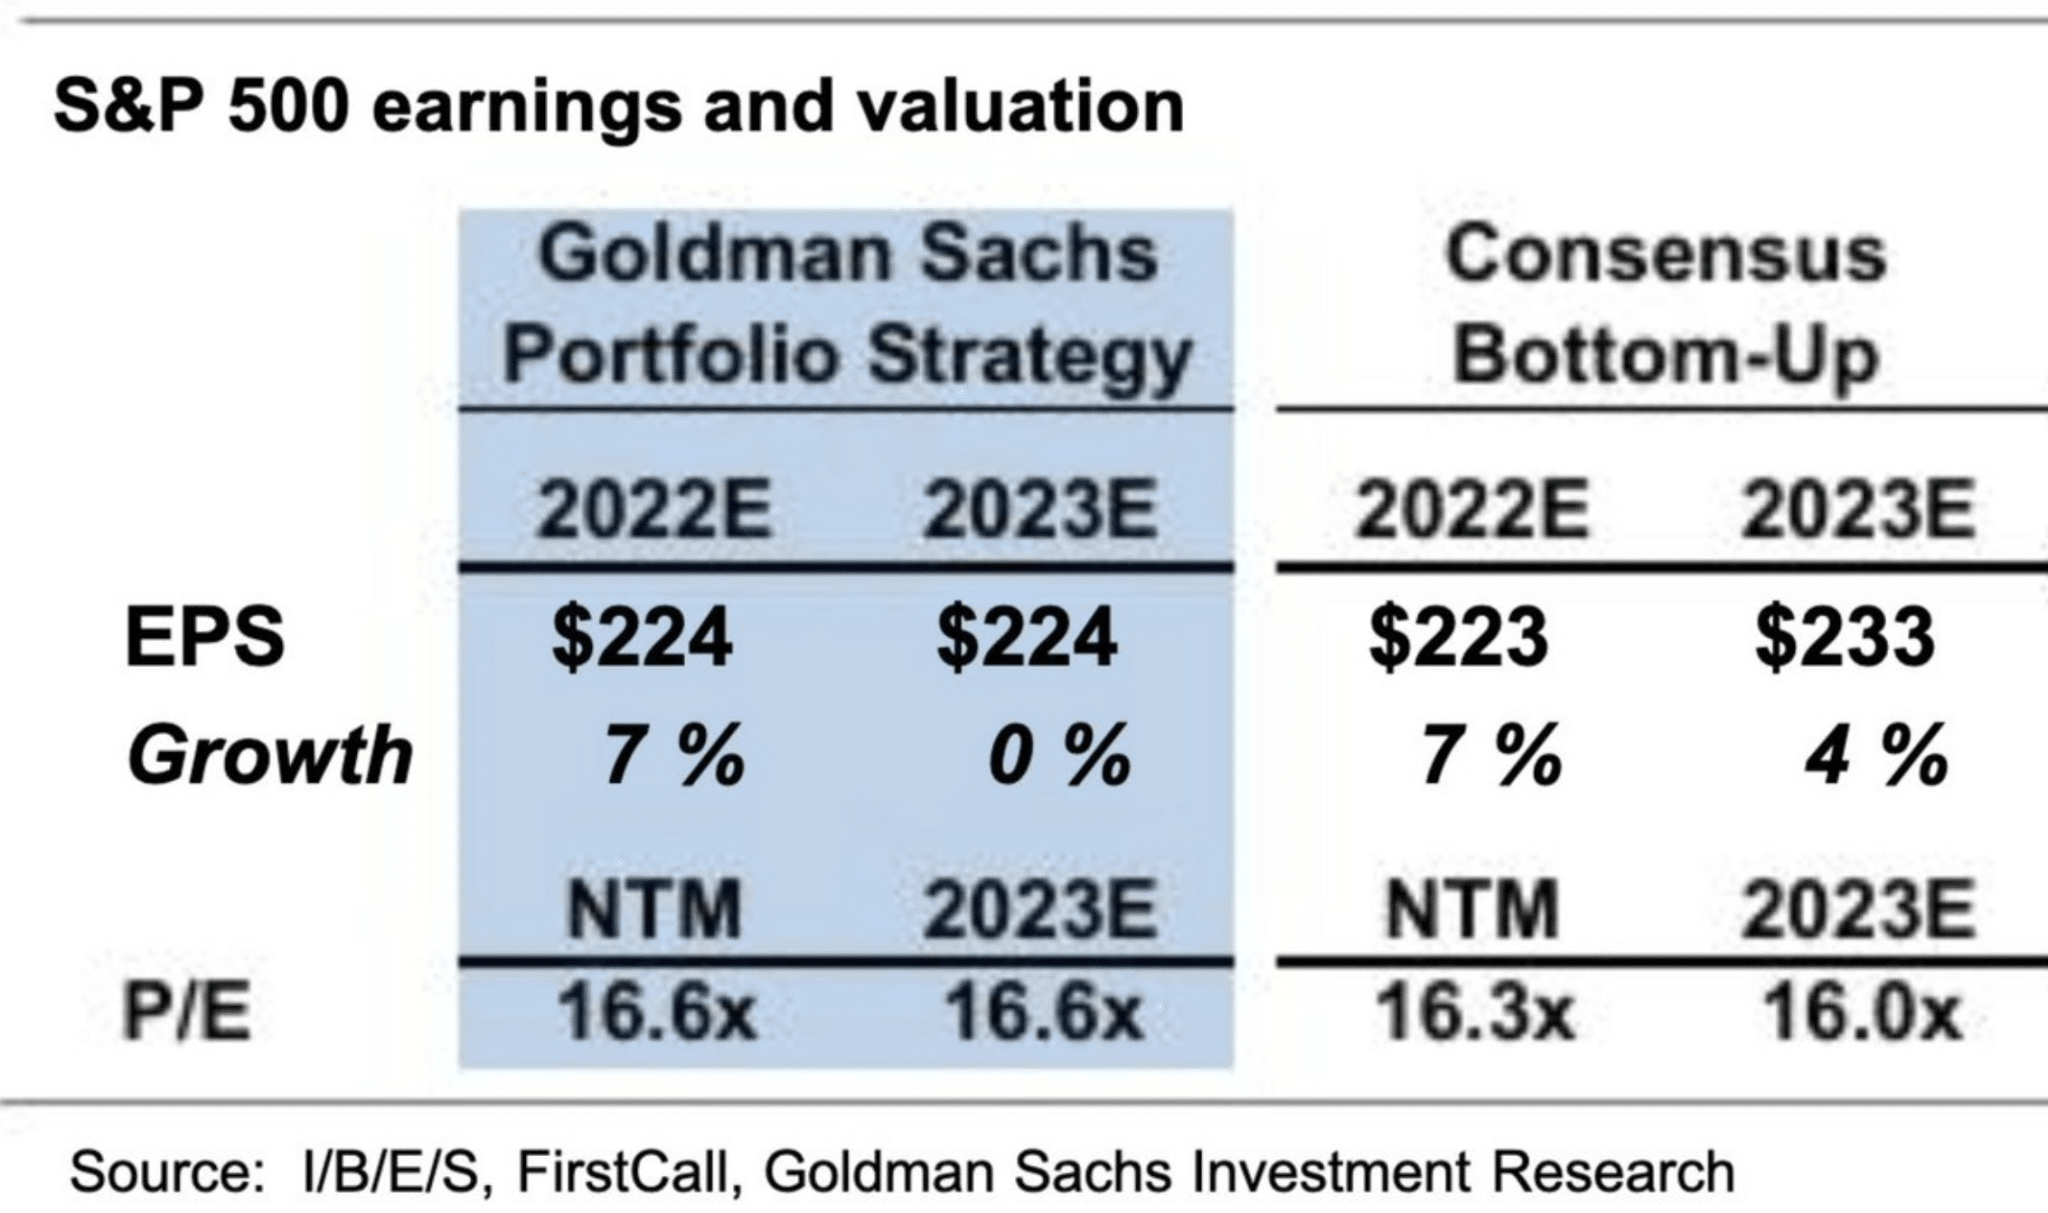
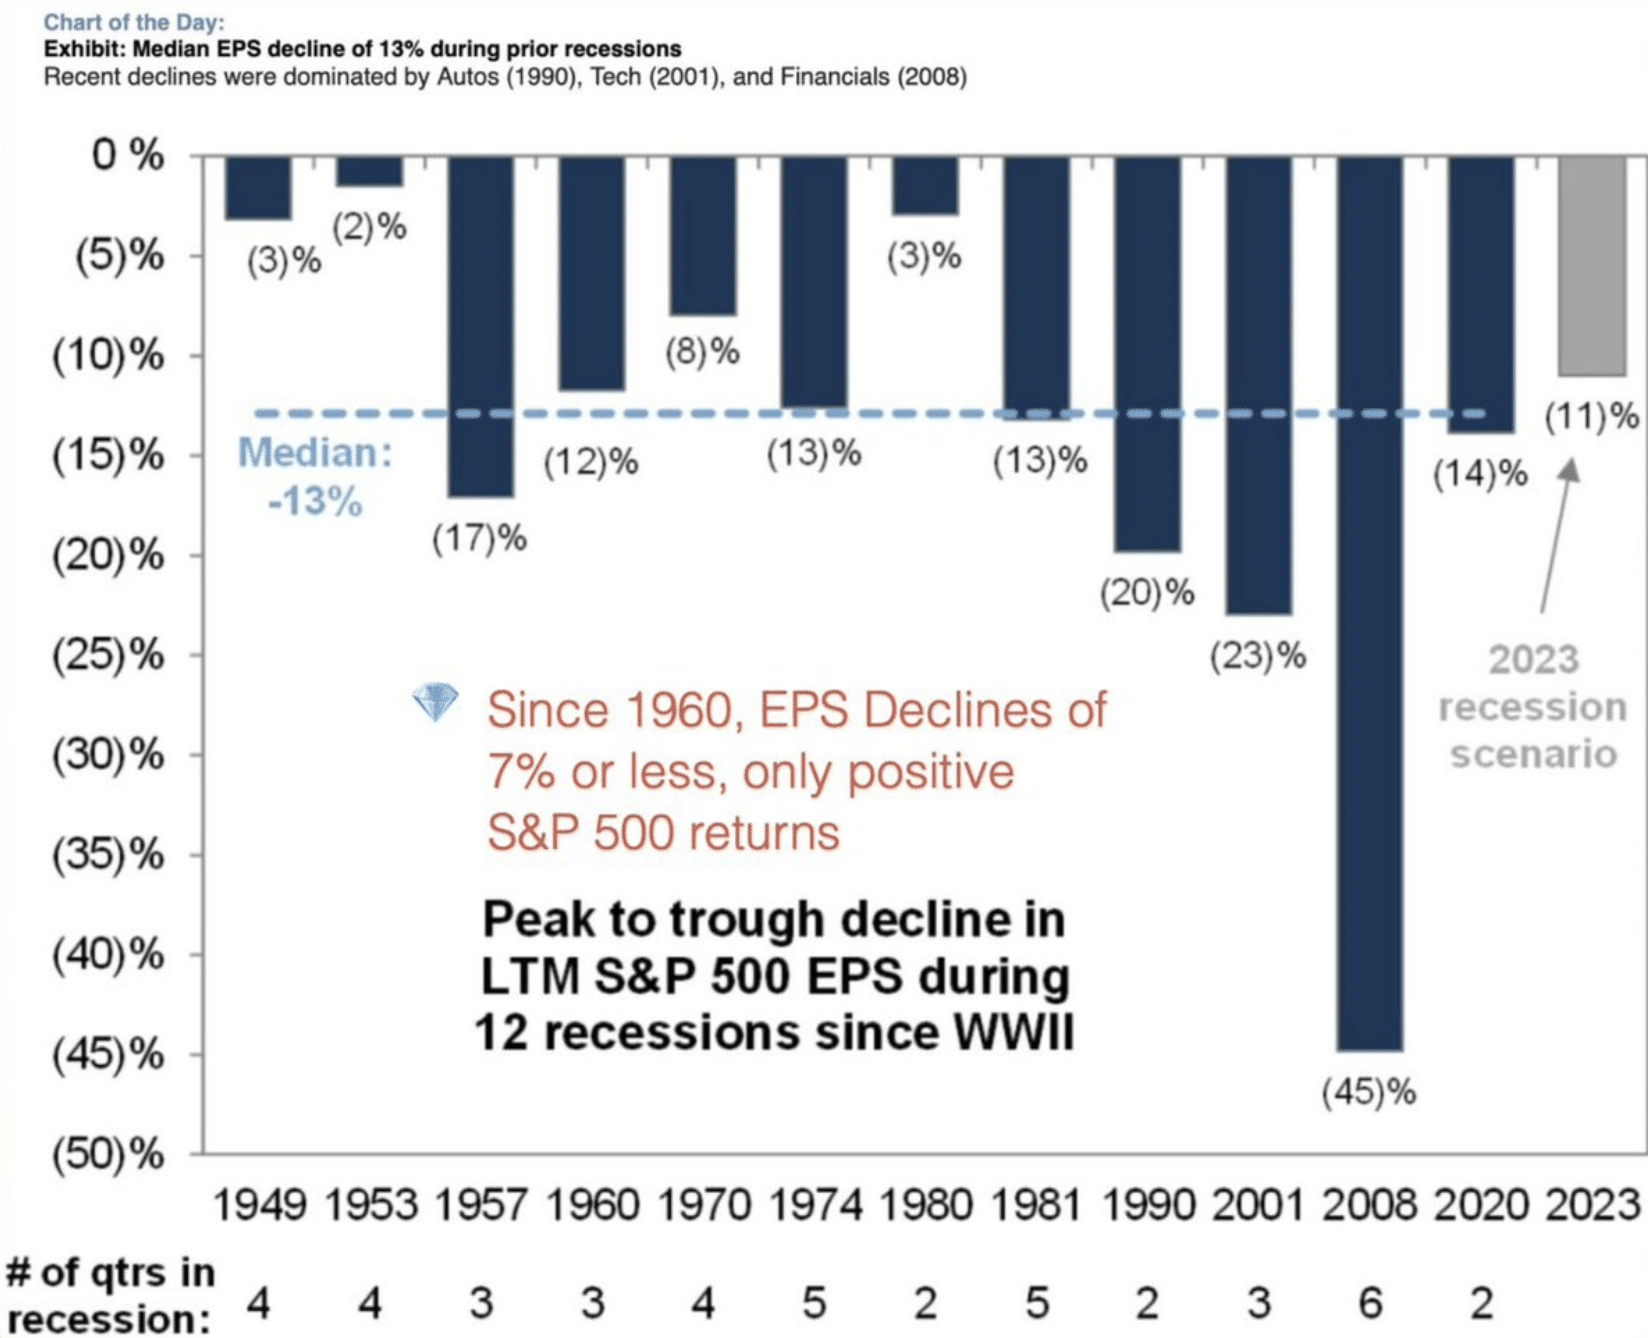
Goldman Sachs has also recently cut its S&P 500 2023 EPS growth to zero, as identified in the table/forecast above. Additionally, if a recession does materialize, the firm cites that earnings growth may see an -11% decline. The median EPS decline in a recession, historically, is -13% since 1949. An earnings decline of anything less than 7% has NOT led to an S&P 500 decline that year though. Not in 1949, 1953, 1980 or since (see chart below). Be careful with the thought that if EPS is down, the market will be down. That is simply not the case, not even the majority of the time.
Clearly, Goldman Sachs is considering all possibilities for the market and economy going forward.
“Conditions typically consistent with an equity trough havent yet been reached. A peak in interest rates and lower valuations reflecting recession are necessary before any sustained stock-market recovery happens. 2023 price target = 4000.”
In terms of Goldmans’ S&P 500 outlook and with additional details, here is the latest notes from their chief equity strategist David Kostin on Thanksgiving Eve-ish:
“The lack of EPS growth will be a stock market highlight for 2023 after this year was “all about a painful valuation de-rating.”
While 2023 will be less painful, Kostin expects “less pain but also no gain.” Goldman’s 3-month price target for the S&P 500 is 3600, the 6-month target is 3900 while the U.S. benchmark index should close the year at 4000.
This projection is based on a belief the Fed will be able to deliver a soft landing for the U.S. economy with the 2023 S&P 500 EPS flat at $224. A hard landing scenario is described as a “distinct risk.”
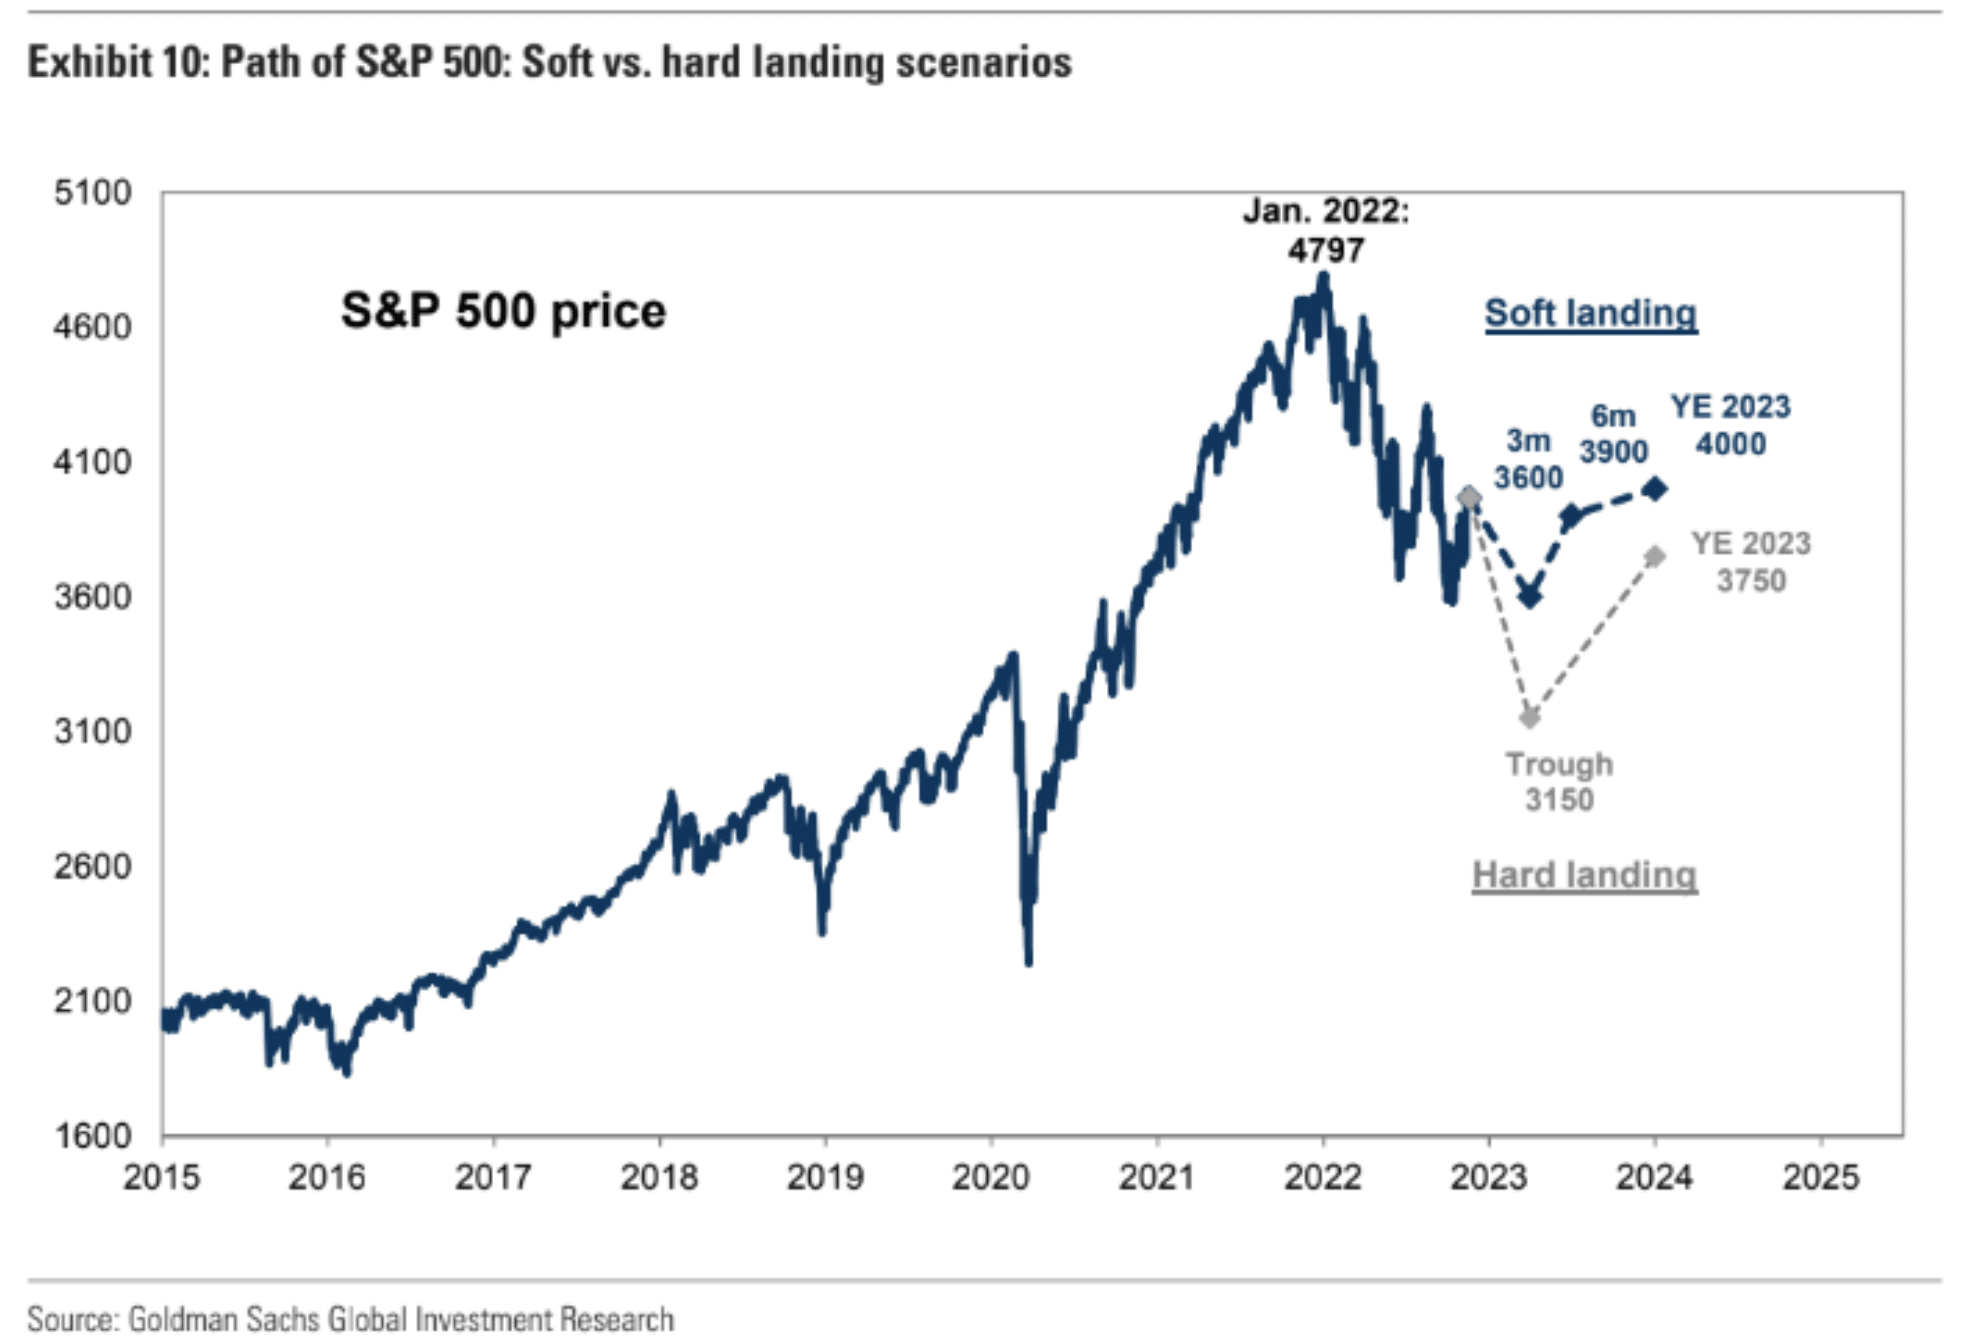
“Assuming a modest contraction in real GDP growth, earnings would fall by 11% to $200, slightly less than the typical peak-to-trough recession decline of 13%. From a valuation perspective, we forecast a trough P/E of 14x, as real yields fall but the risk premium widens sharply. We expect in a recession the S&P 500 would trough at 3150.”
There are simply too many unprecedented conditions and situations, mixed with existing softening in the economy and earnings that don’t lend well to holding fast to any one particular outcome/outlook. Investors would prove wise to consider a wide variety of outcomes, and manage cash on the sidelines into year-end and through the early innings of 2023. Now let’s look at some of the recent notes and outlook from Fundstrat’s Tom Lee.
“The stock market has considerable upside potential into year-end after October’s “game changer” CPI report. Three drivers behind the soft October CPI report, which we believe are “repeatable” for next month’s CPI release. Those include shelter prices showing a meaningful slowing in month-over-month CPI, from a high of 0.8% in September to 0.6% in October. That suggests housing data is “trending towards market reality of deflation. Medical health insurance and durable goods also saw significant declines, driven in part by tough year-over-year comparables and a steady decline in used car prices. There are building drivers to massively slow CPI core inflation over the few months and it is possible we will see three to four consecutive months of +0.3% Core CPI month-over-month. That would pull down core inflation to 3.5%, nearly half of the 6.5% reading seen in most of 2022.”
Lee believes a pause in rate hikes is imminent, which would counter the recent hawkish rhetoric from Fed members.
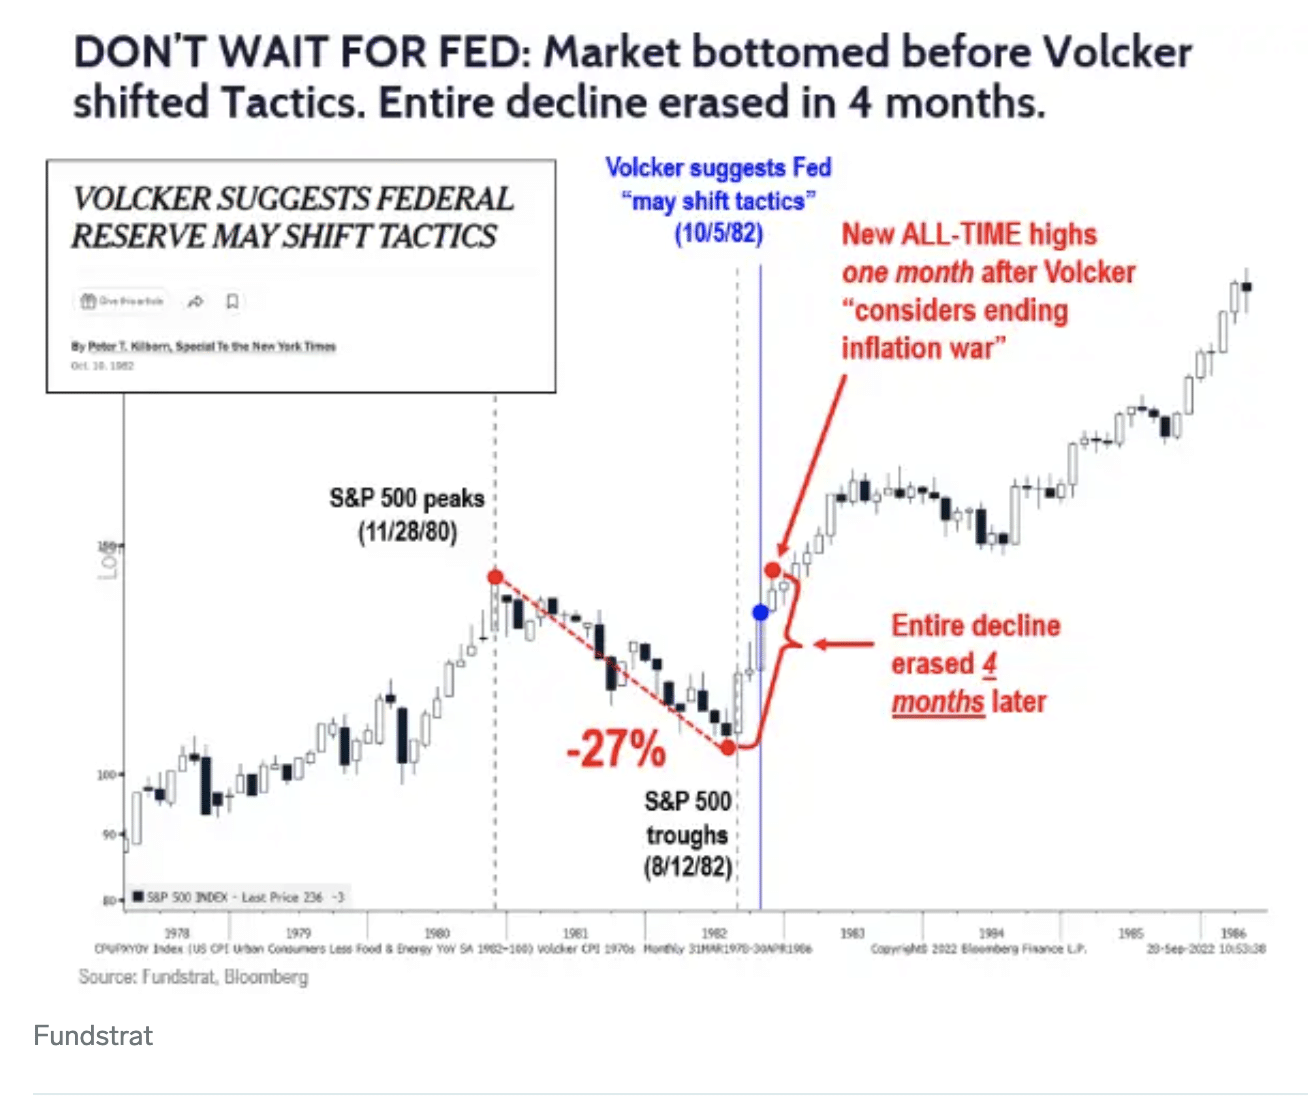
“Recall, in 1982, following the final low in August 1982, the S&P 500 reached a new all-time high within 4 months, erasing entire 27-month bear market. That was a vertical rally. While the Fed likely hasn’t vanquished inflation yet, the stock market is forward looking and has previously “sniffed” out the end of inflation months before it happened in 1982.”
To be clear, Fundstrat’s Tom Lee has underwhelmed with his year-to-date analysis. Having said that, the reporting data lags in CPI could not be more pronounced in the recent inflation regime that did not exist in the 1970s or 1980s, as the CPI calculation was readjusted after the turn of the century. Given this dynamic, it’s more understandable that the bullish Tom Lee and other notable bulls have underwhelmed with their prognostocations in 2022. Having said that, we’ve clear evidence that if the tide hasn’t turned, based on the data, this would demand a policy error by the Federal Reserve going forward. A December rate hike would not constitute a policy error, but a failure to pause and analyze the impact of the existing rate hikes working through the economy in Q1 2023 definitely would rank up there as a policy error. We think the Fed is smarter than the Fed pundits.
“For most of 2022, Fed has not been able to point to measurable progress on containing inflation but a significant constellation of leading indicators showed deflation/soft inflation was in the pipeline. October CPI is the first month the ‘hard’ data syncs with the ‘soft’ data.
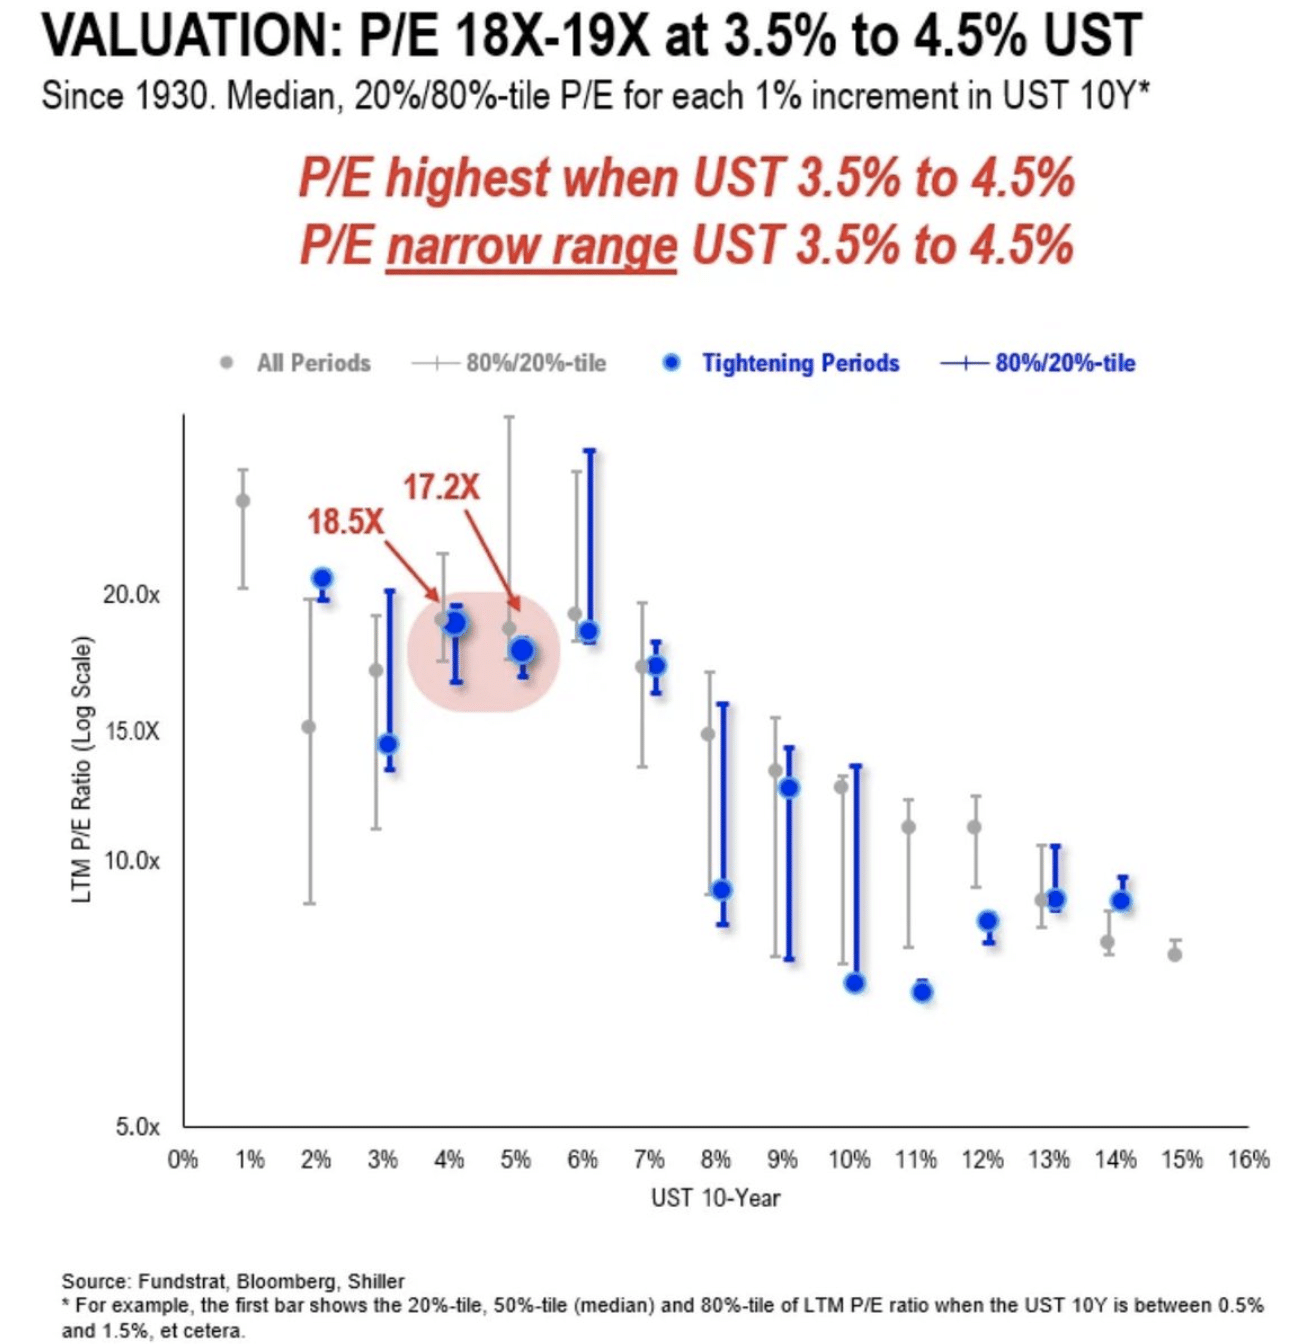
“Since 1871, the average price-to-earnings ratio when the 10-year yield was 3.5%-5.5% is 19x. The forward and trailing P/E ratio for the S&P 500 is 16.1x and 17.8x, respectively, as of November 4. That suggests further room to run. Valuation nor earnings constrain stocks, if inflation has bottomed.”
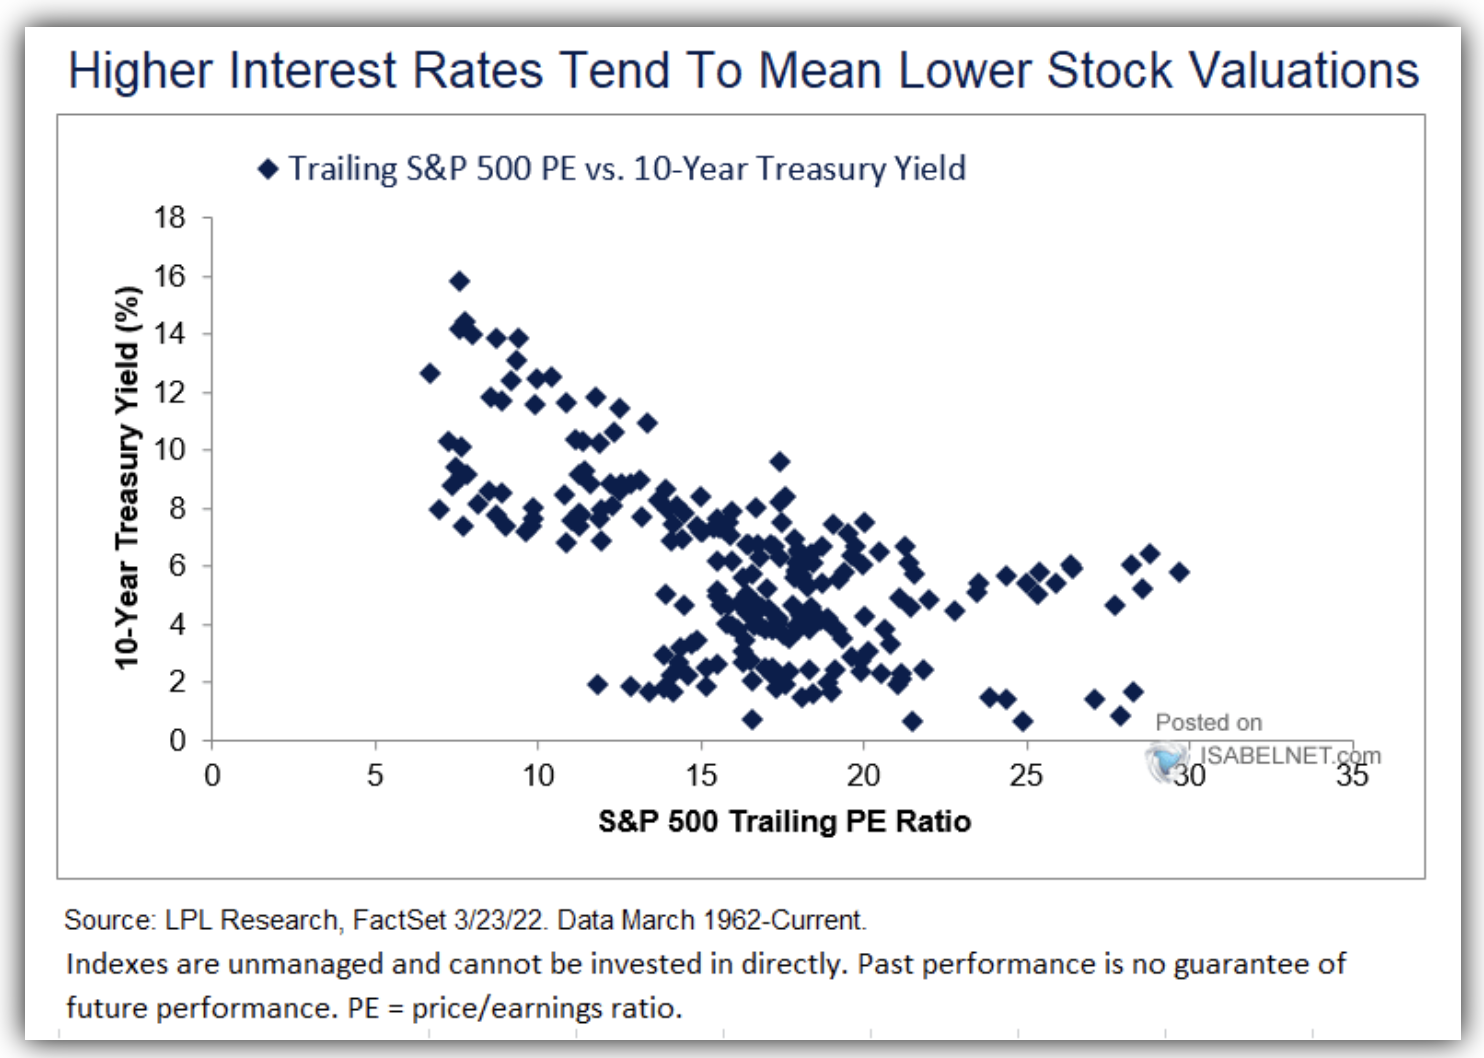
The scatter plot of S&P 500 P/E Ratios relative to the 10-Year yield validates Fundstrat’s chart. What investors may concern themselves with, however, is whether or not the 10-Year yield manages to move beyond 4.5%, which historically compresses the S&P 500 P/E further. Finom Group is of the opinion that the 10-Year yield has peaked for the current cycle and will likely be range bound to lower, through Q1 2023, at least.
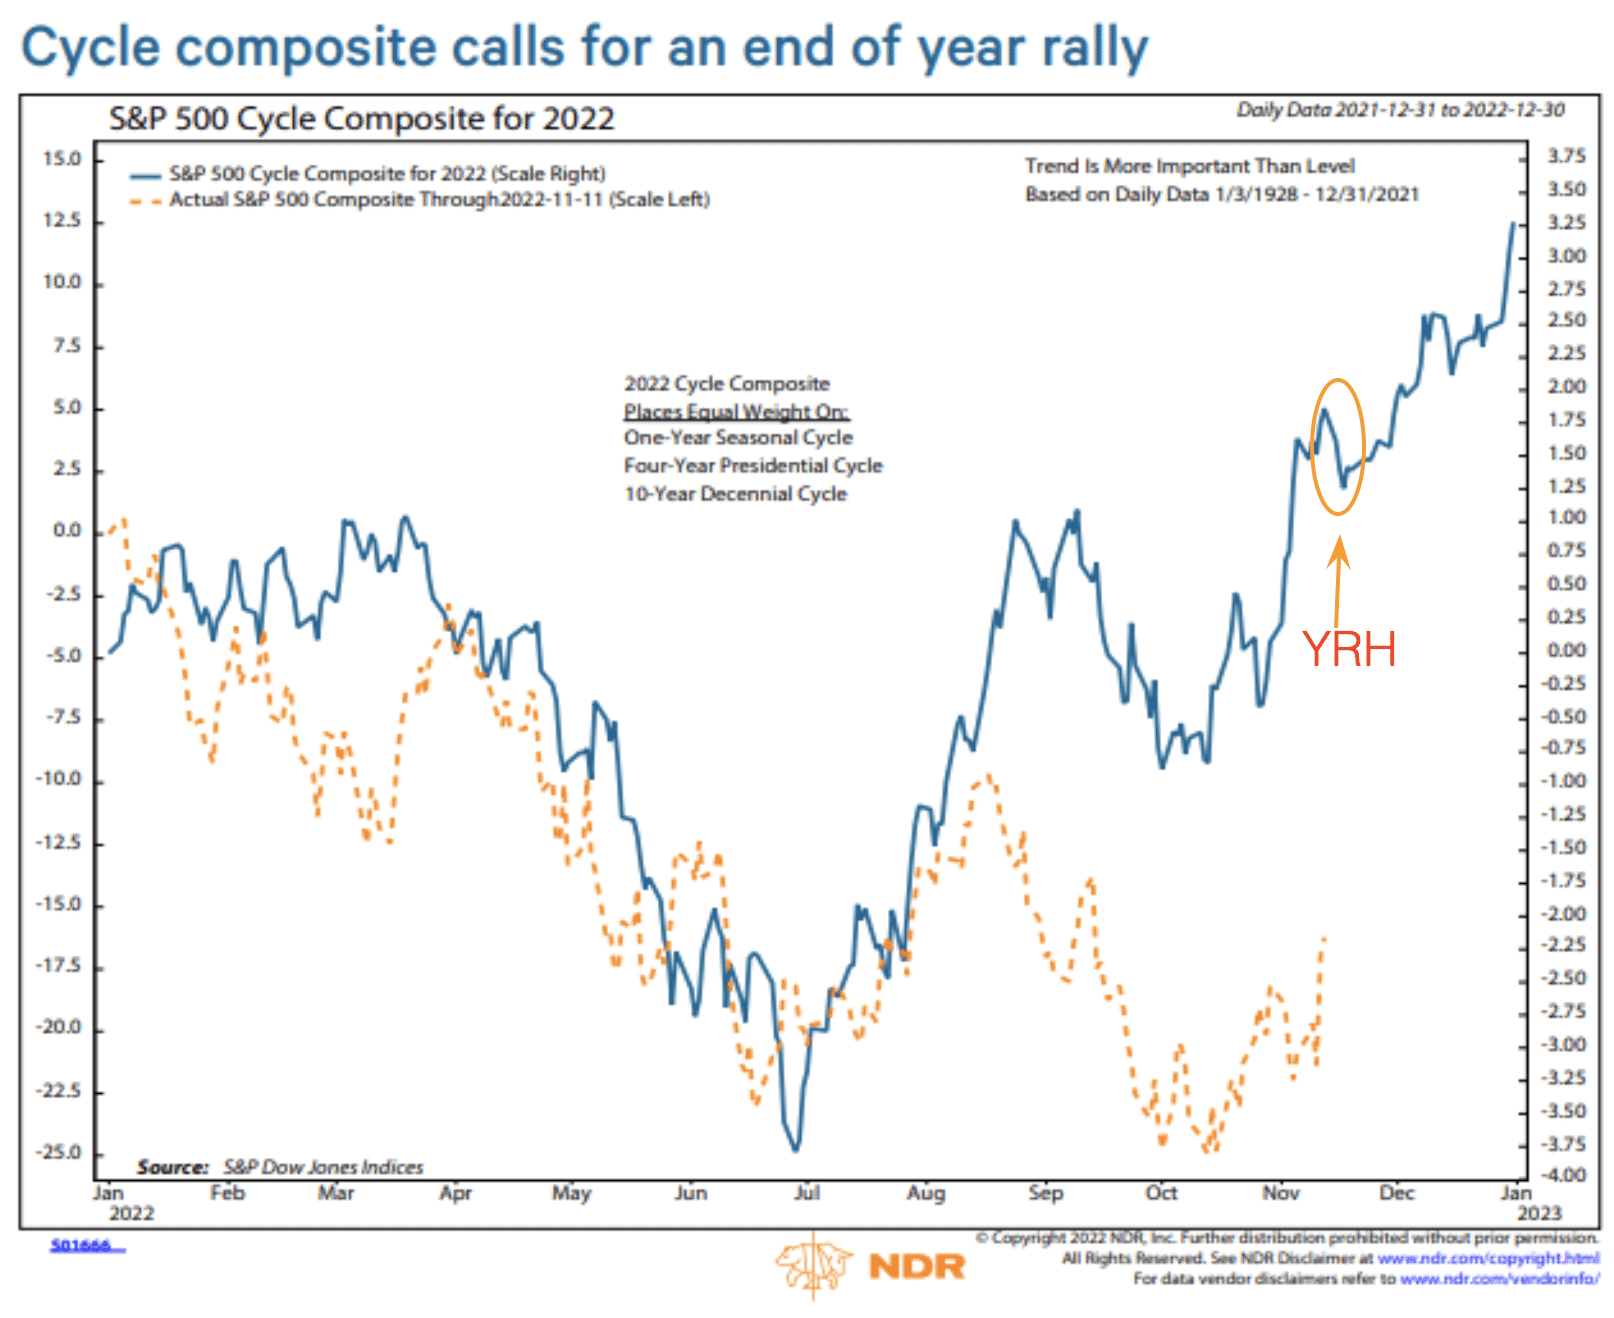
Despite all the unique sets of circumstances found in 2022, all the headwinds and unprecedented conditions, the Ned Davis Research S&P 500 Cycle Composite for 2022 has proven an extremely useful guide for price action. The path’s analogue has proven almost perfect, even if the price level faltered in August, which was a biproduct of Jerome Powell’s speech at Jackson Hole, Wyoming. Nonetheless, while the price has proven more imperfect, the path has been true and consistent through the majority of the analogue. For the Thanksgiving week and early, final trading week of November, this is about where we might see a pull back in price, as indicated in the chart analogue (You R Here (YRH)). Currently, the analogue is ahead by roughly 1 week when compared to 2022.
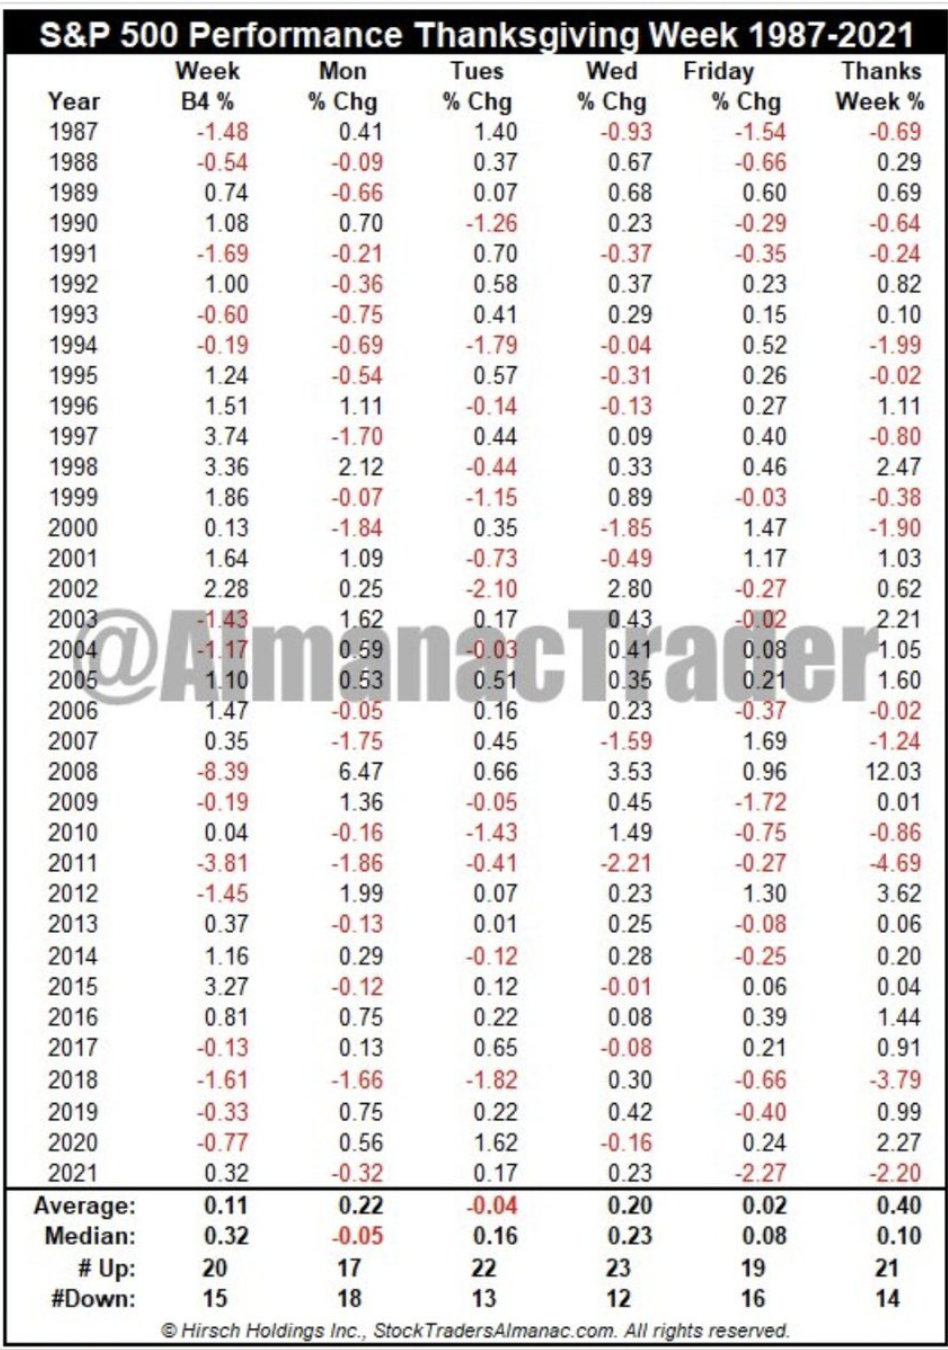
Thanksgiving week’s S&P 500 performance since 1987 is noted in the chart above from the Trader’s Almanac. Going back 35 years the positive weeks = 21 and the negative price return weeks = 14. The most positive day has proven to be Wednesday of the Thanksgiving trading week.
While it is possible that an S&P 500 bottom has been achieved for 2022, as there is not yet a recession, should a recession arrive in 2023, it would suggest THE BOTTOM for the bear market still lay ahead in 2023. Why? Historically speaking, S&P 500 bear markets with a recession find the S&P 500 bottoming during the recession and not before. The recession likely holds the key to the path forward. We don’t know if this time will prove different, given this bear market is the longest and deepest (28%) outside of a recession. What’s priced already? We suggest investors keep an open mind, especially considering how wrong Wall Street forecasts tend to be, historically speaking of course. It often proves to sound smart considering the downside risk ahead, but is more often chided to consider the upside risks, even though the upside risk are realized more often than the downside risk. Markets have a funny way of making the Wall Street “pros” look foolish?
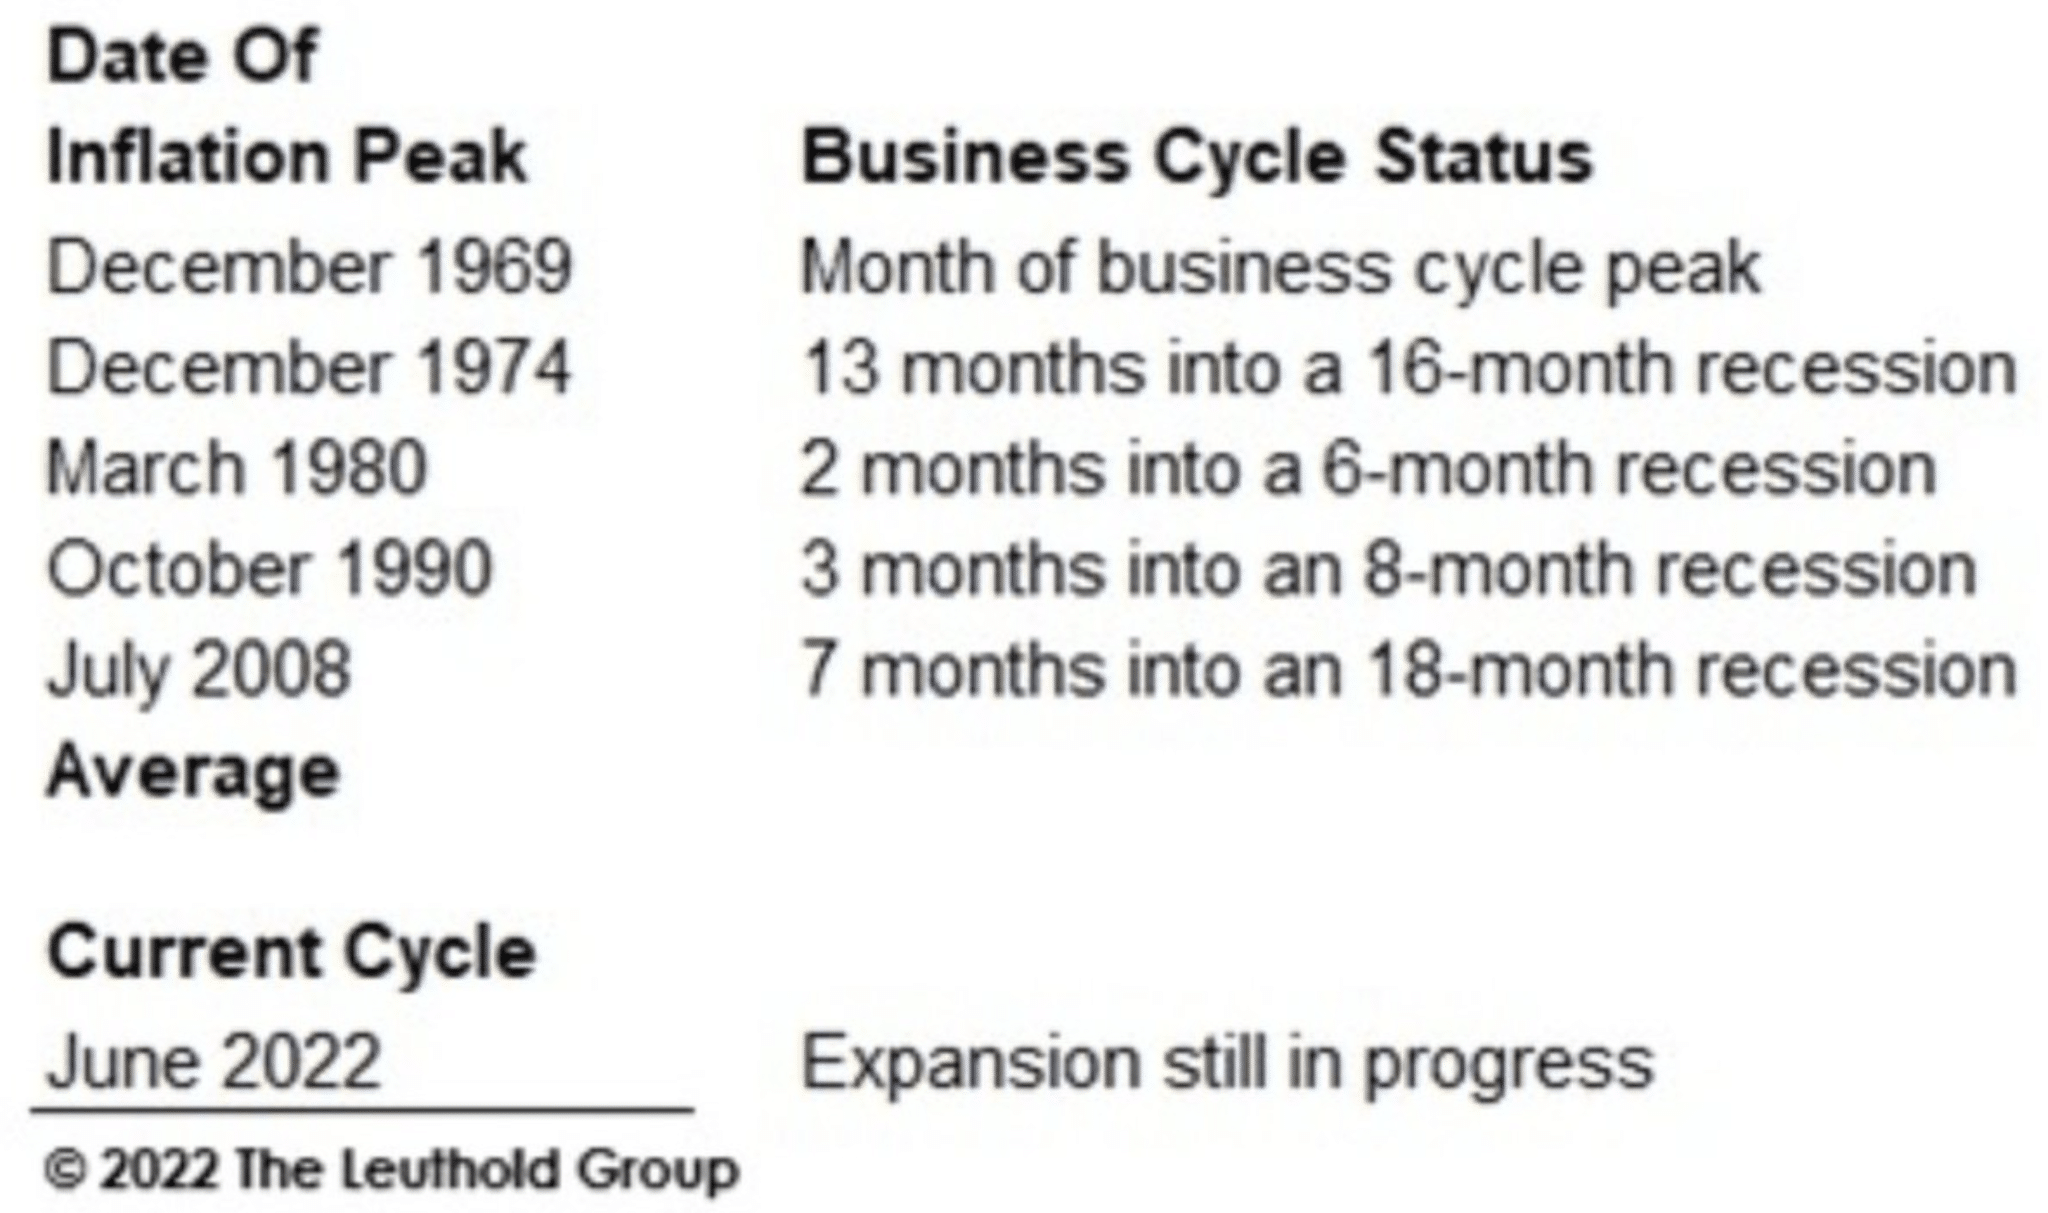
As offered at the onset of this macro-market article publication, a disinflation regime from an inflation peak above 8% has never occurred without the “help” of a recession… until 2022. The Leuthold Group data above outlines this unique development. It’s THE one thing about the current inflation regime that nobody, and I mean nobody is talking about. Something that eluded Ben Bernanke, Alan Greenspan, Paul Volcker, Arthur Burns, and William McChesney Martin: Engineering an inflation peak without the help of a recession. Another way of looking at the current macro-environment and creating an outlook is to recognize there is no playbook for today’s macr0 conditions. When in doubt and without precedence, Wall Street strategists and economists alike usually look down, not up.
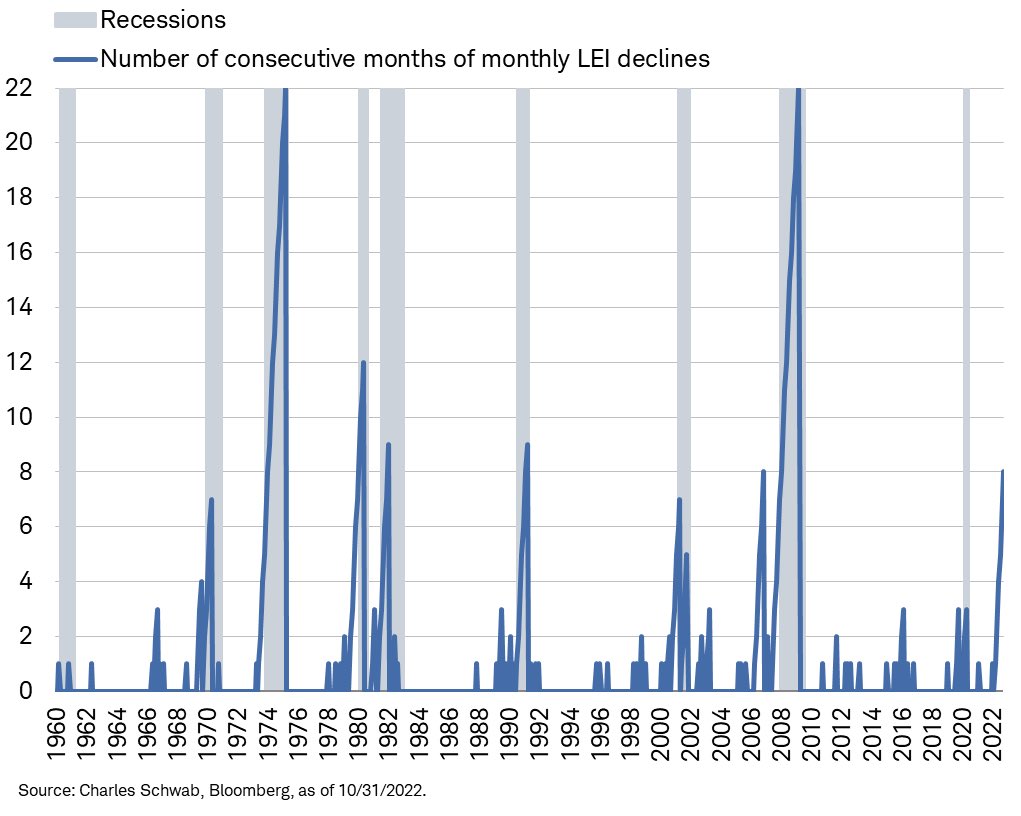
We now have 8 consecutive months of Leading Economic Index declines, which has only occurred one other time in the history of the LEI, 2006. It took nearly 2 years before such a losing streak in LEI found a recession. The YoY change in LEI as of October (-2.7%) is now worse than average at start of historical recessions (-2.2%), and yet a recession is not the current state of market affairs, it’s just not. Even so…
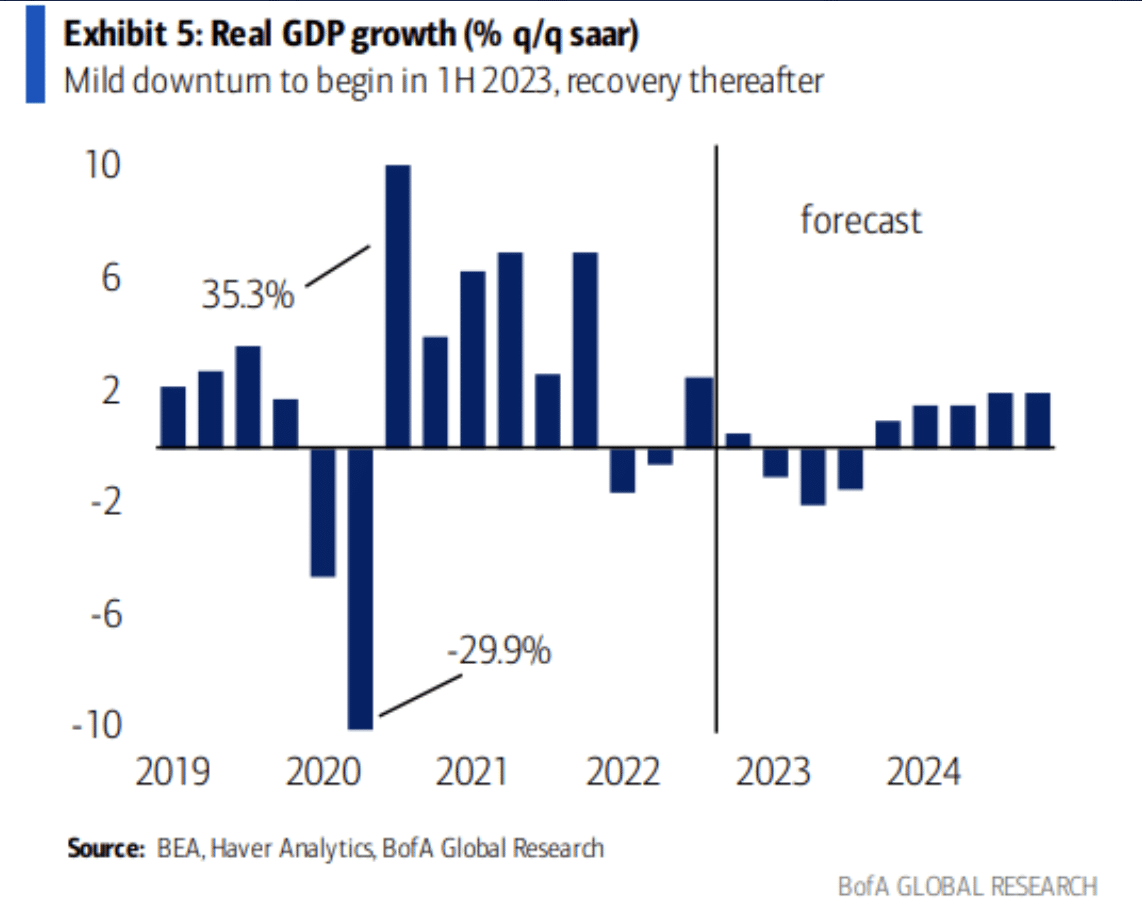
… Bank of America is projecting a recession in the first half of 2023. With the Fed hiking to 5.0-5.25% in their forecast, history suggests a soft landing is unlikely, as explained by the Bank of America team. Having said that, why is a mild, short, and shallow recession not categorized as a soft landing? After all, a short and shallow recession is not a 2008 Great Financial Crisis, now is it? That was a “hard landing!” And we’re not picking on Bank of America, most Wall Street firms are forecasting an “inevitable” recession, as they see it.

The chart above, from Goldman Sachs, outlines the 2023 firm’s GDP outlook juxtaposed with the consensus GDP outlook. The consensus outlook, indeed, outlines a Wall Street/consensus recession in the first half of 2023, while Goldman Sachs and a few other firms still see below trend GDP growth in the first half of the year, with an acceleration of growth through year-end 2023.
Goldman Sachs: “Most unusual recession, if even, would be quite mild in 2023.”
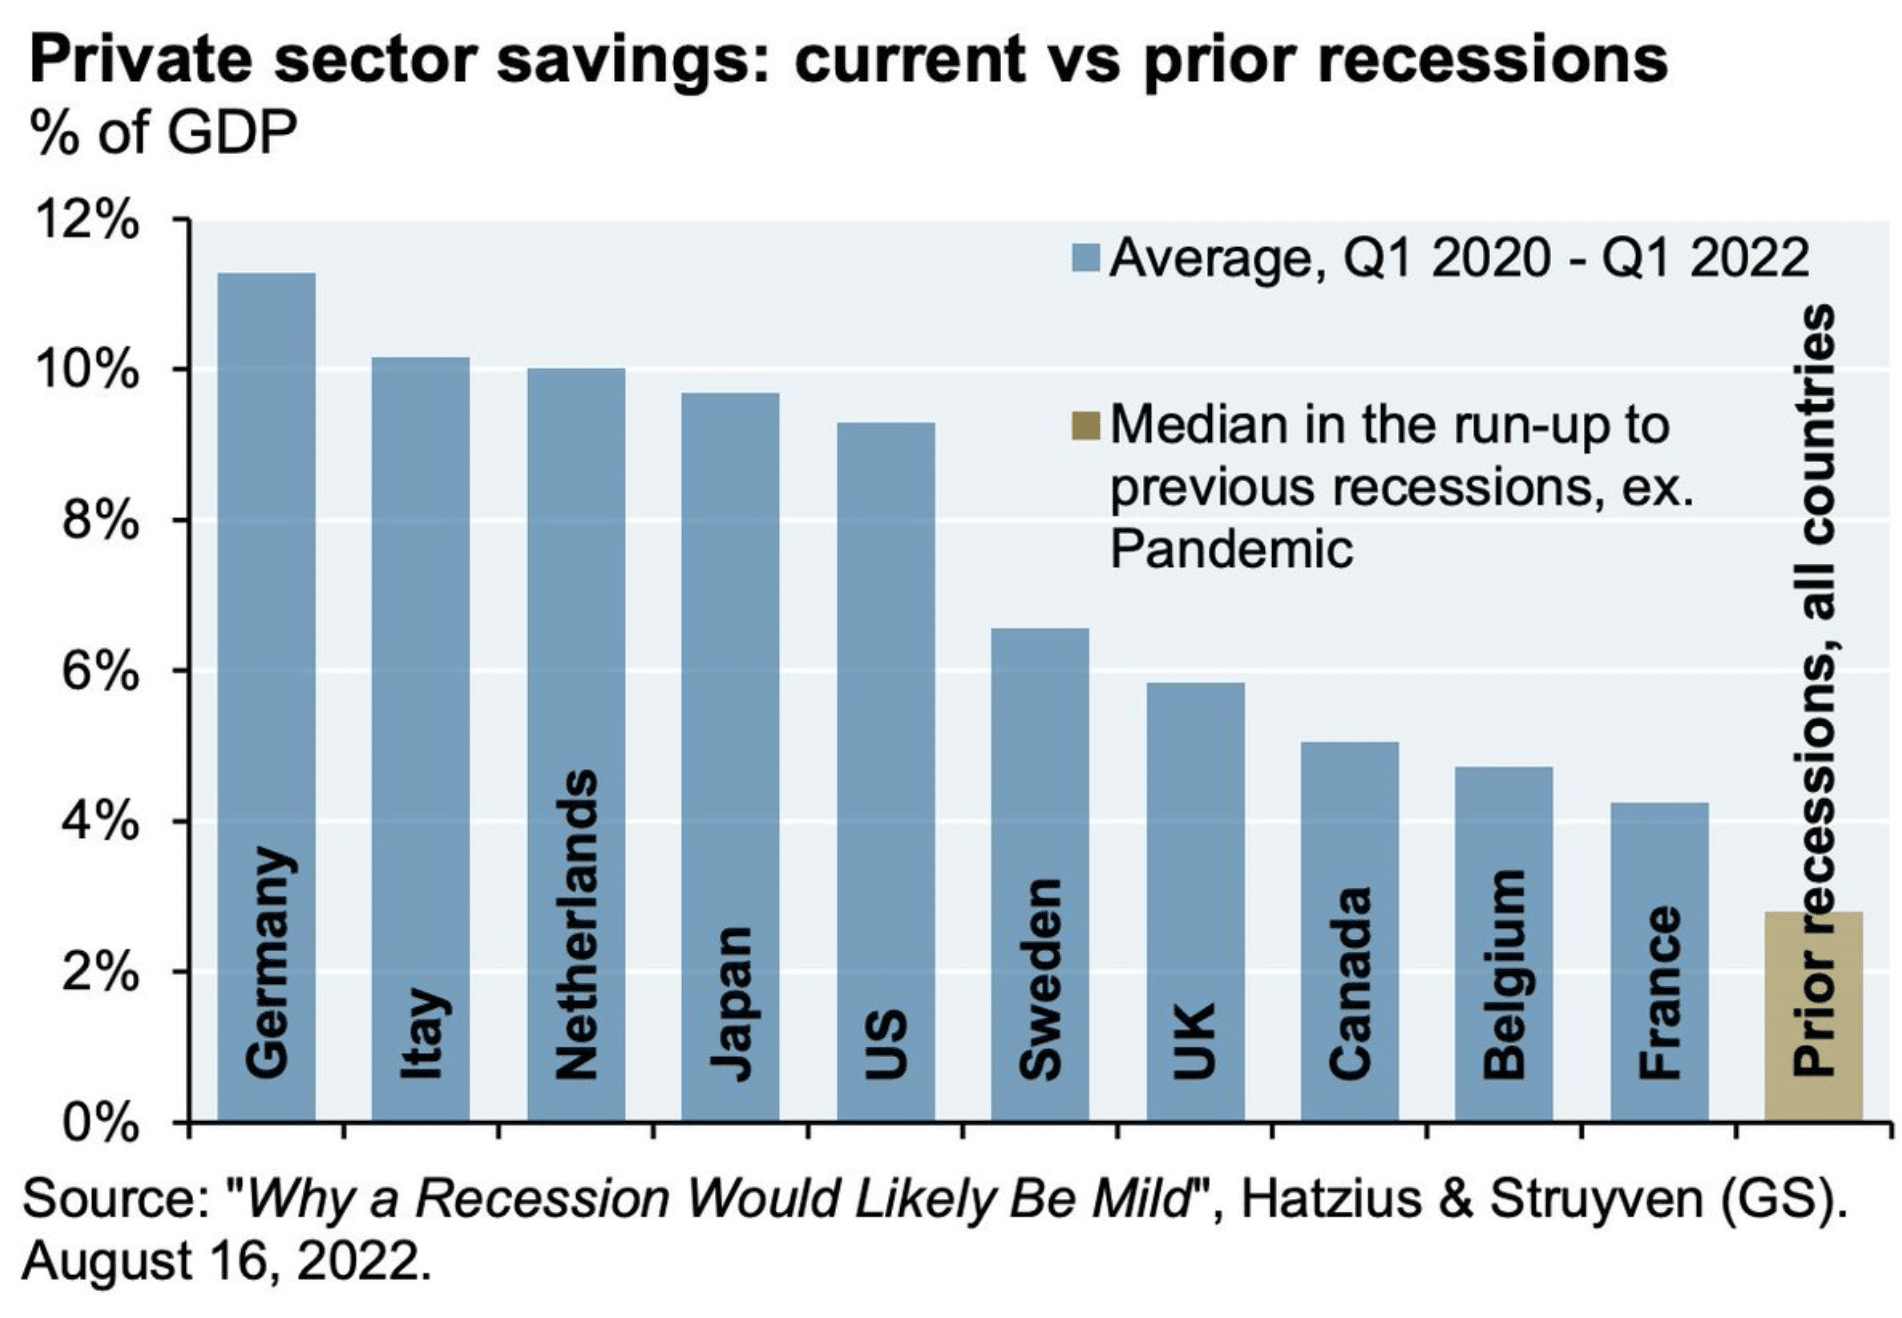
How can the views be so wide-ranging amongst the Wall Street pros? First, let’s use that word pro very loosely given Wall Streets infamous track record of errand outlooks for the economy and stock market. With that being said, let’s also consider the most extreme of financial balance sheet excess in history, excess savings. The excessive savings in the post pandemic era is unlike anything ever seen from past recessions, in the U.S. and around globe! Some countries have 4X and 5X the amount of excess savings when compared to past recessions, as shown in the chart above from Goldman Sachs. The U.S. economy has been suffering from a consistent downturn in housing, manufacturing PMIs, a disinflation process since June, and 8 straight months of declines in the Leading Economic Index, and yet, no recession. Excess savings is like an atom bomb to a recession. It’s clear that the most significant outlier that has buffered the economy through the current expansion cycle is the Household excess savings, only further supported by the healthiest corporate balance sheets in decades.
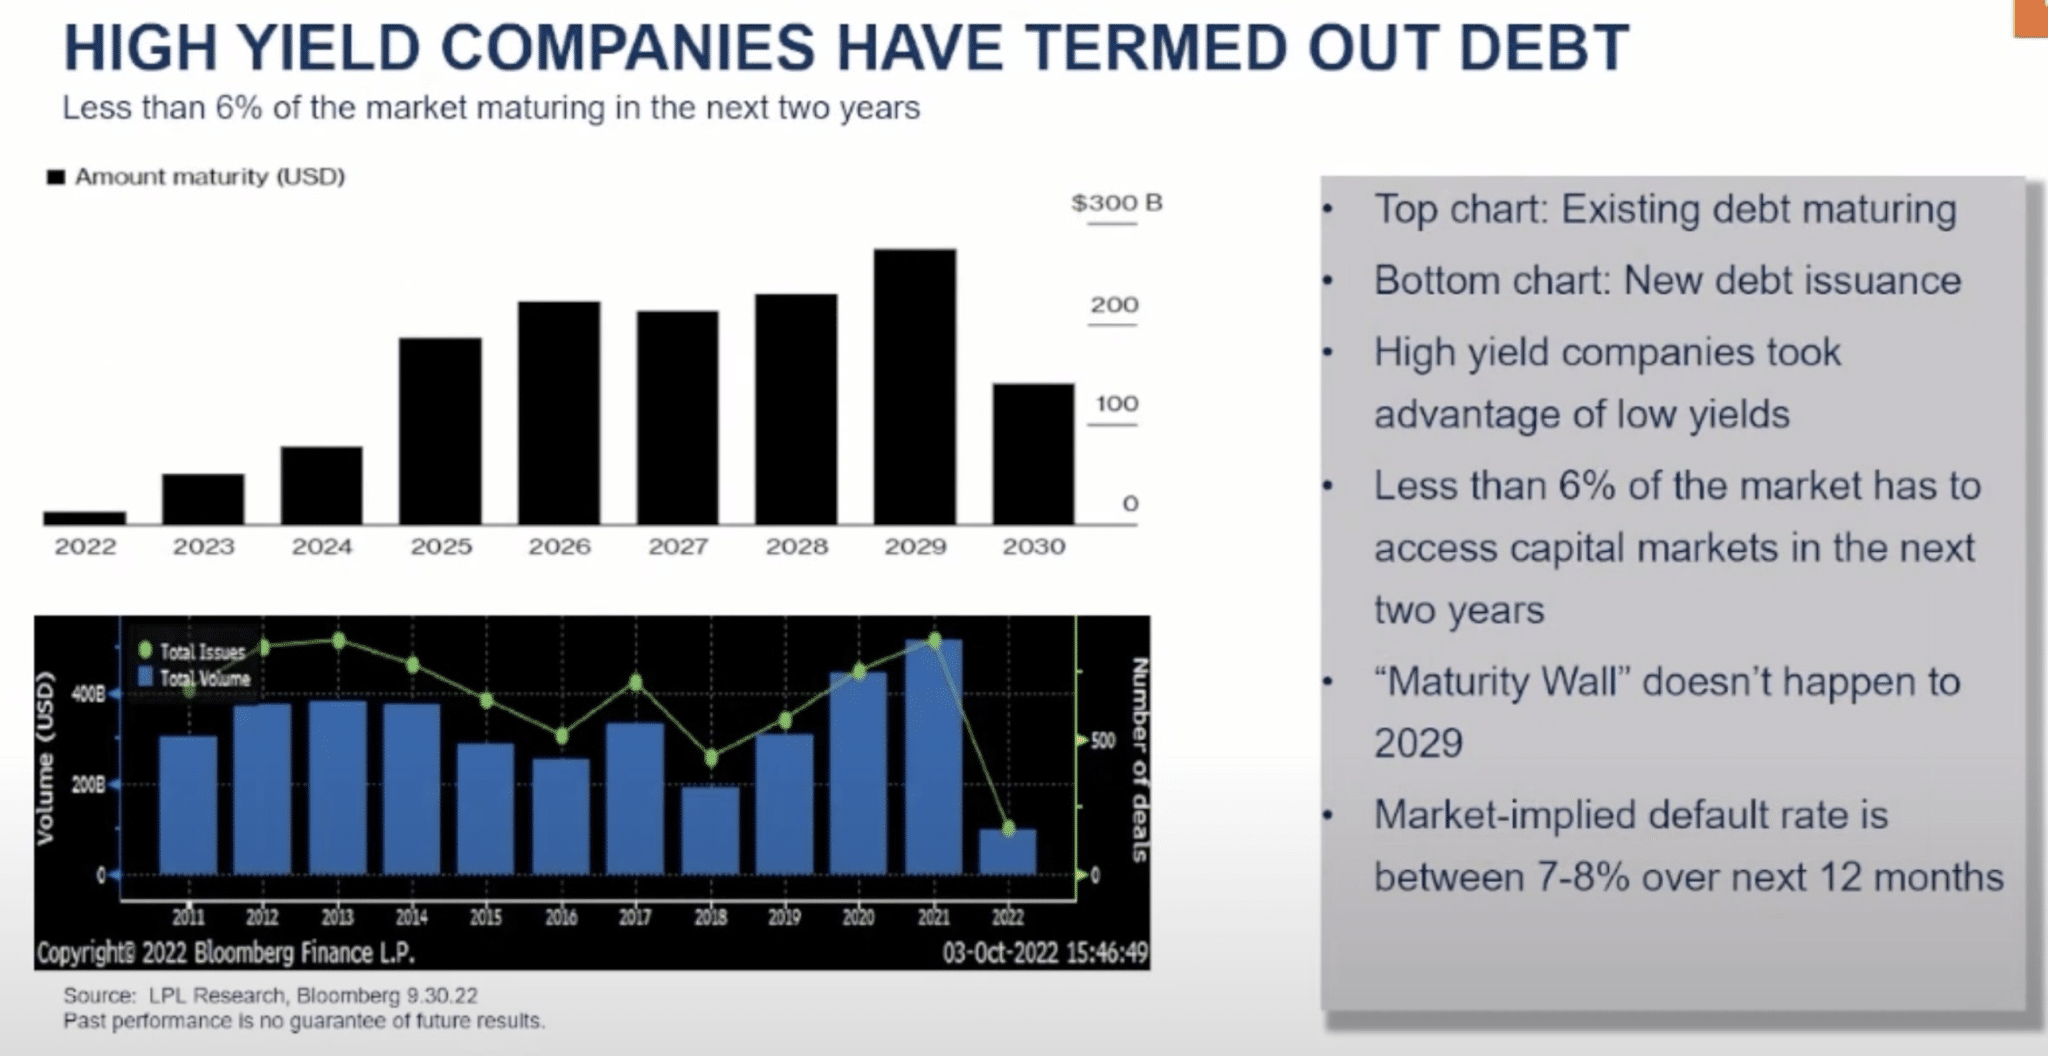
The question we are most often asked at Finom Group, with respect to corporate balance sheets and credit spreads that often reflect the health of corporate debt holdings is, “Why did Credit Spreads widen in 2022, to the highest levels since 2011 if corporate debt is so healthy?” In our opinion, muscle memory. A threat of a looming recession and rates rising more rapidly than since the 1980s, and investors do what they always do; they overreact and lean in favor of recency bias. Even so, the data presented in the charts above from LPL Research clearly and factually represents that not even 6% of the market debt maturities HAS TO access capital markets over the next 2 years. If you could model ZERO default risk, this would be it, and yet… credit spreads widened significantly through June. Everyone knew calamity was pending; everyone was wrong. Everyone knows a “hard landing” is coming; everyone IS… we’ll just have to wait and see.
J.P.Morgan Chase & Co. put the hoard of excess savings at about $1.2 to $1.8 trillion in the third quarter, and said it could be entirely spent by the second half of next year. Goldman Sachs economists estimate households have drawn down about 25% of excess savings and will have spent about 60% by the end of 2023. “The growth boost from strong balance sheets is probably mostly behind us but … elevated wealth levels will provide a backstop to spending for households that are hit with a negative economic shock,” they wrote this past week.
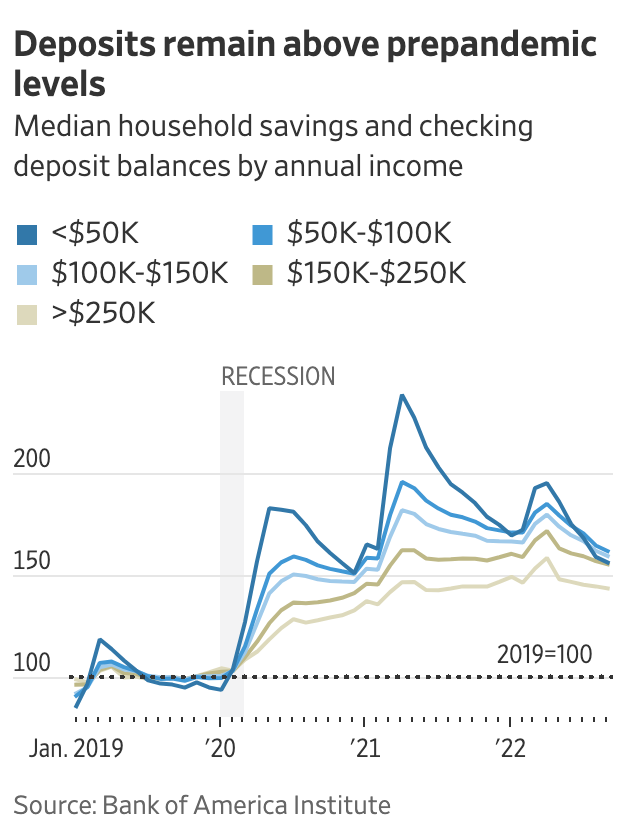
Analysts say a feature of this holiday spending season will be the divide between high-income households that still have savings and low-income households that have spent most of their rainy-day funds and are being squeezed by food, gasoline, and shelter inflation. Economists at the Federal Reserve last month said households in the top half of the income distribution held the lion’s share of excess savings in mid-2022 at $1.35 trillion, and the lower half of the income distribution held about $350 billion.
It’s been one heck of a year for market participants, where the only true shelter from the market storm has been commodities and the U.S. Dollar, but even the commodities “boom” 💥 has begged of investors’ hopium for a sustainable boom that has not materialized, by and large. The typical 60/40 portfolio is having one of its 3 worst years in history, but this is also historically a good sign of positive market performances hence forth.
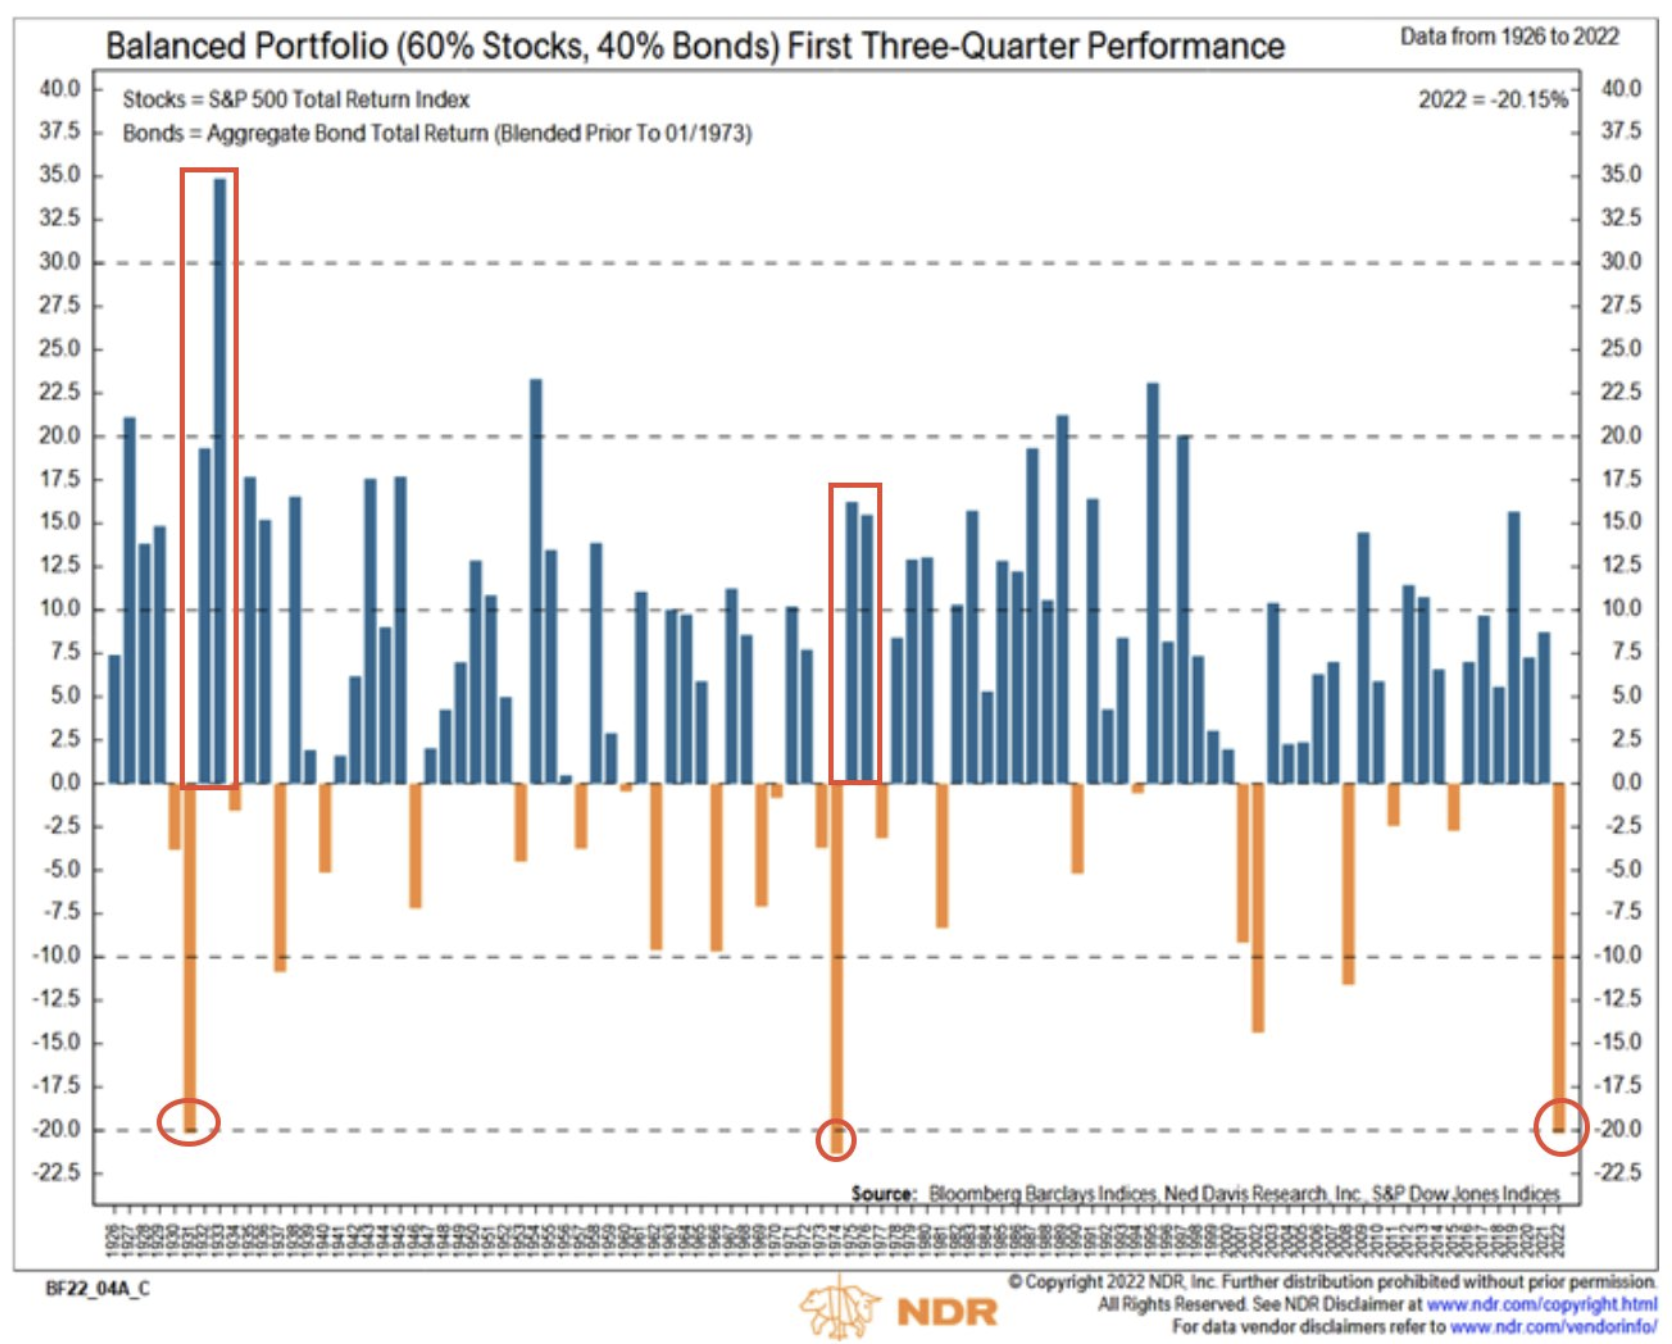
This is typically what you call “it’s so bad, it’s actually good.” Historically, when 60/40 portfolio has fallen 20% or more, good things happen the following 2-years. “Take advantage man, take advantage!” (Chris Tucker)
The near-term outlook (early 2023) may prove daunting, begging of the savvy investor to remain disciplined, open to the possibility of a mild, short, and shallow recession that demands the market to price in a deeper YoY EPS decline, which will usually happen quite rapidly and especially if the Fed hits the pause button ⏹!
Morover and considering a Fed pause in early 2023 (consistent with our outlook), the bond market volatility would subside, inflation gives way to cementing disinflation, liquidity improves dramatically, and without a cowbell like signal.
(See notes below from previous Finom Group macro-research report)
“Today’s questions are: When will the Fed ultimately stop raising interest rates? But a more important issue shaping the future character of the economy and financial market performance is: When will liquidity growth pivot? Obviously, the 2 are not necessarily aligned. For example, in the post-pandemic recovery, real liquidity growth began to diminish long before the Fed started to hike the federal funds rate. Ergo, it is not necessarily hiking rates that changes/adjusts the liquidity levels.

The chart above illustrates the annual growth of real M2 money supply since 1960; prior to the pandemic, it rarely exceeded 10%, but it surged above 25% in February 2021. Nonetheless, that record gush quickly reversed; it was back below 10% by May 2021 and ended the year at just 5 percent. This year, it dropped below zero in April and is currently -5.6%, lower than 98.5% of the time since 1960.
In October 2018, real liquidity growth was near zero, and 16 months later, it was 25%. Fourteen months after that, it was back to zero and is now near record lows. Stock market performance has reflected that unprecedented liquidity volatility. The S&P 500 dropped almost 20% in late 2018, followed by over a two-fold gain by the end of 2021 (interrupted by a brief 34% pandemic-induced drop in March 2020) before again deteriorating about 25% this year. Remember, there is usually only 1 bear market but every 3.5 years and we’ve had 3 bear markets in the last 4 years. That’s the relevance of liqudity folks.” ~Leuthold Group
While in the face of Great Recession-type commentary, and financial media headlines plaguing the average investor, the savvy investor picks up the deepest of cyclical value. Be savvy and we’ll see you back here at Finom Group post-Thanksgiving. Gobble-gobble and Happy Holidays! 🦃


