Key takeaways
• Consumers have proven resilient in 2022. While they are likely to have a tougher time next year, especially if the labor market deteriorates, they are starting 2023 in decent financial shape. Deposit balances are coming down, but slowly, and credit card usage does not currently look out of line with pre-pandemic levels.
• After a slow start compared to 2021, holiday shopping picked up toward the end of November. Nonetheless, overall retail spending across November looks soft (down 0.3% month-over-month (MoM), up 0.2% year-over-year (YoY)), and total spending continues to be supported by spending on services rather than goods.
• The growth in buy now, pay later (BNPL) indicates that some holiday spending may be spread over the coming months, meaning we may need to wait longer for a clear picture. Indeed, we find some evidence that BNPL actually leads to higher overall spending, especially for those with incomes below $50k.
Consumers looking good, for now
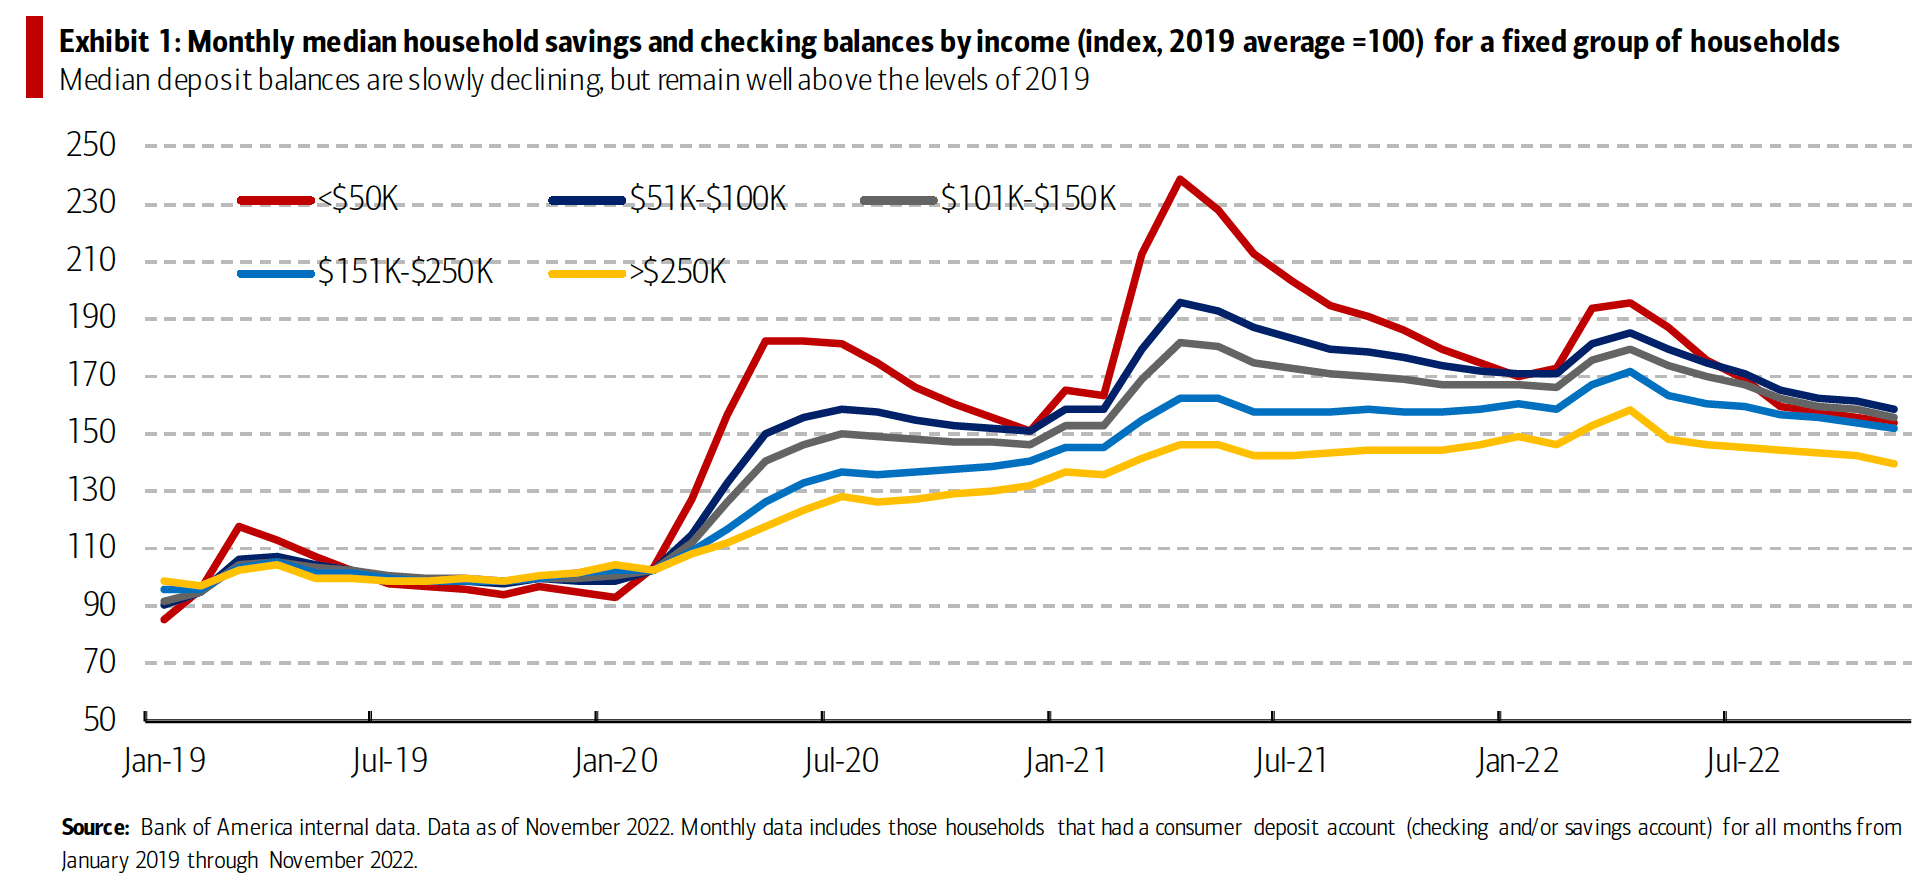
Before consumers start 2023 they may want to check their financial waistlines. Overall, we think they remain in good shape. As we have noted previously, median household savings and checking balances remain well above pre-pandemic 2019 levels across all income cohorts (Exhibit 1), according to Bank of America internal data. There have been increasing signs that these ‘buffers’ are being drawn upon, which is understandable given high inflation and rising housing costs (especially for renters). Lower income and younger households are dipping into their reserves the fastest, but even for these groups buffers remain, some way above their pre-pandemic levels (+50% relative to 2019 levels for <$50k), which we think suggests that they should be available for some time.
Another useful check is how reliant people are becoming on credit cards to support their spending. The evidence looks reassuring here, too. For lower-income cohorts the ratio of credit card to debit card spending in November was the same as in November 2019. In fact, only the higher income household group (above $100K) has seen a rise in credit card usage relative to debit cards above the November 2019 level, though this is likely a function of increased spending instead of accumulation of credit card debt for the higher income group.
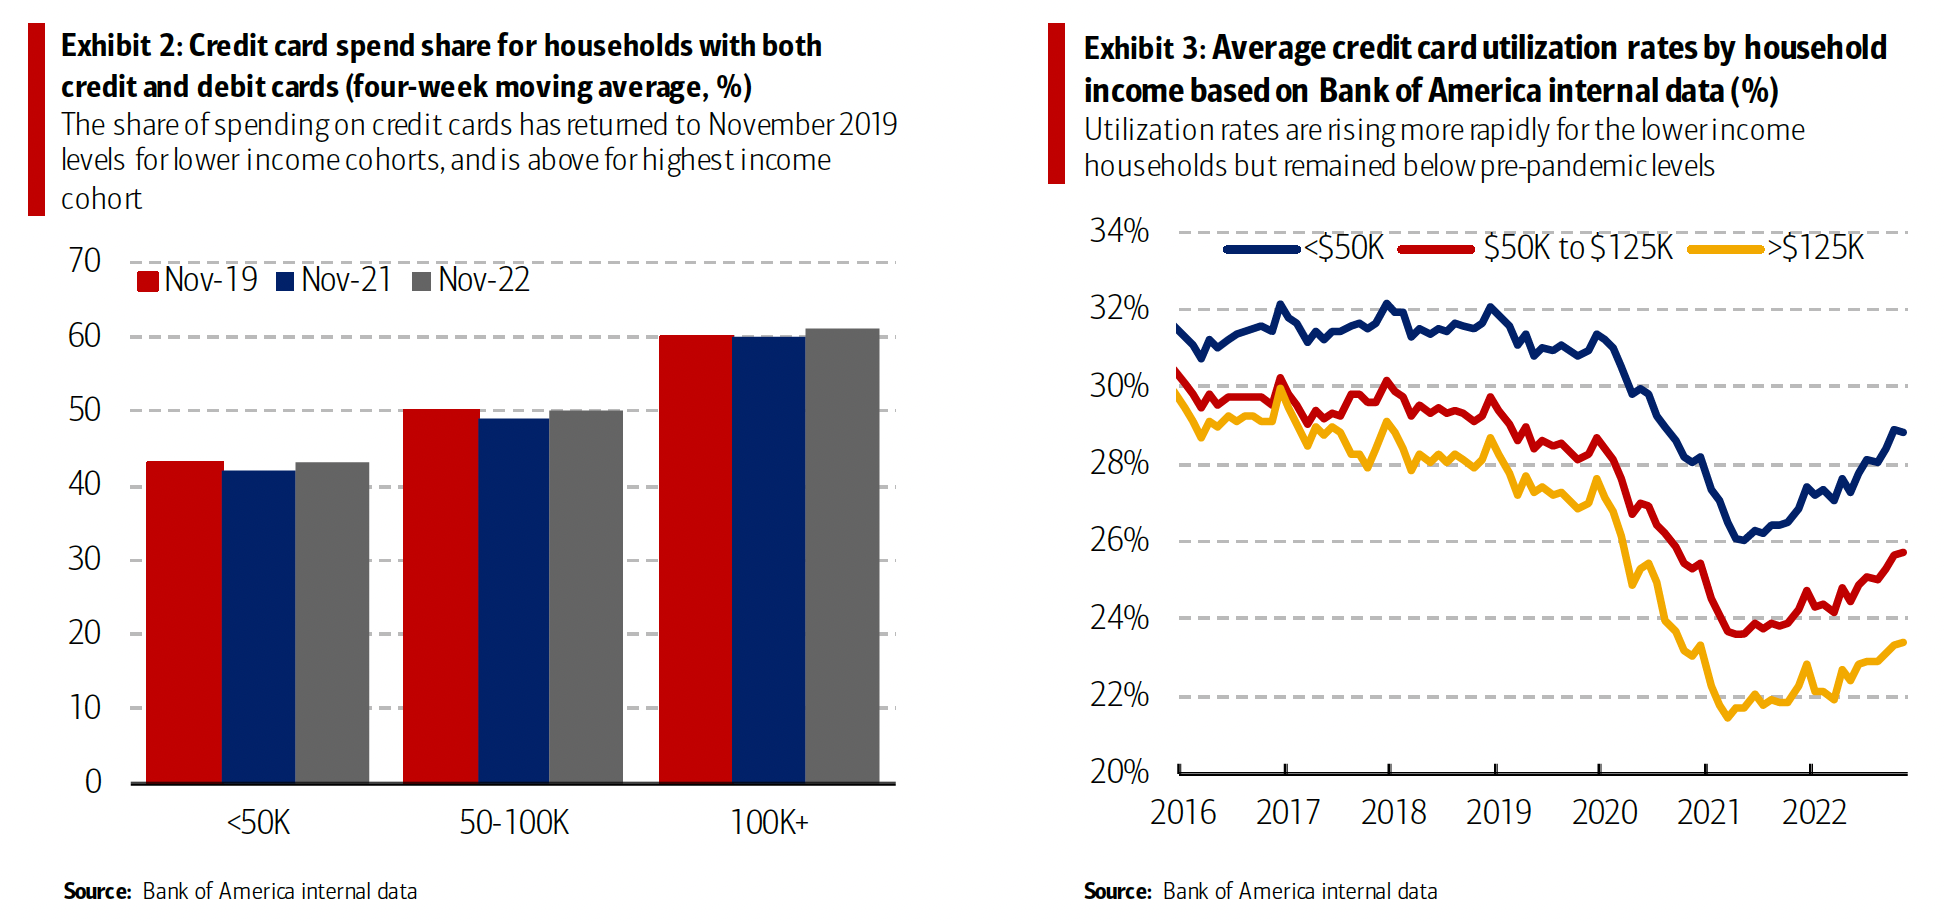
Households do not appear to be increasing their credit card utilization rates (the % of their limits they run up to) at a fast rate either. There are some signs of a rise in lower income utilization, but currently this appears to be at a gradual pace and remains below 2019 levels (Exhibit 3).
A key factor driving the health of the US consumer in 2022 has been the underlying labor market. The US economy delivered continued strong jobs growth and solid pay increases for many. On top of this, savings buffers have provided additional support and reassurance. Wall Street economists generally expect a tougher year in 2023, with the labor market slowing, unemployment rising and some slowdown in wage growth. But for now, at least, the latest data we have continues to blow a tailwind into the sails of the consumer.
Don’t buy it, live it
With Thanksgiving holiday shopping behind us, we have a bit more information on how this season is stacking up. The overall story looks okay – while retail spending is relatively weak, with retail spending per household down 0.3% MoM seasonally adjusted in November, ‘experiences’ are continuing to fare better.
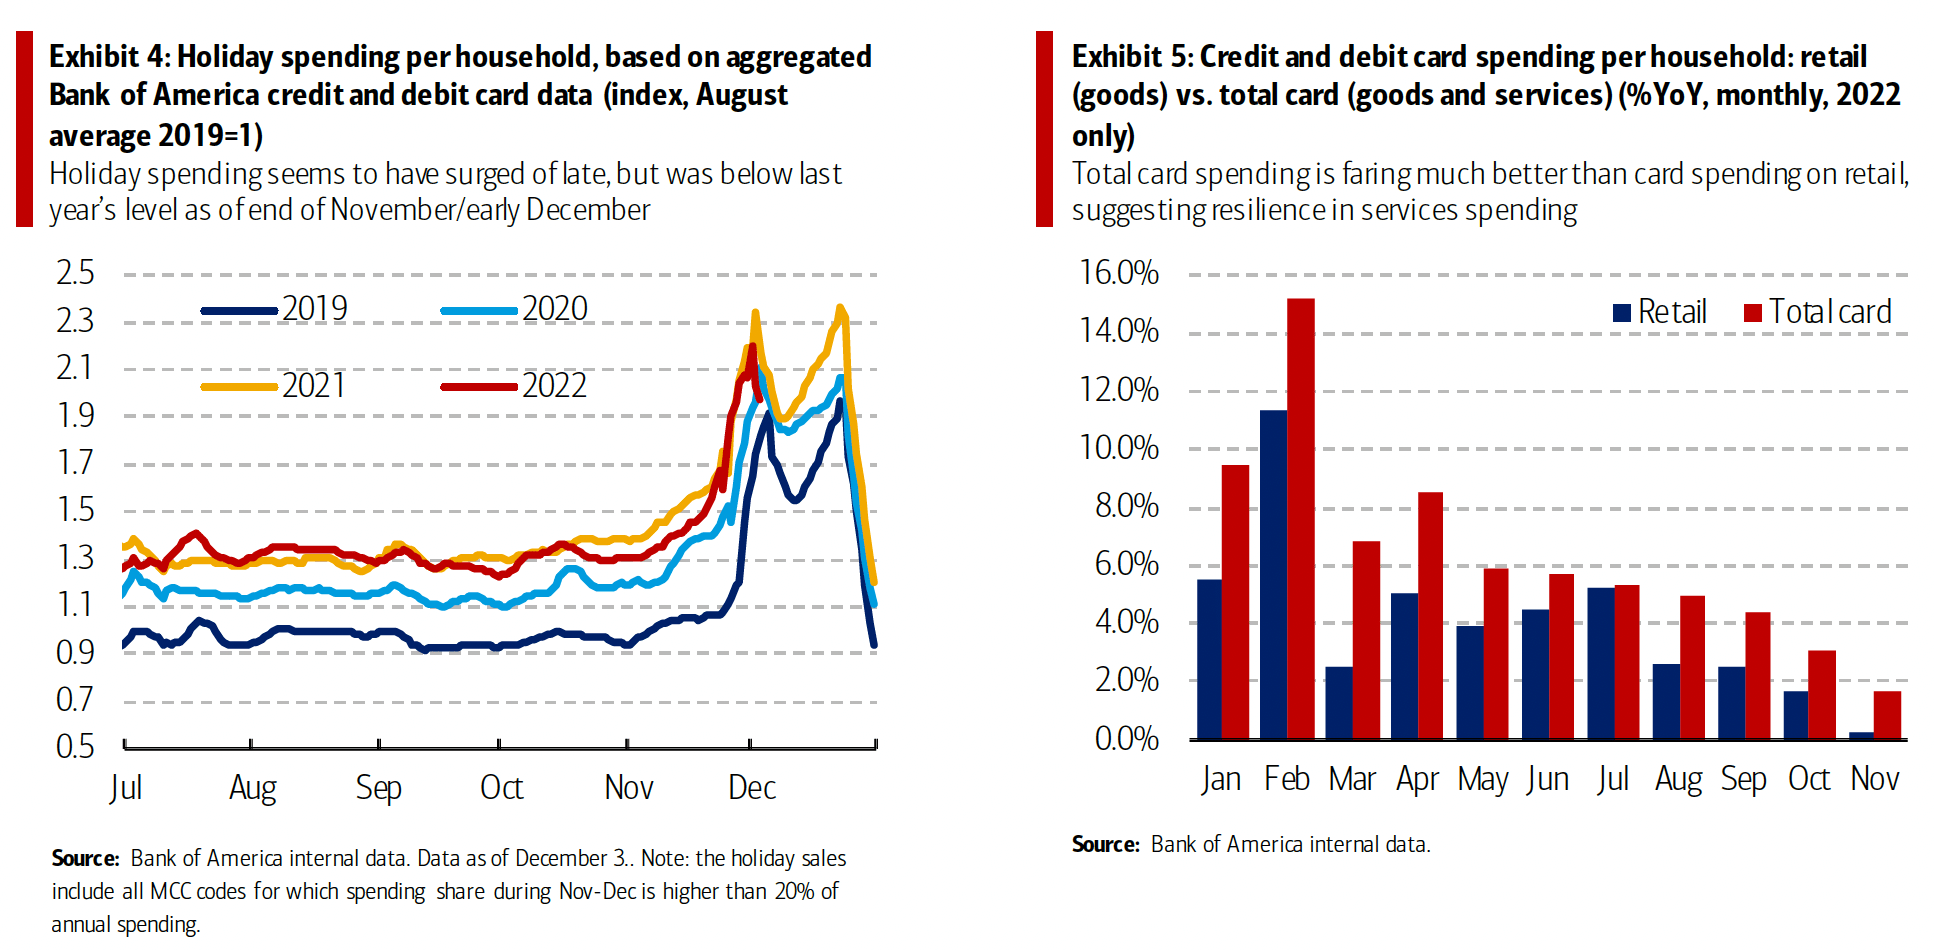
The holiday tracker looks at a basket of goods where at least 20% of annual spending happens in November and December. This year’s data has been lagging behind the 2021 holiday spend for most of November, though this is a tough comparison given that last year people were spending early to try to beat inventory shortages. However, the good news is that the in the latest data over Thanksgiving weekend shopping appears to have accelerated, but the peak of spending around Black Friday and Cyber Monday failed to reach last year’s levels (Exhibit 4).
If we broaden out to look at overall spending, including retail and services, across November we see continued weakening. Total credit and debit card spending per household was up just 1.7% YoY, slowing further from 3.1% in the prior month. On a seasonally adjusted (SA) basis, total card spending per household increased by 0.1% MoM.
As Exhibit 5 shows, retail spending (goods) was much weaker than the total card spending growth, suggesting resilience in services spending. For example, online electronics spending per household was particularly weak in November, while lodging spending per household was up 0.9% MoM SA.
Of course, with consumer price inflation in October rising by 7.7% YoY, even total card spending is struggling to keep up with inflation – though the exact impact on individual households may depend on their ability to trade down in areas such as grocery (see ‘Supermarket swap’). Also, if households were able to make good use of aggressive Black Friday retail promotions, they may have been able to make their budgets go further: total number of credit and debit card transactions were up 2% in November, despite the nominal value only rising 4%. This suggests consumers may be having some success in making their budgets go further.
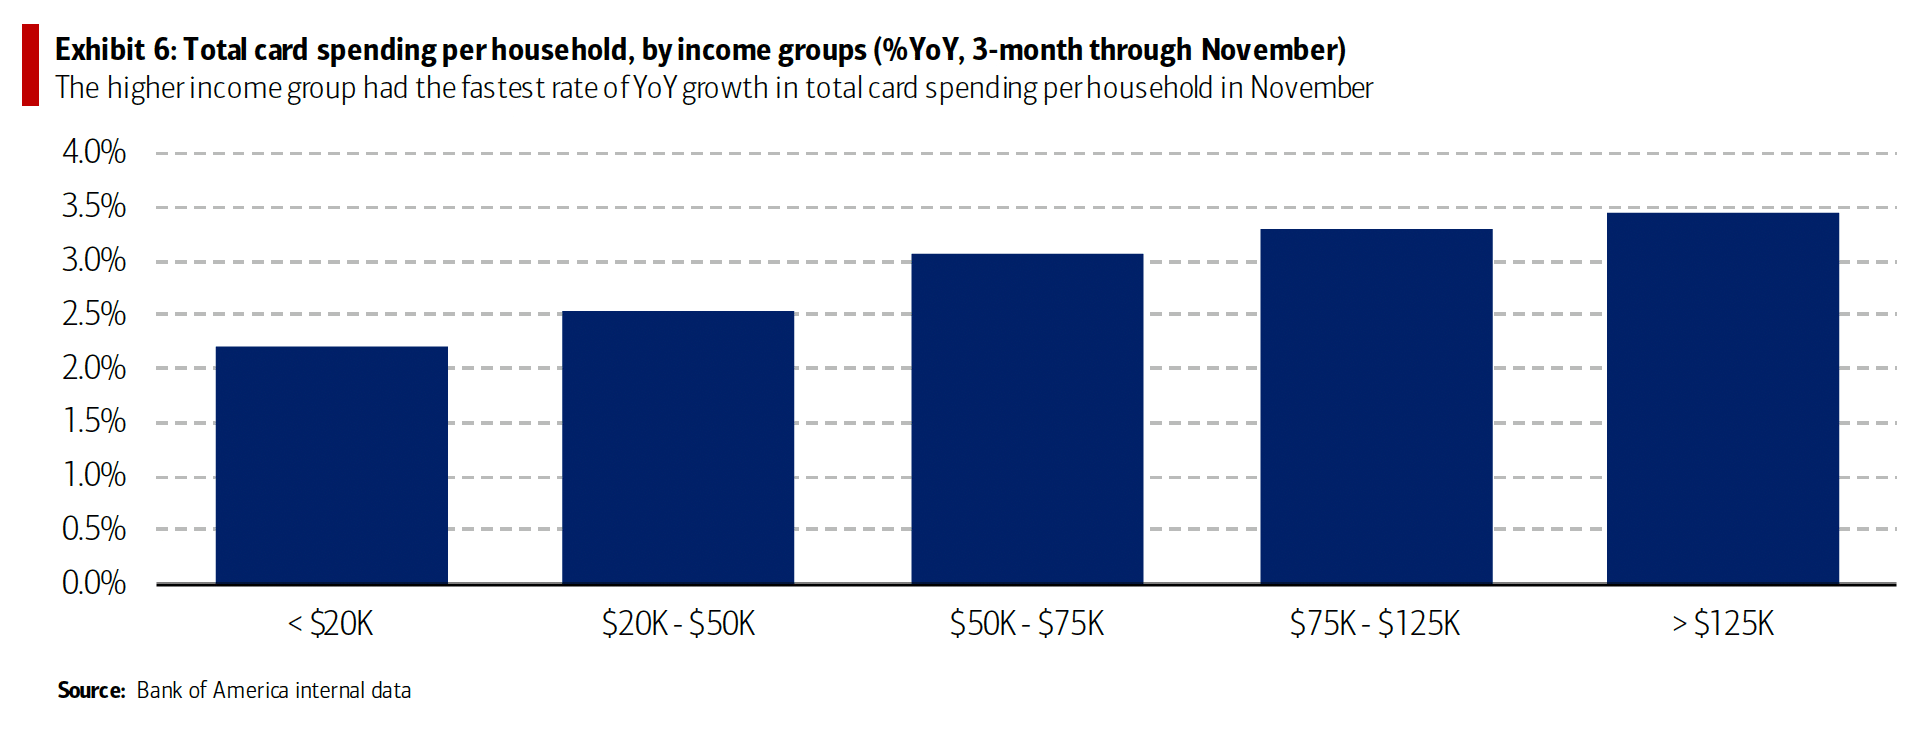
Looking across income cohorts, spending growth for the lower income households has lagged that of higher income households over 2022 generally and this was again the case in November (Exhibit 6). The higher weight of services spending in higher income baskets is the main reason here, along with the fading impact of stimulus. However, the labor market has remained a bright spot for lower-income households, with those at the lowest end of the wage distribution showing the highest pace of wage growth.
New way to pay: buy now, pay later
A complicating impact on spending is the role of buy now, pay later (BNPL), which refers to a form of credit provided by BNPL companies that allows consumers to make purchases, usually online, in installments. The most common model is “pay-in-four,” where consumers pay 25% of the transaction value (usually for purchase values between $50 and $200) at point of sale, with three subsequent 25% repayments every two weeks after that with no interest. Under the “pay-in-four” model, retail merchants usually pay a fee to BNPL companies that is proportional to the order value.
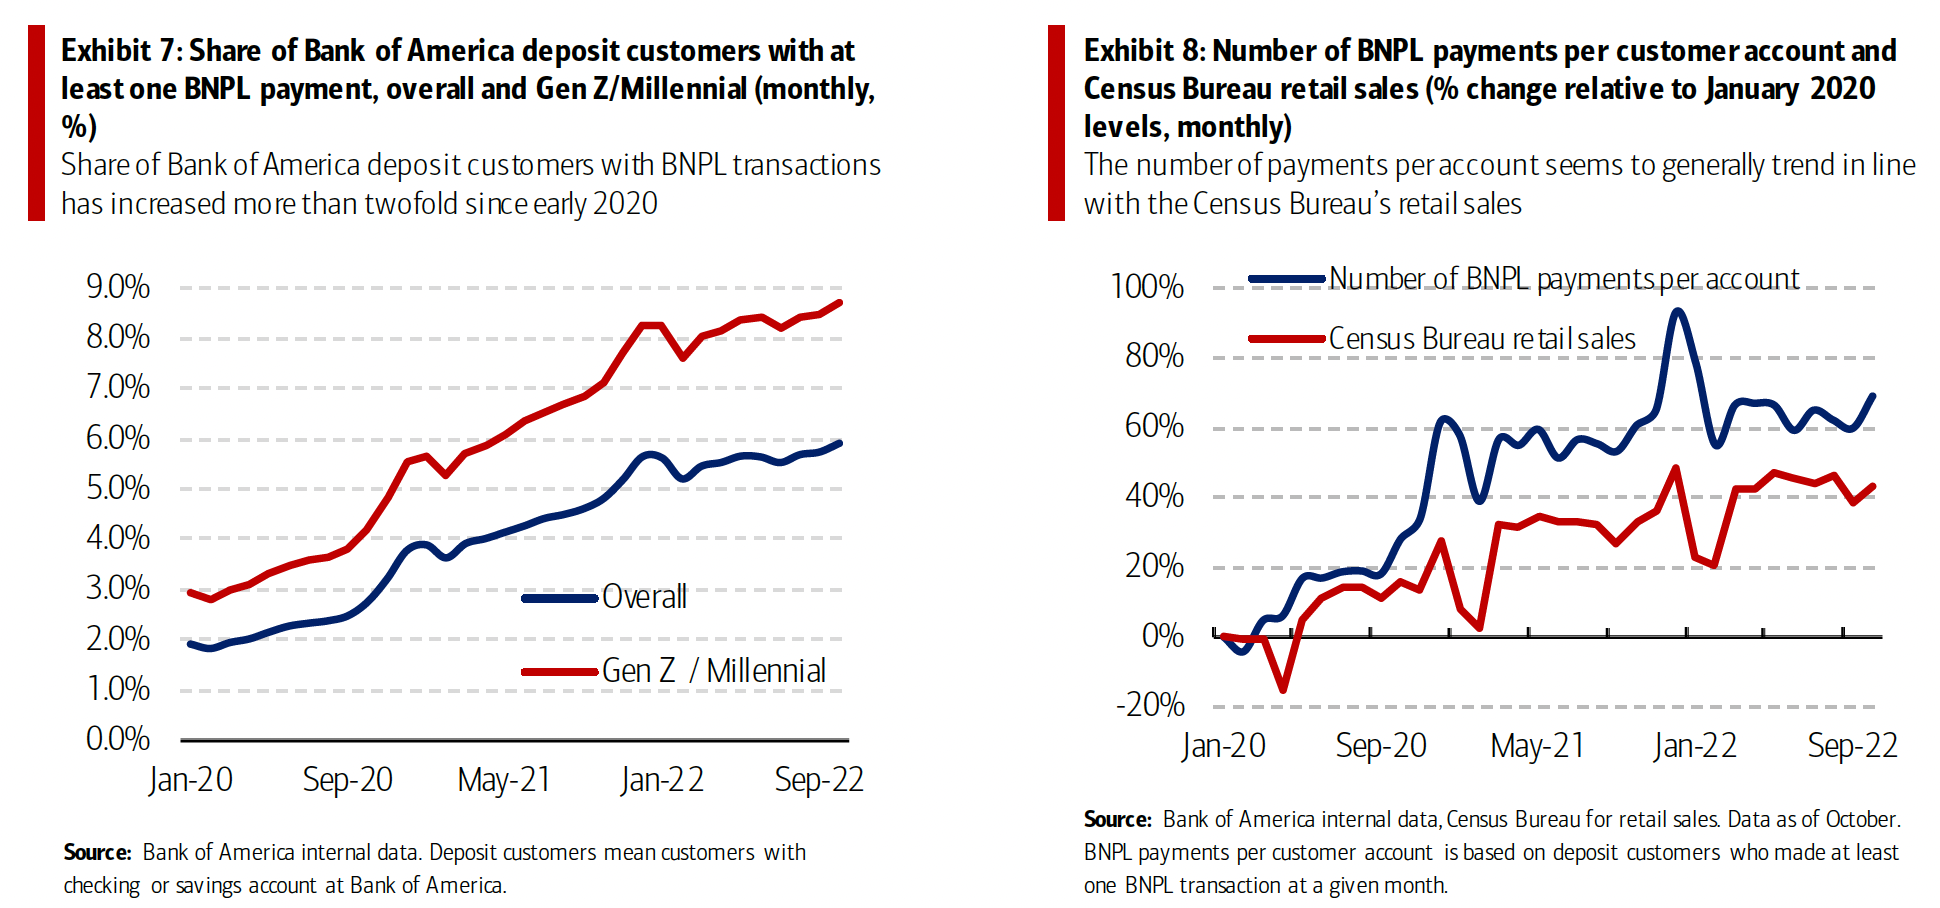
Bank of America internal data shows a pronounced rise in BNPL usage over the last few years. In October, card payments to BNPL companies (mostly through debit cards) accounted for around 2% of total online card spending volume (card not present). Although still a very small share, this marks a sharp increase from the annual average of 0.3% in 2019. The number of people using BNPL is also broadening. In other words, it’s not just a few people using it a lot. Among all Bank of America deposit customers, around 6% made at least one BNPL payment in October 2022, up threefold since the beginning of 2020. Younger generations seem to favor BNPL more: the share of users among Gen Z and Millennial customers is even higher, at nearly 9% in October 2022 (Exhibit 7).
An increasing use of BNPL means that consumer spending may end up spreading over a longer period – implying we may need to wait longer for clarity on how this holiday season pans out. But interestingly, we find that increased BNPL usage could actually lead to higher overall spending. Looking at households with an annual income of less than $50k, we find that combined credit and debit card spending per household for those with six or more monthly BNPL purchases was up 35% in September compared to the level in January 2020. For households that didn’t use BNPL over this period, spending was up 28%.
Monthly data update
Overall total credit and debit card spend, which makes up over 20% of total payments, was up 4% YoY in November, as total payments growth across all channels (ACH, Bill Pay, Credit and Debit Card, Wires, Person-to-Person, Cash and Check) increased 4% YoY.
Meanwhile, YoY growth in card spending per household, which measures average spending for Bank of America customer households, declined to 1.7% in November, from 3.1% YoY in October. This was the seventh month of moderation on a %YoY basis. Similarly, real spending continues to be under pressure from high CPI inflation (7.7% YoY in October) and Personal Consumption Expenditure (PCE) inflation (6.0% YoY in October).
The differences between the overall total credit and debit card spend and per household card spend growth rate can be explained by the following:
1. Overall total card spending growth is boosted partly by growth in the number of active cardholders in our sample. This could be due to an increasing customer base or inactive customers using their cards more frequently.
2. Per household card spending growth looks only at households that complete at least five transactions with Bank of America cards in the month in question. Per household spending growth isolates impacts from a changing sample size, which could be unrelated to underlying economic momentum, and potential spending volatility from less active users.
3. Overall total card spending includes small business card spending while per household card spending does not.
4. Differences can reflect using the processing date (total card spending) versus the transaction date (per household card spending).
5. Other differences include household formation due to young adults moving in and out of their parents’ houses during Covid (for more details, please see methodology).
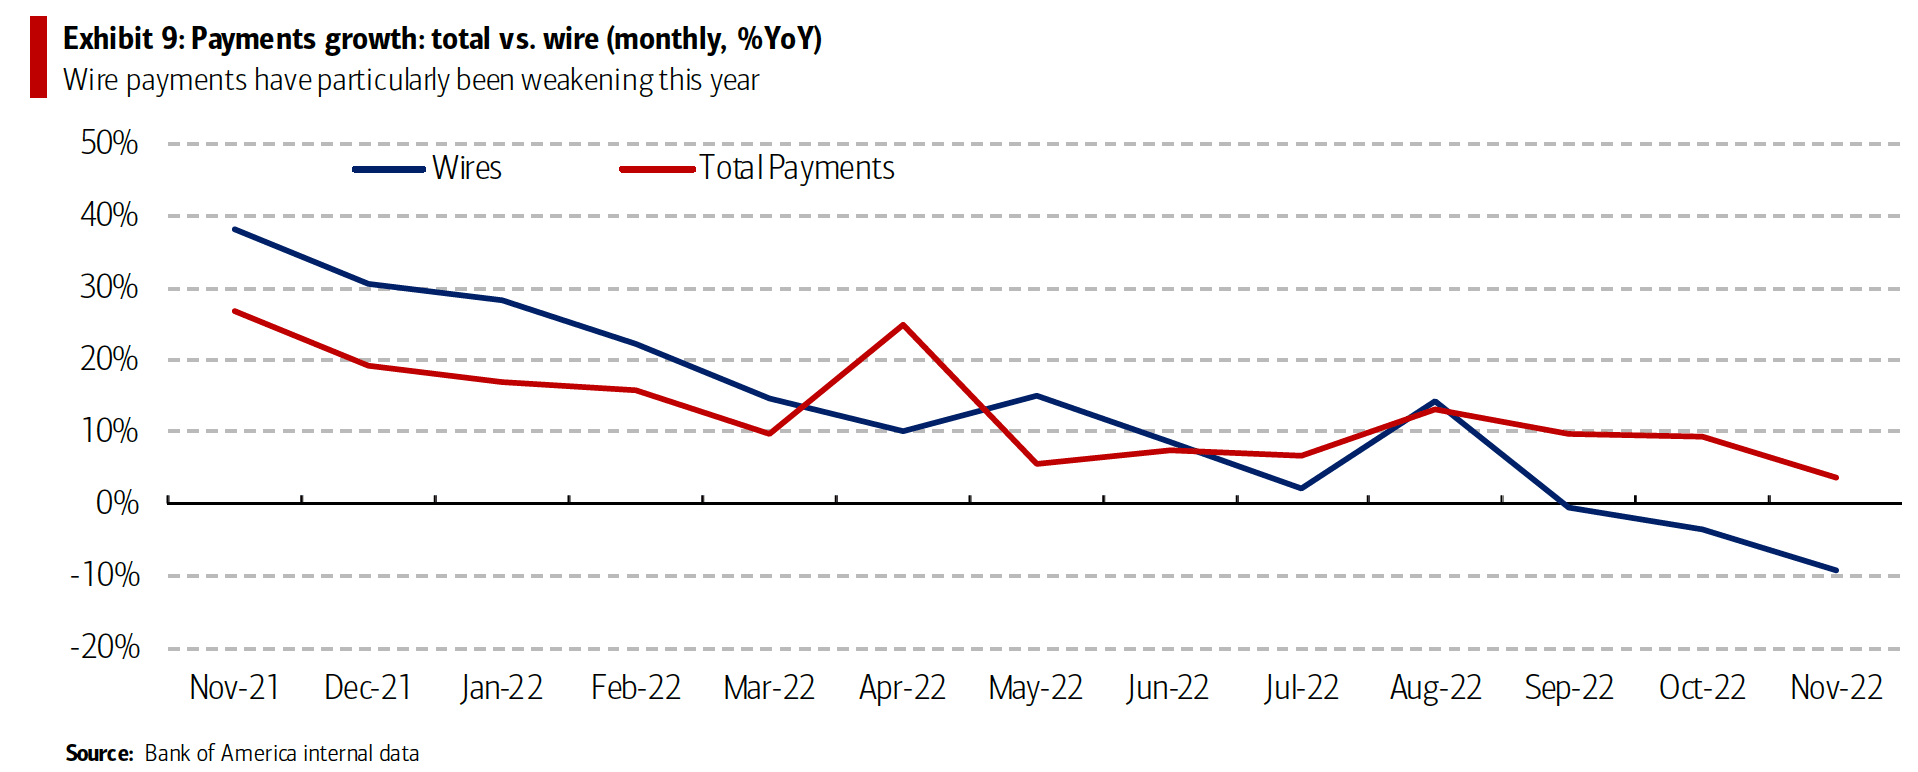
The weakening in overall payments growth is due partly to a slowdown in the growth of wire payments (Exhibit 9). As discussed in the October Checkpoint this largely reflects a drop in payments to escrow and title companies – typically used to pay deposits ahead of closing a housing sale. In the latest November data, payments to escrow and title companies were down 31% YoY.