
Welcome to another trading week!! In appreciation of all of our Basic Membership level participants and daily readers of finomgroup.com content, we offer the following excerpts from our Weekly Research Report. Our weekly Report is extremely detailed and has proven to help guide investors and traders during all types of market conditions with thoughtful insights and analysis, graphs, studies, and historical data/analogues. We encourage our readers to upgrade to our Contributor Membership level to receive our Weekly Research Report and State of the Market Videos and take advantage of this ongoing promotional event today! Have a great trading week, be in touch, and take a look at some of the materials in this weekend’s published Research Report!
Research Report Excerpts #1
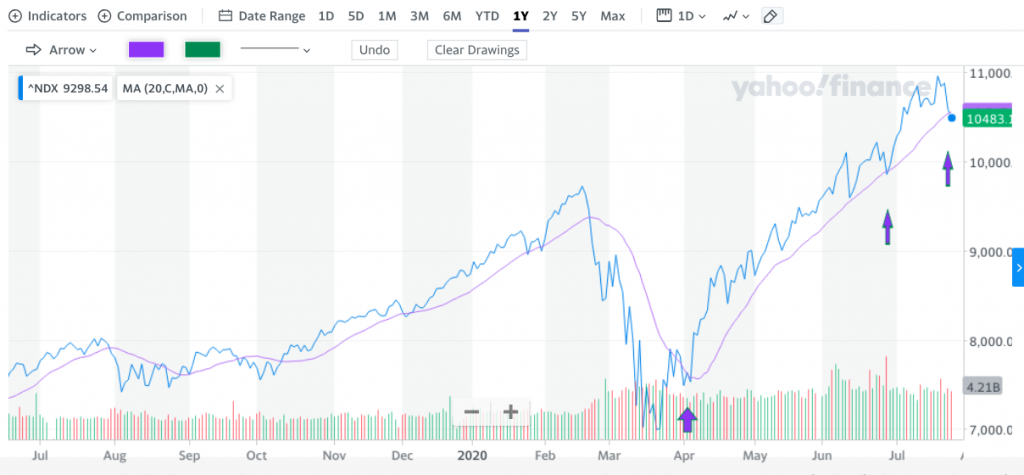
The 1-year NDX 100 chart above identifies a rather consistent pattern for the index to check back to and even break below the 20-DMA, before repeating it’s trend of higher highs. Going back to 2019, the same pattern persists and even identifies periods for which the index stays below its 20-DMA for several days if not weeks.
Research Report Excerpts #2

As shown in the LPL table above, August is usually a negative month for the S&P 500 going back to 1950… except during ELECTION YEARS! We’ll see if history repeats itself again this election cycle, but this is why we deep dive and gather as much historical data points as possible. If you don’t have the right inputs/variables, you’ll likely not have the more accurate outcomes/probabilities or expectations.
Research Report Excerpts #3
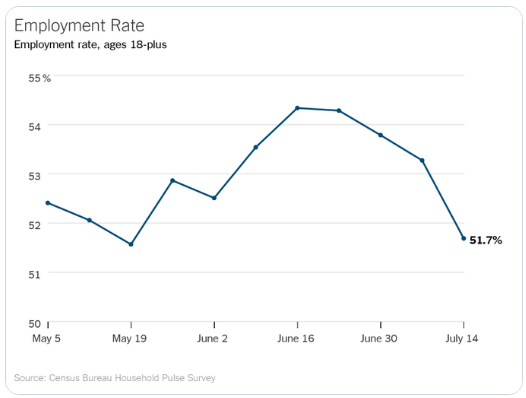
In suggesting negative sentiment for the pending July Nonfarm Payroll report, it is based on the July labor report on continued jobless claims, the economic restrictions recently enforced due to a resurgence in COVID-19 cases, and the civilian employment household survey. The chart above shows the Civilian Employment survey. As you can see, from the June survey week to the July survey week, there were 6.7 million fewer jobs. But we can also suggest the July Nonfarm Payroll report will be negative due to the latest Household Pulse Survey. The chart below shows the household pulse survey has the adult employment rate falling from about 54.3% a month ago to 51.7 percent.
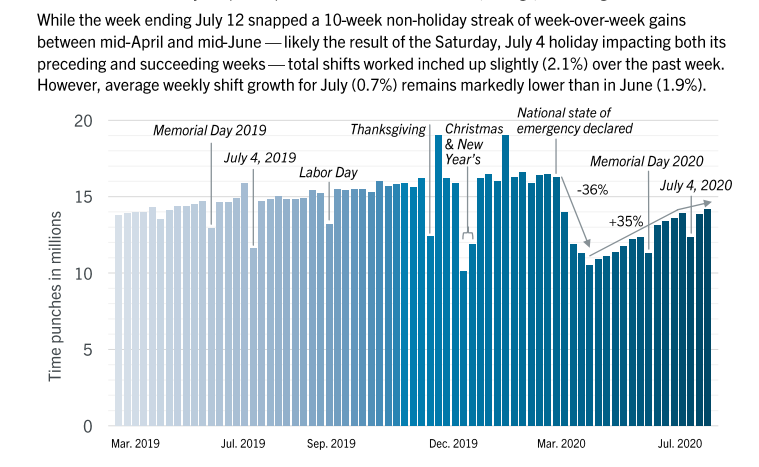
Coupled with all the labor and employment data above, the most recent Kronos Workforce Activity Tracker data shows a marked slowing of shifts worked nationally! (1-week lagged reporting)
Where stocks go on the day of the Nonfarm Payroll report and where the labor market goes in August matter more to investors than the precise figure slated for release on August 7th. That’s still two weeks away thankfully and won’t be mixed into a major tech-reporting week. Additionally, I would be of the opinion that stocks will care more about the latest change in COVID-19 cases and the stimulus package when this report comes out then it will about the specific numbers. If they are expected to show a decline in jobs and rise in the unemployment rate, again, the market will have likely priced it in and any market weakness would probably be short-lived, assuming legislation is passed.
Research Report Excerpts #4
In my opinion, keeping in mind that everyone has an expectation and opinion on Fed policy initiatives going forward, the Fed has seen its last rate hikes. Rate hikes have proven a fruitless tool in its longstanding and seemingly baseless fight against nonexistent forces known as inflation. This might sound salacious, but inflation hasn’t existed in consumer prices since the mid-90s. The only time it rears its ugly head is due to extreme depressions in economic activity such as we had briefly in 2008-2009.
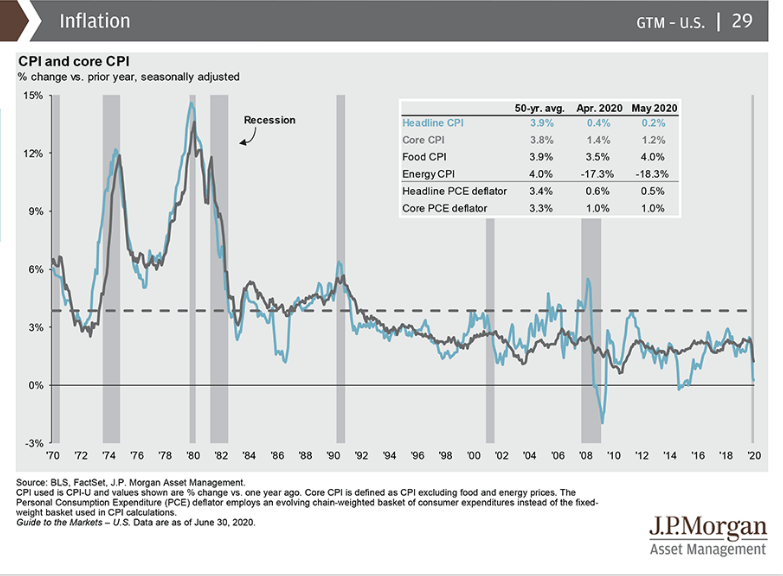
As shown in the CPI data provided by J.P. Morgan above, the index for consumer prices has been flagging lower for more than 25 years. Can we please stop with the whole inflation nonsense. Ergo and to my earlier point, to the degree the Fed has aimed to fight inflation by raising rates, only to lower them shortly thereafter, I think the Fed is on the cusp of a new paradigm with monetary policy.
Keep in mind that the Fed has a dual mandate: Maximum Employment and Price Stability. Prices have been stable and slowly moving lower for over 25 years, mostly due to the impact of price transparency brought about by the information technology era and the rise of e-commerce. Knowing that this trend is cemented and there is no way backward, this understanding further lends to the belief that the Fed will embark upon a new monetary policy paradigm that does not include rate hikes. But how do they deliver such a message?
Research Report Excerpts #5
The blended earnings decline for the second quarter is now -42.4%, which is smaller than the earnings decline of -44% last week. Positive earnings surprises reported by companies in the Health Care and Information Technology sectors were mainly responsible for the decrease in the overall earnings decline during the week. One sector (Utilities) is reporting year-over-year earnings growth. The other 10 sectors are reporting a year-over-year decline in earnings.
Insight/2020/07.2020/07.24.2020_EI/S&P%20500%20Earnings%20Growth%20Q2%202020.png?width=920&name=S&P%20500%20Earnings%20Growth%20Q2%202020.png)
Research Report Excerpts #6
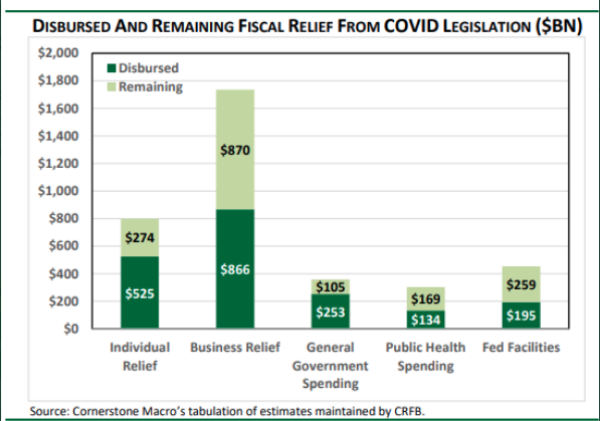
Let us be reminded, that as we spoke of the Cares Act 2.0 demands from the pandemic caused recession and job losses, there is still an ample amount of initial fiscal relief to be put to work folks. Only $2trn of the $3trn Cares Act bill has been spent to-date.
Research Report Excerpts #7
The chart below shows that we are now in line with 2011 and 2012 in terms of the pace of buybacks. This could all change by Q3’s end though and should a vaccine find FDA approval for application.
Announced share buybacks

Thank you for joining us for another trading week and reviewing our weekly “Must Knows”! To receive and review our weekly, full-scale Research Report each Sunday and our State of the Markets weekly video analysis every Thursday, subscribe to our Contributor Membership level at just $7.99 monthly (Cancel any time)! With these two weekly deliveries, you’ll have all the unbiased and fact-driven market and economic data analysis at your fingertips. Don’t make capital allocation decisions based on headlines that brush the surface of what is and isn’t affecting markets. Let our deep-dive analytics supply you with bottom-up and top-down analytics. You won’t be disappointed. Upgrade today!!


