
Coming into the final trading day of the week, U.S. equity futures are setting up for a lower open on Wall Street and ahead of Good Friday. All 3 major averages fell on Wednesday, albeit very modestly and without much volume to consider. And while we can rationalize that most index and index ETFs remain in much the same overbought territory as they were a week ago, sector ETFs are also overbought; all but one of course. (Table from Bespoke Investment Group)
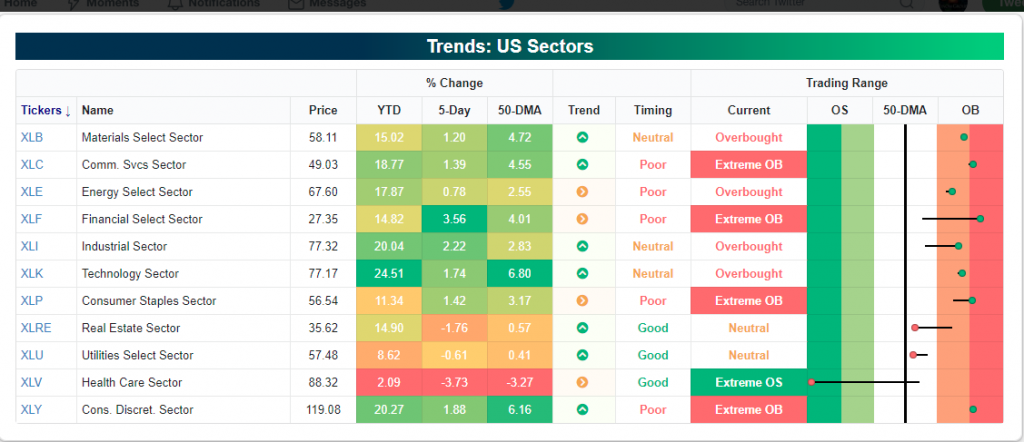
Sector ETFs are mostly overbought. Four are extremely overbought while Health Care (XLV) is about as oversold as it gets. It remains to be seen if the XLV will have its own dead cat bounce in light of political headlines surrounding Medicare single payer plans. One thing is for sure, where we are seeing overbought index and sector ETFs, fund flows have not been heralding their strength.
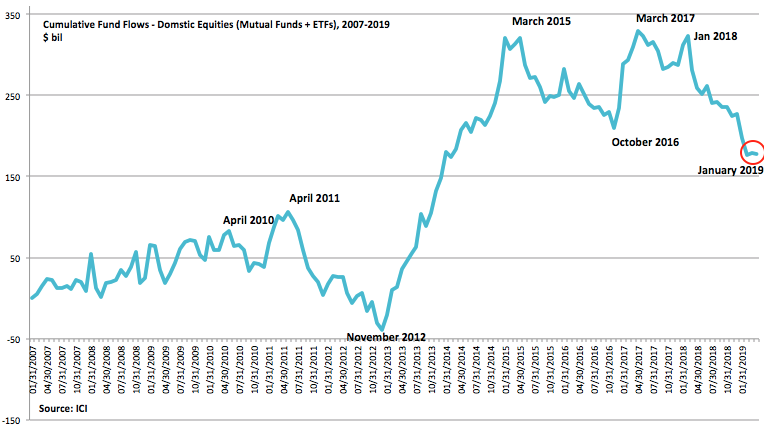
As shown in the chart above, fund flows for certain equity ETFs have improved in the last two weeks, but when we review the longer-term fund flow picture, it suggests something far less optimistic. Regardless of what the fund flows indicate, light releveraging absent greater outflows is finding nimble traders profitable in 2019. How long can that last though is the question posed to the investor community.
In 2019, and with the Fed sidelined, investor confidence has been boosted, but still expresses a more sanguine investor community when compared to that of 2017. The latest AAII sentiment survey found bullish sentiment waning and bearish sentiment percolating.
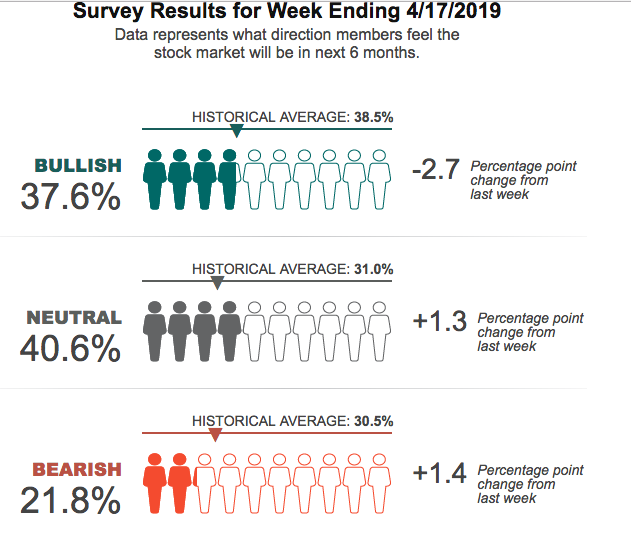
Pessimism about the short-term direction of the stock market fell to an unusually low level in this week’s AAII Sentiment Survey. Optimism rose above its historical average for the first time in six weeks, while neutral sentiment is at the upper end of its recent range.
Bullish sentiment, expectations that stock prices will rise over the next six months, jumped 5.3 percentage points to 40.3%. Optimism was last higher on February 27, 2019 (41.6%). This is the first time bullish sentiment is above its historical average of 38.5% in six weeks.
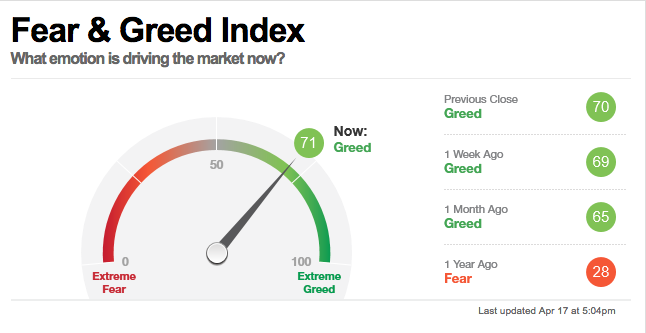
While the AAII survey identifies the investor sentiment, the CNN Fear & Greed Index identifies market fundamentals and price trends. As of yesterday’s market close, the Fear & Greed Index is expressing extreme Greed in the markets.
Moreover, with varying degrees of investor sentiment and price action in the marketplace, the so-called smart money is chasing the market higher and doing so by comfortably holding positions overnight. The Smart Money Index has rallied off of its lows in Q4 2018 as shown in the chart below.
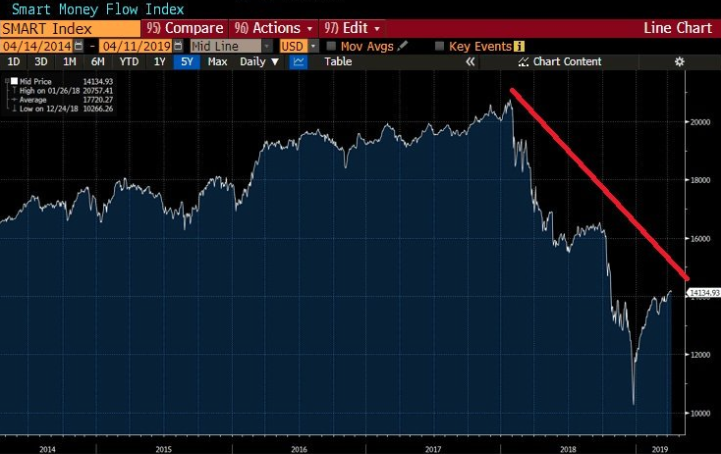
Whereas the SMI showed that “smart money” was selling into the close through most of Q4 2018, the smart money has been buying into the close in through Q1 2019. But on Wednesday, the market had quite the outside reversal day. An outside reversal day is defined as a market that gaps in one direction, but reverses course through the day to finish the trading day with an opposite concluding price. For simplicity sake, an outside reversal day is when today’s HIGH exceeds yesterday’s HIGH, and today’s LOW exceeds yesterday’s LOW; it can often portend a shift in price/direction trend. Not always, but often. Nonetheless, the price action of the last 3 trading sessions has been concerning and the red candle to end the day on Wednesday only highlights the context of an outside reversal days.
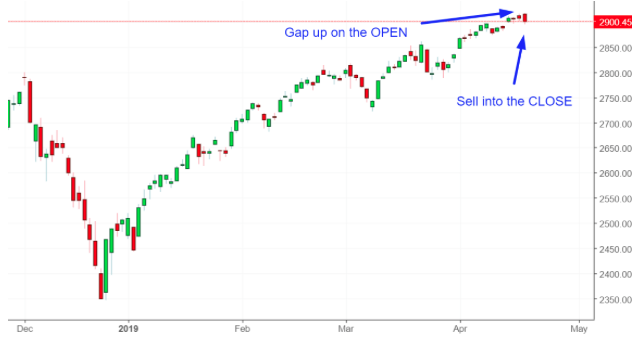
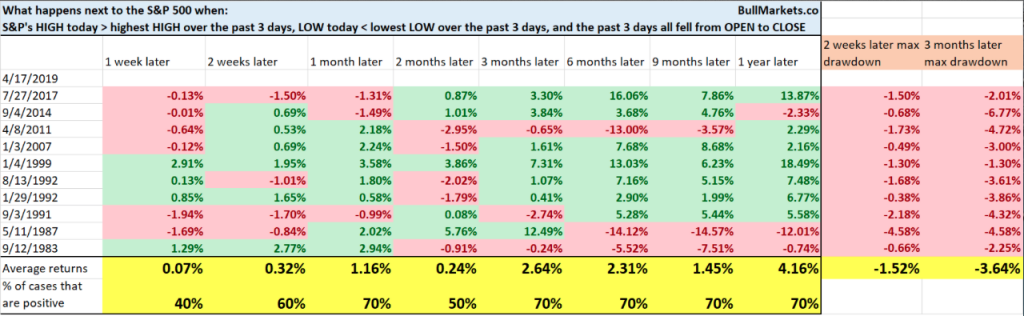
Not only did yesterday’s HIGH and LOW exceed the previous day’s HIGH and LOW, it exceeded the HIGHs and LOWs of the previous 3 days. Since Monday, this has actually been the trend with the market opening somewhat higher but selling down through the trading session. This must be an ominous sign of things to come right? I wouldn’t go that far as we can see in the following table from Bullmarkets.co.
Overnight data proved rather week in Europe and as U.S. investors await a slew of economic data. Purchasing Managers Indexes (PMI) from France and Germany failed to calm fears that a Europe-wide economic slowdown may be imminent. German manufacturing data came in below expectations, while France’s data also showed a decline in output. The euro fell to a one-week low against the dollar after PMI data for the euro zone came in below forecasts, renewing concerns that a Europe-wide slowdown may be imminent. But where concerns exist within the Eurozone, the lone member state seeking a way out of the Union reported strong monthly retail sales.

Britain’s consumers ignored the turmoil at Westminster last month and splashed out in high street stores and online. Despite fears that spending would plummet as a result of mounting Brexit uncertainty, figures from the Office for National Statistics showed retail sales were up 1.1% in March.
The ability of consumers to shrug off political events surprised the City, which had been predicting a 0.3% monthly drop in spending. The year-on-year rise in retail sales between March 2018 and March 2019 of 6.7% was the highest since October 2016, although the annual comparison was distorted by last year’s “beast from the east” cold snap. Last month’s unexpectedly strong activity meant that sales in the first quarter – a better guide to the underlying trend – increased by 1.6% on the final three months of 2018.
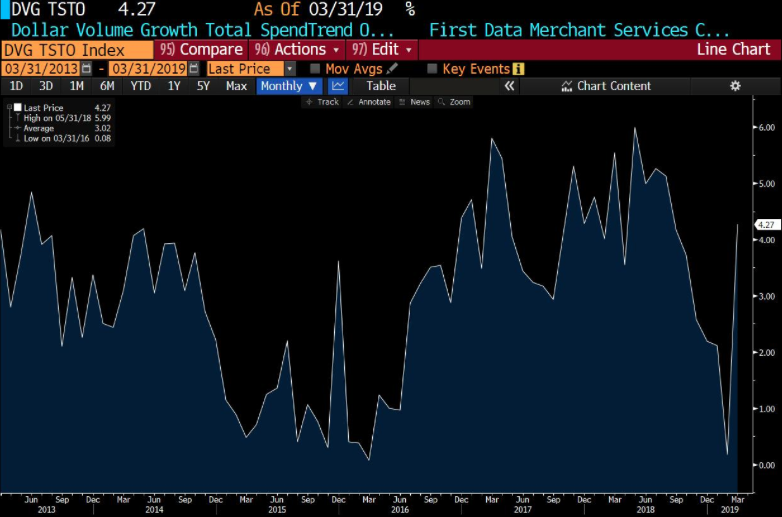
Refocusing on this side of the pond, U.S. investors will be awaiting March retail sales, the Philly Fed Manufacturing Index, Markit PMI and the Leading Economic Indicators data sets. With February retail sales disappointing, but with a sharp upward revision to the January retail sales, investors are hoping for less of a mixed picture in the retail landscape. According to economists polled by MarketWatch, monthly retail sales are expected to rise 1.1% MoM. Retail sales ex-autos are forecast to rise to by a lesser .7 percent. March is historically a strong month for retail sales and if credit card data proves accurate, the anticipated rise in March may very well be accurate. (See chart below)
Beyond retail sales, we would anticipate investors’ reacting to the Philly Fed Manufacturing Index data. To review, the Philadelphia Fed business activity index rebounded in March to a seasonally adjusted reading of 13.7 from – 4.1 in the prior month. The gain reverses most of the steep 21.1-point plunge in February.
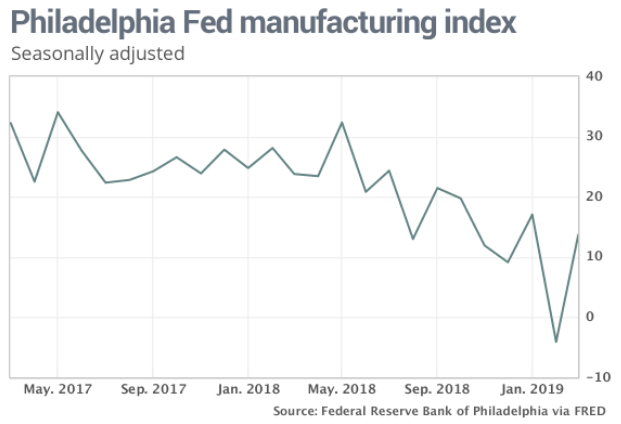
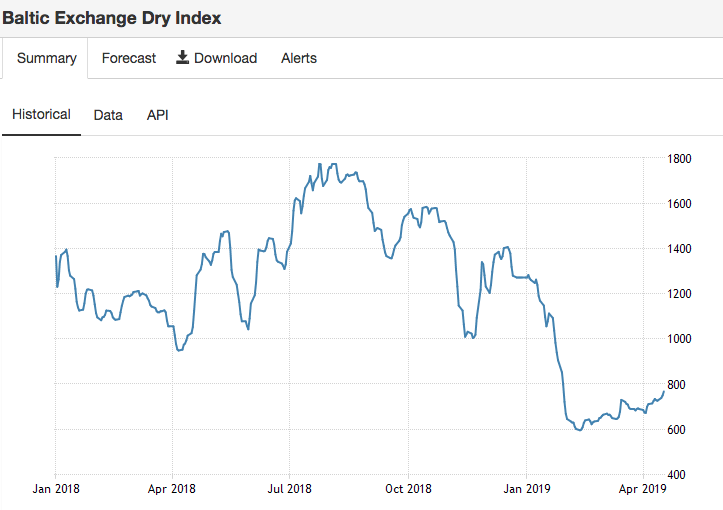
The index is forecast to mean revert lower in April, with economists forecasting a reading of 11. When we review various shipping indexes and primarily the Baltic Dry Index, there is a continued uptrend that suggests manufacturing remains below 2018 levels, but has trough in Q1 2019.
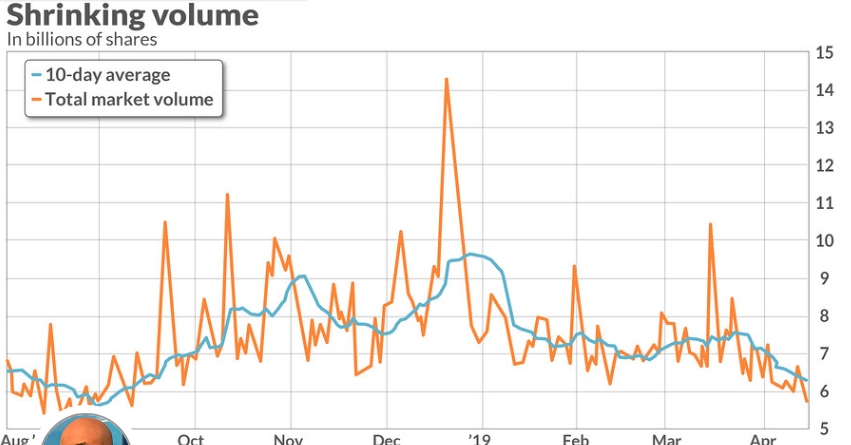
Closing out the trading week, market volume remains light and trending lower. Monday’s action marked the lowest full-day, total composite trading volume (representing trading on the New York Stock Exchange and its main affiliates and on the Nasdaq), roughly 5.7 billion shares since Sept. 10, according to Dow Jones Market Data. In fact, Monday’s session was even eclipsed by the holiday-shortened Christmas Eve session’s turnover of 5.79 billion shares.
To make a finer point, the rolling 10-day average of total composite volumes are their lowest since Sept. 12 and the volumes are on pace for the lowest monthly average since last August. The average volume for April, if it holds, would represent the worst April since 2013, according to Dow Jones Market Data.
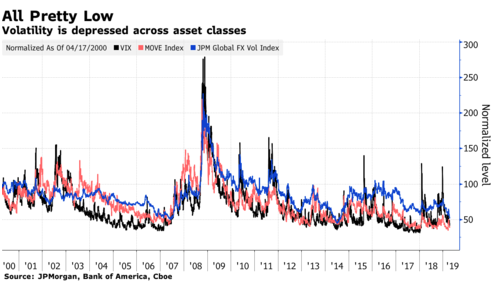
The fact that volume has become lighter as the market has tipped over the 2,900 level means little to nothing and may actually have more to do with fear OF greed that is coupled with very low implied volatility. Investors are seemingly awaiting a market pullback accompanied with a return of volatility. And volatility will return; it’s just a matter of when.
“Volatility rarely picks up bit by bit. It tends to spike when the late-cycle bullish narrative goes off the rails,” Cantor Fitzgerald LP’s Peter Cecchini wrote in an email.
Morgan Stanley’s Andrew Sheets is one of the strategists warning that the calm won’t last.
“The first is that market liquidity is still not great. The second: I’m not sure that the market in its newfound optimism has taken the story to the logical conclusion” about where asset prices are headed.
A disconnect between the growth in financial market size over the past decade and the capacity of banks to take on risk — which hasn’t kept pace — could exacerbate any sell-offs, according to Sheets. Complacent market participants who equate a Federal Reserve on hold with low volatility is also an issue, and big price moves could soon surprise.
If the Fed stays dovish and the data weaken, volatility will go higher. If the data pick up and central banks are effectively saying we’re not going to tighten in the face of improving data, wouldn’t that generate a lot more risk-taking behavior? That would be volatile too.”
Last February was an example of a move that caught markets by surprise. The VIX stayed unusually low throughout 2017, lulling investors into a false sense of complacency. When volatility did pop during a meltdown, the VIX skyrocketed to close Feb. 5 at 37.32.
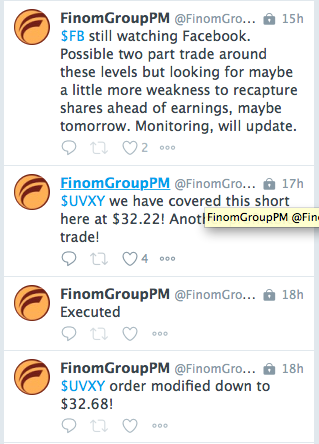
Regardless of what the market delivers, Finom Group continues to drive trade alerts and trade through the various market environments. We have no doubt bouts of market volatility will return and as such manage trading activity with that expectation. For the current trading week, we’ve executed 3 short UVXY trades, 1 on each trading day and coupled with various trades on shares of AMZN, APC and OILU. Below is a screen shot of yesterday’s trade alert on shares of UVXY.
The S&P 500 has lost 7-points going into the final trading session of the week. The weekly expected move priced by the options suggested a move of $27/points in this holiday shortened trading week.
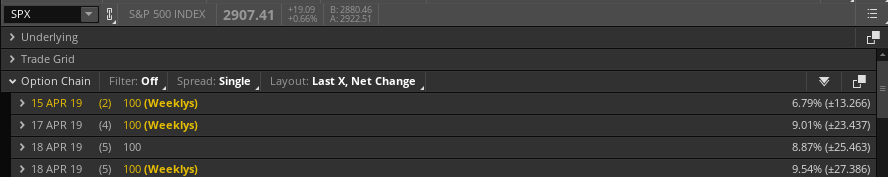
If the options market proves accurate, Thursday could see a big move for the benchmark index.


