
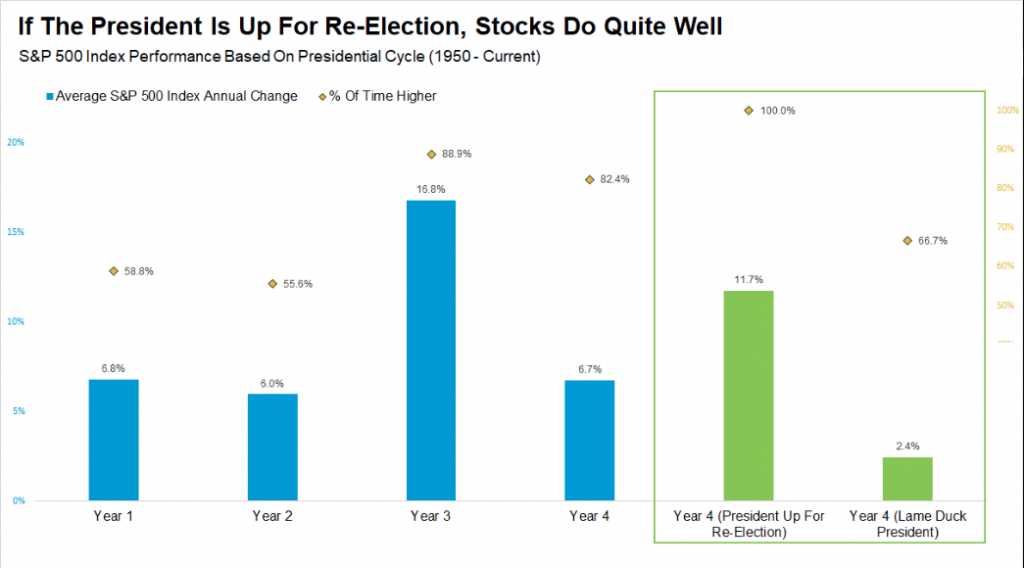
You know, with all the pandemic crisis confronting investors over the last 45 days or so, it gets lost in the mix that this is indeed an election year. And on that note, the S&P 500 (SPX) hasn’t been lower during an election year with a President up for re-election going back to 1950. We lack that kind of track record as investors, shy of recognizing the stock market is down ~12% year-to-date. Having said that, it’s certainly better than the 34% decline from March.
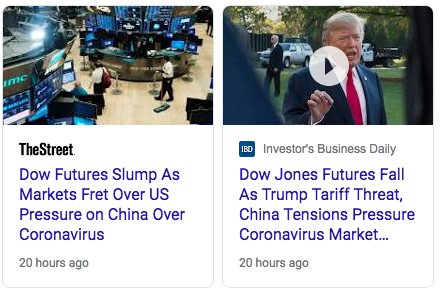
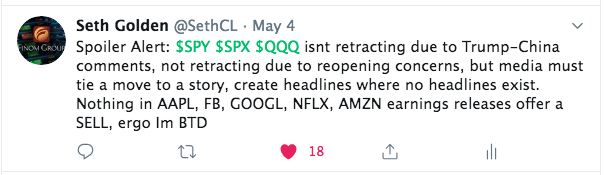
Heading into the trading session on Monday, equity futures were lower by more than 1% across the board. Headlines would have had investors believe that reopening the economy and President Trump’s comments about China/tariffs were the reason for the selling pressure that was being carried over from the previous week. None of this made any sense whatsoever if one was to ask me. And why…?
- With some 30mm U.S. citizens unemployed, we’re not going to restart a trade war during an election year.
- Reopening the economy lends itself to a degree of uncertainty, but it is still better than an economy which has been shutdown and forced into recession.
The financial news media have an objective. On a daily basis they must cover “what’s moving markets”. This basically forces a story or hyperbole onto every market move, even if the story isn’t logical and begs of greater common sense thinking. To make for even greater headlines over the weekend, the media was a buzz from discovering that the Oracle of Omaha had not been a buyer of equities during the market rout from March, but rather a seller of his firm’s airline holdings.
In 1987, Berkshire Hathaway Chairman and CEO Warren Buffett laid out his stock market strategy in a famous way: “We simply attempt to be fearful when others are greedy and to be greedy only when others are fearful.” But in 2020, Despite Berkshire Hathaway’s record cash pile, Buffett says he has not been on a buying spree, because there hasn’t been anything “that attractive.”
The fact that Buffett had dumped his airline stocks, due to the uncertain times that lay ahead and the bailouts received by the airline industry weighing on future profits, pushed the media to highlight the fact that Buffett wasn’t a buyer of equities while others were fearful this time around. Ergo, this time is different or so the media would force us to question! Having said that, Buffett still offered, in a CNBC interview, that the U.S. would overcome the coronavirus and that investors should still be buyers of the S&P 500 index fund.

“In my view, for most people, the best thing to do is owning the S&P 500 index fund,” Buffett said at Berkshire’s annual meeting. “If you bet on America and sustain that position for decades, you’d do far better than buying Treasury securities, or far better than following people … Perhaps with a bias, I don’t believe anyone knows what the market is going to do tomorrow, next week, next month, next year.”
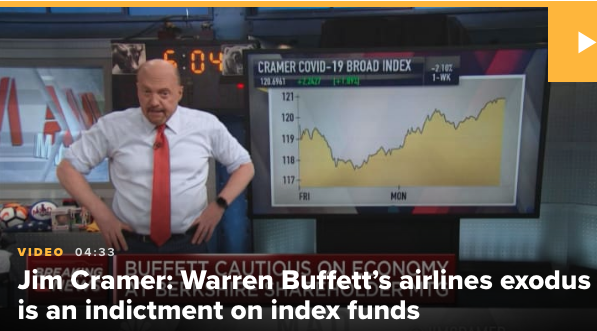
Here’s where things get interesting folks, and least we not forget that equity futures were set to open lower by just over 1% on Monday, over all the asset sales by Berkshire Hathaway/Buffett, comments on China from President Trump and the reopening of the economy. When it was all said and done and the trading day was complete for Monday May 4th, Jim Cramer stated that Warren Buffett’s decision to sell the airline stocks was an indictment on index investing strategies.
“Warren Buffett’s decision to dump airline stocks is an unusual move for the long-term focused investor and could be a reckoning for index investing.”
“To me that was an affirmation that … this is where you have to go,” the “Mad Money” host said while pointing to his recommendation of about 100 equities that can perform in this market environment. “Buffett has a long time horizon, some would say too long.”
“I recommend selling” some position in the S&P 500 index fund “if the [upward] streak continues.
If you’re in individual stocks and they can grow even in tough times, then you should be in much better shape than the index-fund investors who are really stuck holding the bad with the good, because right now there’s a lot more bad than Wall Street seems to think.”
So Buffett says to buy the S&P 500 index fund (SPY), but Jim Cramer says not to and to be a seller into the strength of the equity markets. Quite the opposing views and ones that Finom Group believes are still not specific enough to the individuals investing goals. In other words, neither of these two titans of the financial industry know your investing goals, risk appetite and portfolio holding time horizons. Jim Cramer doesn’t know what will come from the reopening of the economy in the interim any better than Warren Buffett accepted the tribulations from his IBM investment stake a couple years ago and what would impact his airline investments in the present day when he initially embarked upon these decisions.
If all of these headlines weren’t enough… remember, fear sells. Optimism doesn’t garner clicks and/or viewership. In the financial media, if it’s not a fear-driven story then most investors won’t bother to consider what will negatively affect their portfolio, their investments.
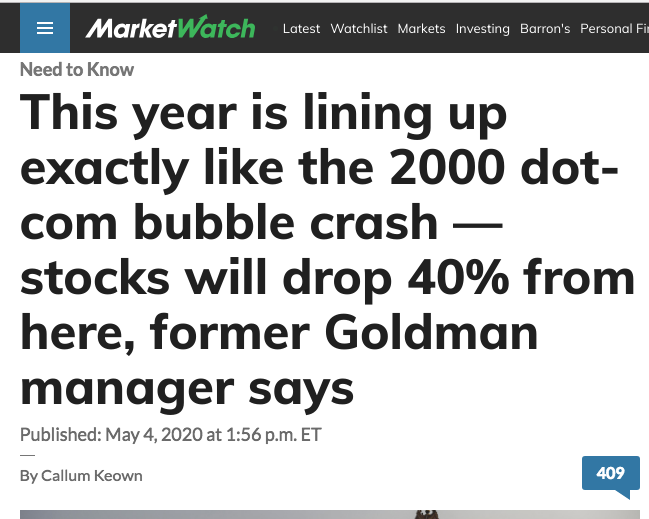
Will Meade: “The Nasdaq in 2000 did a similar bear market bounce as stocks this year — dropped 40%, then bounced 42% off the bottom retracing 61.8% of its drop. It stalled then fell 43%, making a new low four months later. There is a presidential election on the horizon, as it was in 2000, creating further risk and uncertainty, while retail participation and leverage was near the 2000 bubble level.“
This seems a very limited perspective to draw conclusions for an index’s near-term performance. As we’ve discussed for weeks now, everyone is looking for a model/analogue to suggest today is similar to, fill in the _________. It’s like 1987, 1930’s, 2000 and/or 2008. And of course, Will Meade’s dire forecast should not be lost on investors and centers on the Nasdaq, not the S&P 500. This is not to say the S&P 500 wouldn’t find a severe drop to coincide with the Nasdaq, but rather validates the desire to find market chaos for the sake of making headlines.
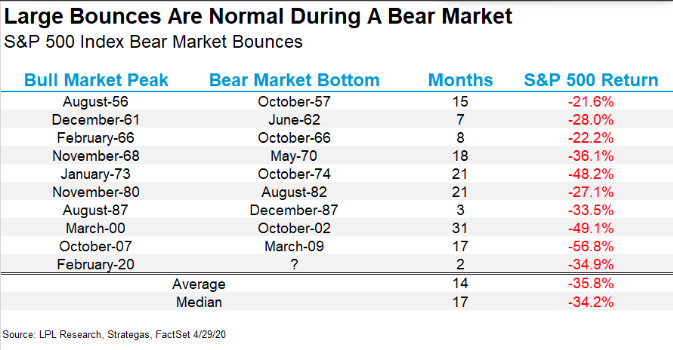
The only other time in history we’ve seen such amazing market bounces have been in the 1930s and back in 2009. It’s why the following analogous chart is making waves in social media, and may still find investors hesitant with trusting the relief rally to be something more than just a relief rally.
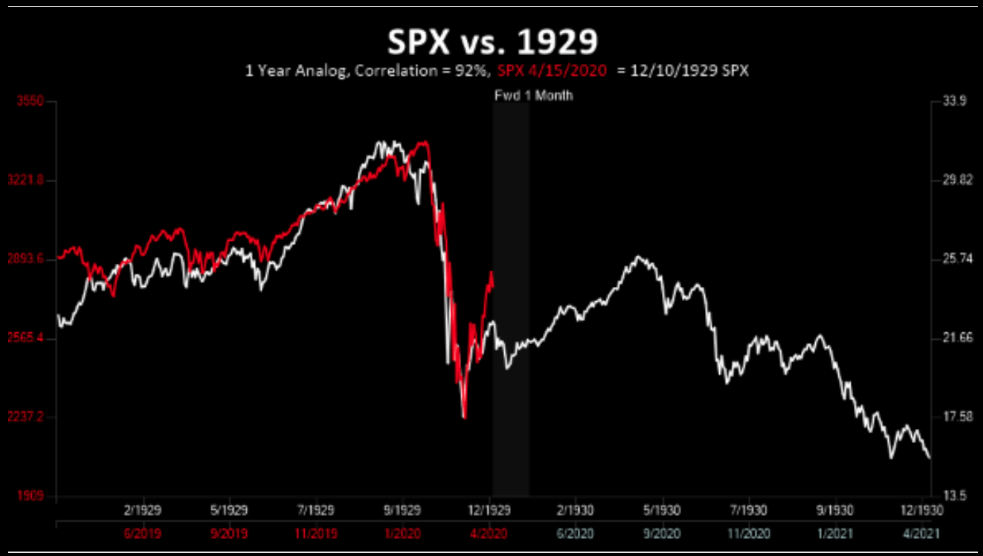
In December of 1929, the market had a substantial rebound that lasted until May of 1930. The decline that preceded the bounce was that much more fierce at 36.3%, slightly more than that in 2020 (34%). Additionally, when we examine the analogue of 1929, the relief rally actually lasted ~5 months before faltering and making new lows. This enforces our mantra that investors are best served by following the flow of information/news, remaining open minded and without a bias toward markets. We simply don’t know if 1929’s analogue is a guarantee of the market’s outcome in 2020. Maybe 5 months from now, in September, we’ll have a better understanding.
And why not look at the S&P 500 analogues in favor of the Nasdaq, as proposed by Will Meade? Well it’s really quite simple!
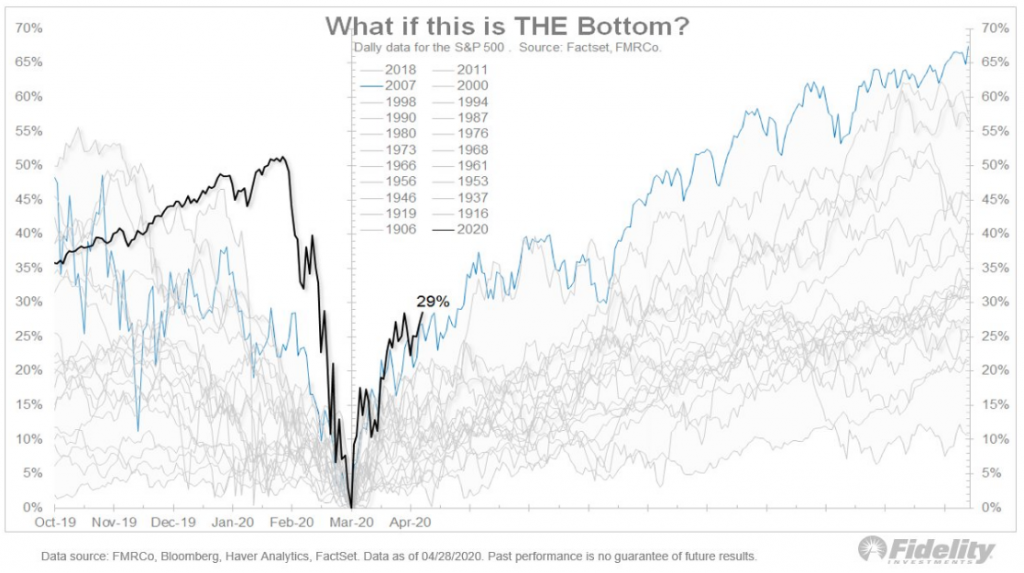
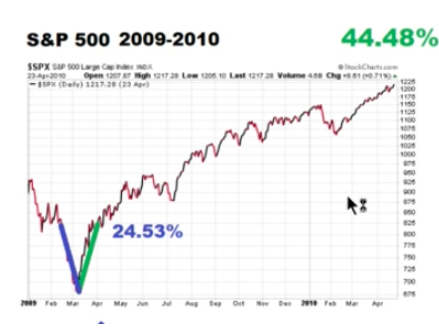
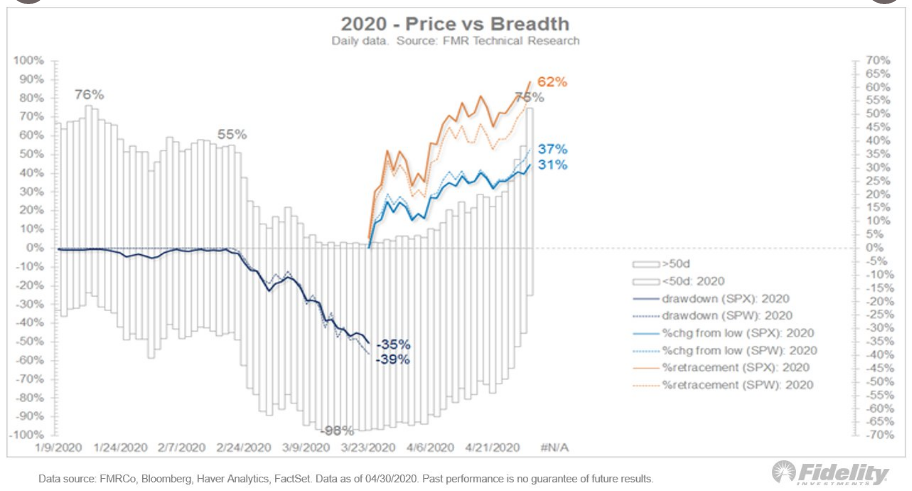
The chart above from Fidelity identifies some of the most precipitous S&P 500 drops throughout market history. For those bold enough to believe that the March 23 low was THE low, it’s worth noting that the S&P 500 is tracking the best possible recovery analog, which happened to be 2009. Remember, if it isn’t a negative and consequential outcome for investors, which 2009 proved a positive outcome, the article or video won’t capture clicks and viewership. And least we not forget what took place at the V-bottom in 2009 and thereafter!
The other narrative evoking fear for the market, after rebounding nearly 32% from the March 23rd lows is how the rebound has taken shape. It’s always something that analysts, strategists and permabears will find to assuage investors from taking risk. Breadth is a key focus for many market participants, fund managers included. What are the most important breadth metrics/readings finds little agreement and a broad diversity of responses. As it pertains to the current market rebound, however, may find it difficult to ignore that the strength of the rebound is largely confined to the top 5 mega-cap stocks.
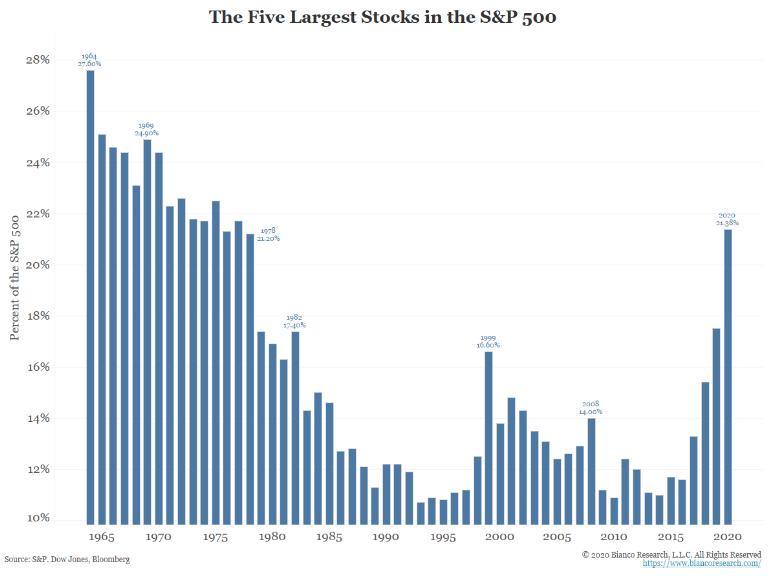
At just over 21%, the S&P 500 is the most concentrated it has been in more than a generation given the 5 largest stocks in the index. Like it or not, bull or bear, this is part of the reason the rebound in the S&P 500 has been so robust and more recently found with dip buyers than during the market breakdown in March. The majority of earnings and revenues come from these core names in the S&P 500 and individual sectors, hence they carry the largest cap weighting and can help to KEEP THE S&P 500 FROM RE-TESTING ITS LOWS! But this is not something that breeds comfort amongst many market participants as they are more concerned with these stocks falling in value, dragging the rest of the market with them.
The chart below shows a composite index of the five mega-cap MAGA stocks and Facebook: Microsoft, Apple, Amazon, Alphabet (Google), and Facebook. Andrew Thrasher of Thrasher Analytics offers the following narrative, highlight some of the concerns with these top 5 stocks as follows:
“As of last week, the composite index has fallen back below the February peak and with it, a lower high in momentum based on the 14-day Relative Strength Index (RSI).”

“Another way we can evaluate who the “Generals” can be based on performance. Sticking with our focus on larger cap companies, I built another composite index of the only stocks within the S&P 100 that have positive year-to-date performance through Friday (May 1st). Unfortunately, this list is fairly short with just seventeen names – many of which are also included in the prior list of the five mega caps.
“Once again, we have this group of market leaders bottoming ahead of the index, showing their leadership status as they marched back above the February high. However, momentum has been declining since mid-April, making lower highs each time the composite eked out a slightly higher-high. By the end of last week this group of positive YTD performers were inching back under the February high as they begin to confirm the bearish divergence observed in momentum.”

Something I want to point out here in the Thrasher Analytics S&P 100 index is that the author created the criterion. He’s on the hunt for something, developing a thesis for believed to be underlying market weakness. It’s not to suggest it’s a fruitless or valueless study, but there’s a decisive bias we’re employing when we embark on such an exercise, the hunt. The hunt for what? Well, I think we understand this is a hunt for weakness. Additionally, one could argue this is simply a risk management exercise. Like the following recognition of accumulating stocks vs. distributing stocks.
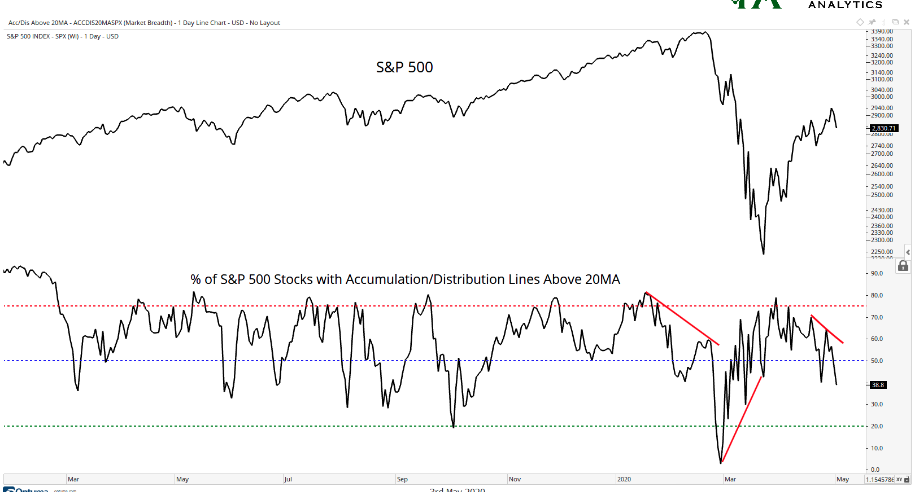
As pointed out in the chart from Thrasher Analytics, the majority of S&P 500 stocks now have their respective accumulation/distribution lines trending lower. This is certainly not the most bullish picture, but it is in accordance with the 2-week downtrend in the market. As we mentioned in our weekly Research Report, it can be difficult to sift through the weekly high’s in the S&P 500 to realize that the market has actually been lower for 2 consecutive weeks, losing some 1.5% along the way. And while the market breadth has weakened in some respects (A/D 20MA), it has strengthened in other respects, which is also dependent upon the period we analyze.
A look at the percentage of stocks above their 50-dma above shows bullish breadth developed over the last several weeks. The percentage of stocks trading above their 50-dma is now higher than at the February price high and as high as the January 2020 momentum peak.
When it comes to deciphering market breadth and what is actually taking place underneath the hood of the S&P 500, you’re always going to be able to find pros and cons. It becomes less relevant than the actual price movement of the S&P 500, which inevitably travels higher. Understanding the weakness or strength in breadth simply provides us rationale for potentially lightening market exposure or ramping market exposure. And speaking of market exposure…
Hedge funds have seen their net stock exposures jump to the highest in at least 3 years during bouts of short covering and bullish bets on cyclical companies, according to a report from Bloomberg. U.S. long-short funds have developed a more risk-on posture amid the $4.6 trillion trough-to-peak rally across some of the industries most exposed to the coronavirus fallout, according to Credit Suisse Group AG. Not exactly what Warren Buffett has been doing.
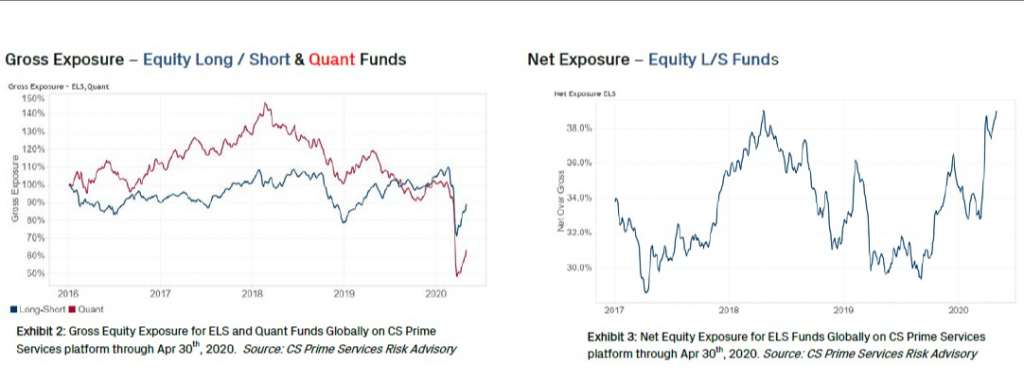
Overall, equity long-short funds were up 4% in April, according to Credit Suisse data derived from the positioning of clients using its prime-brokerage platform. While their more profound long positions including technology outperformed, their rebounding short bets hurt profits. All that spurred the cohort to cover some of their short positions in cyclical industries.
Overall, gross exposures — long plus short positions — remain relatively low across hedge funds, especially among quantitative firms that deleveraged by the most on record during the March sell-off. As for macro managers and commodity trading advisors, which mostly speculate with futures, net equity exposure is the lowest in about a year, according to the bank’s data.
Risk-on here, risk-off there, it’s a real debate and battle some might say as confidence in the near-term economic performance remains front of mind amongst investors, and very much in doubt. The question also remains, “How much higher can we actually go given the sharp drop-off in earnings for 2020.” That’s the question that is really being forced through the breadth analysis. It’s a disbelief in the markets ability to paint a realistic picture when compared to the earnings decline forecast. It sets up the bull/bear debate so to speak. This is also something that Canaccord Genuity’s chief equity strategist Tony Dwyer highlighted in a recent interview on CNBC. Within the interview, Dwyer also highlights MAGA stock’s outperformance.
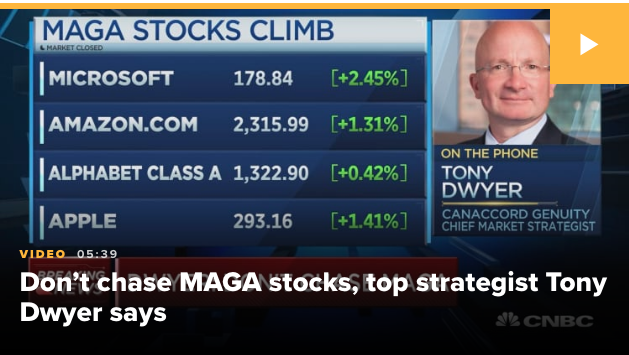
“The stock market is in the “perfect place” for a struggle between support from the Federal Reserve and the economic issues facing the United States, and investors should wait for signs that the Fed is winning before buying in. That reliance on the biggest tech stocks is one of the things that needs to change before Canaccord Genuity tells investors it’s time to jump in.
I could see a situation where the S&P 500 index itself doesn’t do a whole heck of a lot, but you start to see the rotation underneath.
You would want to see the U.S. Treasury market have a pretty significant uptick in yields, suggesting that it’s betting on an economic recovery.”
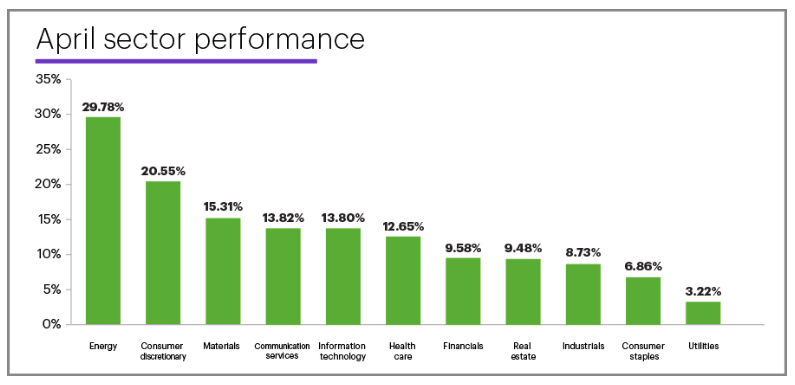
The reality is, we have seen some sector rotation away from MAGA in April, some. Look at sector performance for the month of April, which identifies offensive, cyclical sectors outperforming defensive sectors. This is what investors want to see from sector performance to identify that it is less likely a full re-test of the low would take place and investors are found with improved risk appetite.
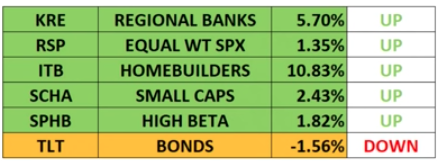
More importantly and as offered at the onset of this week’s Reseach Report, small caps picked-up where the FAANMG stocks left off previously. Stocks tend to bottom prior to a recession’s end and small-caps tend to lead large-caps early in those new cyclical bull markets.
It’s all a very fluid situation folks and from one day to the next the market is discounting earnings going forward. The reality is lost as to the mechanics of the market as headlines aim to explain every tick of every trading day. But here is something that I offered on Twitter and to our subscribers over the weekend in our Research Report to consider:
- Looking at future quarters, analysts predict a (year-over-year) decline in earnings in the second quarter (-36.7%), third quarter (-20.1%), and fourth quarter (-9.4%) of 2020.
- This week marked the first time the S&P 500 recorded a forward 12-month P/E ratio of 20.0 or higher since April of 2002.
- The forward 12-month P/E ratio is 20.3, which is above the five-year average and above the 10-year average.
Anybody desire to do the math on the YoY analysts FY2020 EPS projections? Well, let’s do take a crack at it: We will use the going projections and round the numbers for ease of use as follows:
- Q1 is trending -14% EPS. (rounded up)
- -14 + -37 + -20 + -10 = -81% EPS contraction SaaR.
- Now divide the -81% by 4 quarters and the result = -20.25% YoY EPS contraction
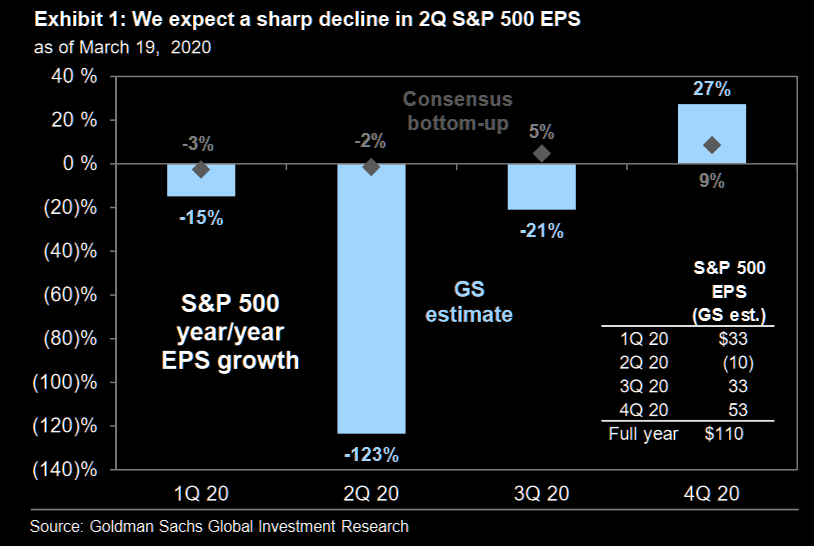
The good news here is that Q1 estimates are actually coming in better than expected and even the full year estimates are better than that from Goldman Sachs. The firm has a FY2020 EPS forecast decline of 33 percent, as outlined below:
“We now forecast S&P 500 EPS of $110 in 2020, a decline of 33% from 2019. On a quarterly basis, this reflects year/year growth of -15%, -123%, -21% and +27%. We have cut our 2020 earnings forecast three times in 30 days (-37% in total) as the magnitude of the economic slowdown has become increasingly apparent.”
Now let’s take the earnings information above and compare it to that from the Great Financial Crisis of 2008. In 2008, earnings fell some 46% on a year-over-year basis. Presently, that is more than double the current analysts’ estimate and ~50% more than the Goldman Sachs’ estimate for 2020 earnings.
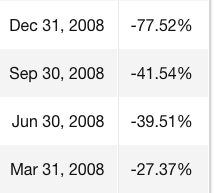
The S&P 500 fell from 2007-2009 as earnings declined substantially. From peak-to-trough, the S&P 500 lost some 56% of its value over this period on more than double the projected EPS decline for 2020. In 2020, the bear market initial low produced a 34% decline, which is more than the projected earnings decline.
With earnings already delivered from FAANMG stocks, I didn’t see anything in the results, and despite the economy being closed for the whole of April, that warranted selling AAPL, GOOGL, Amazon, FB or MSFT. Nothing in the sales or earnings results and trend suggested selling these names as they capture more and more market share with their lesser competitors left in the dark. You don’t have to agree or even like the monolithic valuations for some of these names, but that’s what market share gains deliver, higher valuations. You might not want to fight history on this one folks.
Moreover and in conclusion, regardless of what the market does near-term, know what to do given the fundamental and structural backdrop of the market. Long-term, and as I suggested in the following tweet, I would be a buyer of the dip
Nonetheless, here is Goldman Sachs’ latest take on the current market set-up:
“The slowdown in the number of Covid-19 infections globally, coupled with the extraordinary stimulus from central banks and governments, has reduced left tail risks and increased the chances for macro momentum to improve – but it has also triggered a strong recovery in risky assets. As a result, the asymmetry to add risk has worsened: we would be defensively positioned tactically (UW equities, OW credit and up-in-quality). We remain modestly pro-risk for 12m (OW equities, commodities, UW bonds). For both 3m and 12m horizons, we remain OW cash as we think diversification in multi-asset portfolios will remain difficult”


