It proved a bit of a rocky trading session on Monday, with the major averages rolling back some of their gains through much of the morning. But then came an afternoon market rally as headlines concerning the Boeing (BA) 737 Max airliner. Boeing on Monday said it expects to resume deliveries of its grounded 737 Max planes as early as next month and that airlines could be able to restart commercial service in January, setting off the biggest rally in the company’s shares since June.
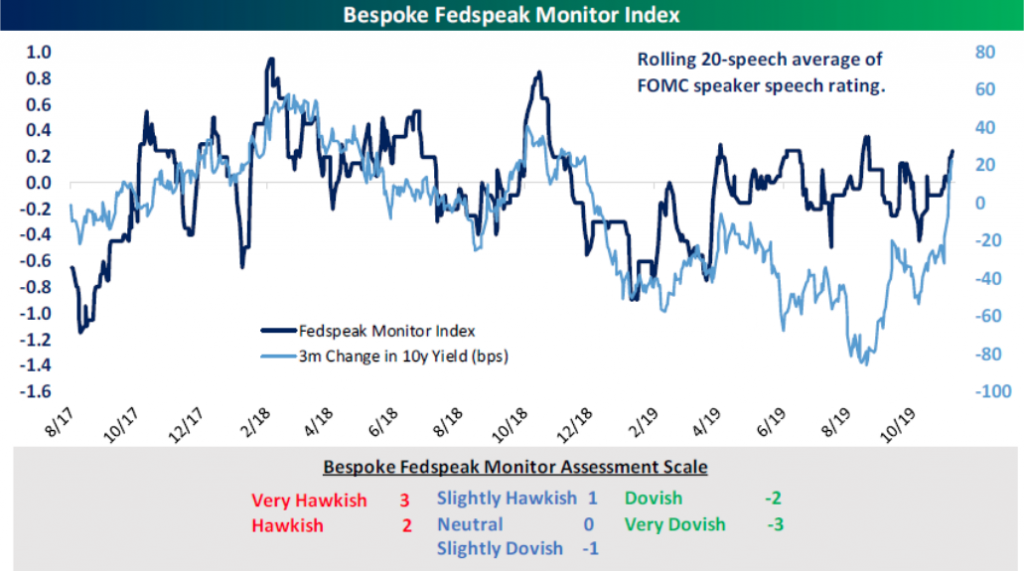
The rally in shares of BA was enough to pull all 3 major averages off of their lows, although the S&P 500 (SPX) and Nasdaq (NDX) finished slightly lower on the day. On Tuesday, investors will be looking toward President Trumps speech at the Economic Club of New York, discussing trade, and Fed Chairman Powell is scheduled to appear on Wednesday before the Congressional Joint Economic Committee and then in front of the House Budget Committee. Fed speeches are littering the landscape of the markets this week. Since shifting from very hawkish to very dovish over the course of the past year, Fed speakers have been pretty neutral recently and according to the Bespoke Fedspeak Monitoring Index.
The event of the trading day come Tuesday is undoubtedly the President’s speech, which will likely be duplicated with anticipation come Wednesday, as impeachment hearings become live television broadcasting. With the major indices at or near record highs, investors, strategists and analysts alike are giving rise to market pullback narratives. While all will lay claim to this metric or that metric pointing in the direction of a near-term market corrective phase of sorts, none are perfect indicators. With that beings said, a market pullback and timing such a pullback should be recognized as less material than what investors might do during such a distribution phase.
Investors have been pulling away from growth and defensive stocks of late and moving into value names as market conditions improve and optimism starts to seep back into the investing community.
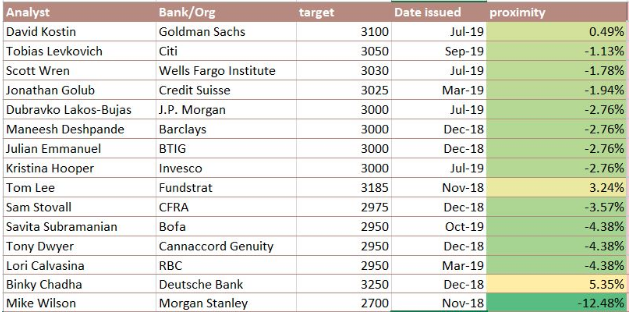
Many analysts and strategists have upwardly revised their year-end and/or 12-month price targets. Tobias Levkovich, Citigroup Inc.’s chief U.S. equity strategist, raised his year-end target for the S&P 500 to 3,050 from 2,850, going from the fourth-bearish among Wall Street prognosticators tracked by Bloomberg to one of the few who still see gains for the rest of 2019. FundStrat’s Tom Lee also recently raised his year-end price target to 3,185.
Lee argued that Wall Street bears, who have spent much of the year fretting that weak growth abroad would infect the U.S., misunderstand “the U.S. is decoupling from the rest of the world.”
“The U.S. outlook isn’t dependent on trade, it’s dependent on positive population growth,” a trait that is unique to the United States among wealthy countries. The underlying driver of the economy is population growth, and particularly growth in the important 30-year-old to 50-year-old age range.”
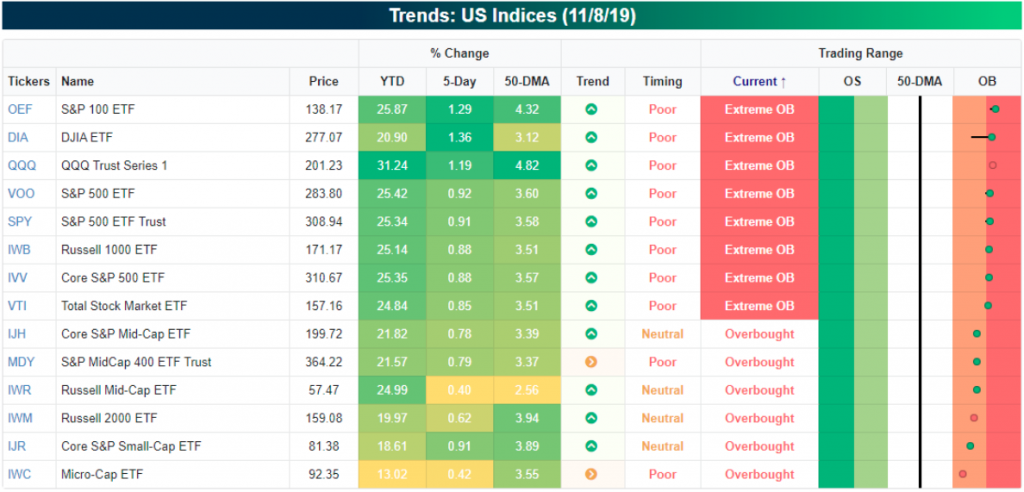
U.S. and global equity market optimism has certainly risen since September and during the latest leg to record level highs in the big 3 U.S. indices. Markets have become overbought and there are various means, metrics and indicators suggesting as such. When we look at index ETFs, it becomes abundantly clear that markets and sentiment have become quite frothy.
Frothy and overbought as markets may be, some are looking beyond a probabilistic market pullback, suggesting more gains are in-store. Avalon Investment & Advisory’s Bill Stone is just one of many. Stone says that the rotation out of growth and into value is a major catalyst for these market moves and the ones to come.
“Value stocks had really been left in the dust. That rotation has kicked in. We’ve gotten much more of the cyclical names, the value names, acting better. I think that can help take us to new highs.
The U.S. and globally economy have kind of stabilized and hopefully put in a bottom here. That certainly helps. And … connected to that is clearly the trade dispute. … Sometimes, we get headlines that maybe call some things into question, but, at the end, I think we are kind of moving toward at least a détente. And, frankly, détente’s enough.”
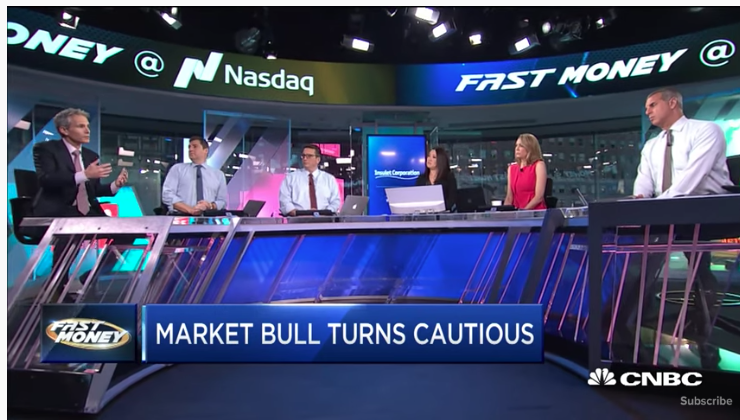
While Stone and Tom Lee are looking for a market melt-up by end-of-year, others are more focused on the near term probabilities. Blackstone’s chief U.S. equity strategist Joseph Zidle is looking for a 7% near-term pullback for equity markets. Here are just a few of the reasons he offered in his latest appearance on CNBC’s Fast Money:
- Liquidity has overshadowed fundamentals.
- The liquidity has largely been produced by the Federal Reserve and has filtered into the financial markets, but not the real economy.
- Earnings are likely negative on a YoY basis in Q3 with Q4 earnings also likely to come down on a YoY basis.
- Profit margins and revenue growth have deteriorated.
- Not the end of the bull market, but likely better entry points.
- Market needs time for the fundamentals to catch up to market performance.
- Treasury yields do support PE expansion.
- Yields likely hit lows of the cycle.
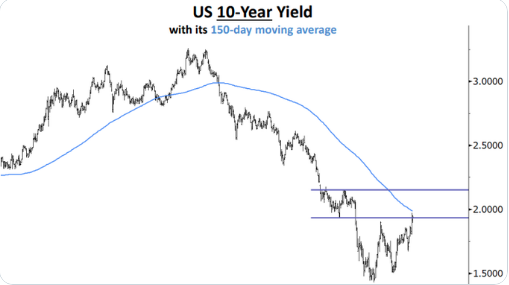
Mirroring some of Zidle’s comments on yields, Cornerstone Macro Research’s chief market technician Carter Worth thinks the move higher in Treasury yields is likely over for now and expects the 10yr. yield to be sideways to lower from here. He thinks the volatility in rates abates substantially and thinks the 10yr. will end the year almost exactly where it is now.
Worth also noted his broad opinion on the stock market late Monday on CNBC. Like Zidle, Carter Worth believes the market is prepping for about a 10% pullback.
The bearish technical review by Carter Worth is nothing new, as most of his analysis begs of market downturns. It’s also important to note that none, not one of these bearish takes from Worth have come to fruition in 2019, when he made such calls. Finom Group doesn’t discount the potential for a market pullback, but we are doubtful that the liquidity paradigm will allot for anything more than a 3-5% drop, before resuming the uptrend. This forecast, of course, is barring any significant meltdown in trade talks.
Everyone has an opinion on the next move in markets. Overbought conditions resolve themselves through price and/or time. We’re believers that present overbought conditions will result in a pause, then resumption of trend. When we review the market’s structure, it remains on sound footing as economic growth is expected to improve going into 2020. Market breadth has been relatively good, although weakening slightly of late. Even so, the weakening breadth won’t likely prove as meaningful as the Q4 2018 period, when the S&P 500 was trading below key moving averages.
One sector of the market that is particularly sensitive to economic strength or weakness is the Dow Jones Transports (DJT). The Dow Jones Transportation Index had trouble clearing the blue line in the chart below back in September 2018, April 2019, July 2019, and again in September 2019. More recently, however, the DJT stocks have successfully cleared the former obstacle. The longer the breakout remains in place, the more meaningful it becomes. (chart from Ciovacco Capital)
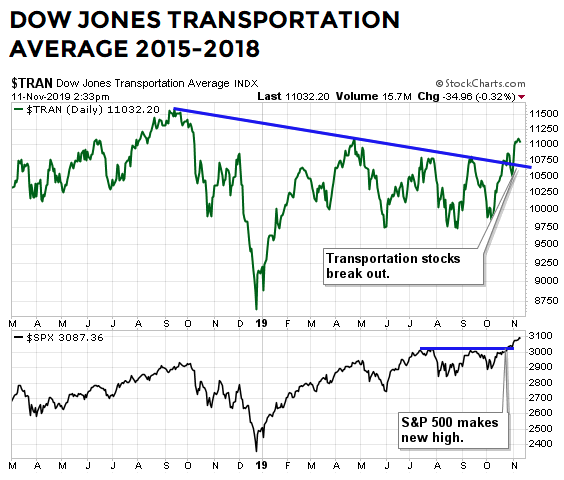
The Dow Jones Transports present a structural component of the market that we desired to see breakout, along with the S&P 500 and Dow Industrial Average. Now that it has, we can suggest near-term breadth weakening as something less concerning. Should the market pullback, the breakout in Transport stocks along with a MACD turn higher back in late July, suggest dip-buying opportunities and not market selling opportunities. And while the market is structurally sound, sentiment extremes become a focus.
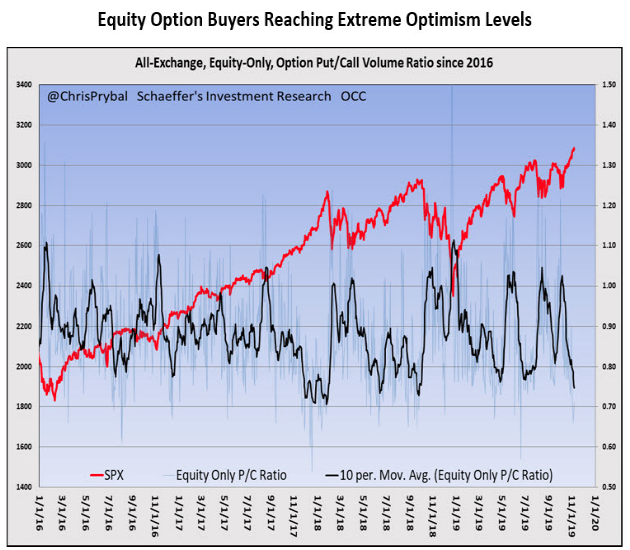
The Options Clearing Corporate (OCC) all-exchange, equity-only, 10-day option put/call volume ratio is rolling from one extreme to the other and is currently nearing the lower end of its typical range at 0.75, and is signaling to investors that there is some exuberance among market participants within the options market. Additionally, SPDR S&P 500 ETF Trust (SPY – 308.94) implied volatility levels are in the low end of their range at 10 percent. While this is never a harbinger itself, implied volatilities are typically in the lower end of the range before volatility spikes during sell-offs.
As Schaeffer’s Research analyst Matthew Timpane also points out, the VIX 20-day buy-to-open call/put ratio, which is at 2.14 after a sharp drop, may prove to dampen any pullbacks and here is why.
- We typically see a surge in call buying above 7.00 before market pullbacks, although the indicator has been hard to time, as pullbacks have occurred anywhere from days to weeks later.
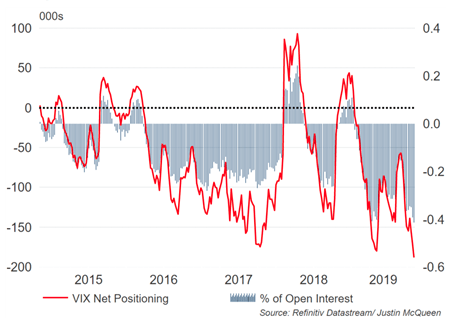
- Commitments of Traders (COT) large speculators are once again at a record-setting VIX futures short position this week.
- Any short-term pullback that would create a rapid uptick in volatility would likely be followed by aggressive covering in these positions and likely reallocating to equity positions.
- As such, the subsequent backstop to the equity market pullback would also prove to halt the VIX ascent.
Matthew Timpane’s assessment mirrors that which Finom Group also recently offered with respect to the COT report, which lacks the read through to what VIX Futures Term Structure is also suggesting. While positioning is at extremes on both outright net futures shorts (188k) and on an open interest adjusted basis (41.5%), it is hardly the positioning that led to the February 2018 Volmaggedon event and accelerated termination of XIV. Risks of a VIX blowout, like that seen in February 2018 may be somewhat misplaced, given that open interest is comparatively lower at 491k from 650k back in early 2018. That’s a net reduction in open interest of roughly 25 percent.
Finom Group believes the VIX itself has a chance of exceeding 16 in the event the market does pullback 3-5%, but such a pullback in the market would be a buying opportunity for equities and a short-VOL opportunity. Again we refer to our longer-duration market internals such as the NYSE A/D line record highs, Down Jones Transports breaking above a trend-line and the MACD turn up from July 2019, as reasons to view any pullback as a bullish pullback.
Not everyone agrees with us, but not everyone has to. Like Carter Worth, Sven Henrich/Northmantrader has a consistently pessimistic/bearish outlook for markets, be it near or long-term. His latest missive suggest his heralded megaphone pattern formation on the S&P 500 doesn’t necessarily spell more upside for the benchmark index.
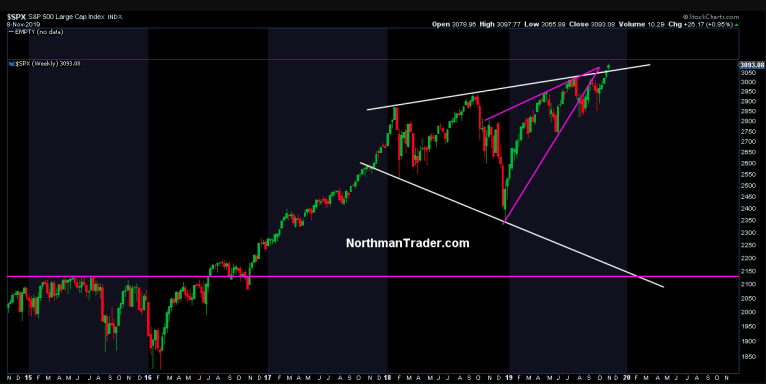
“Since the summer I’ve state clearly: For bulls to convince they need to break above the trend line, then successfully retest the trend line and then they can move onto the melt-up move if that’s what they want to do.
Does this confirm a breakout? From my perch the answer is no as no retest has taken place yet, and without such a successful retest risk remains that the breakout will prove to be false.
In Sven Henrich’s latest, bearish market breakout dismissal for cause, as he believes there to be cause, he also fashions the latest narrative pertaining to the VIX complex.
“And it is right here in this moment in time that VIX short positioning has taken on record proportions, exceeding even the previous record short right at the January 2018 highs right before holders of the doomed $XIV product got massacred as VIX exploded higher:
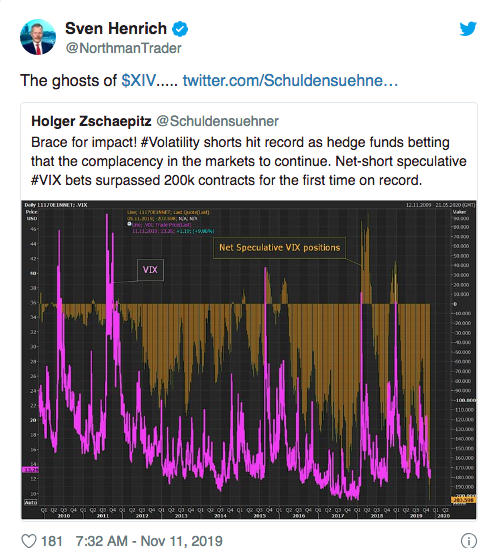
“With many participants celebrating the demise of the megaphone pattern they are doing so with $VTI not yet having exceeded the upper trend line and record short $VIX positioning in place. Perhaps it is not the megaphone that will experience megadeath, perhaps it will be complacent positioning.”
Also like Carter Worth, Sven Henrich’s track record for predicting market outcomes has been fairly awful, but for far longer than that of Carter Worth. Recall Henrich’s volatility warning in mid-March .
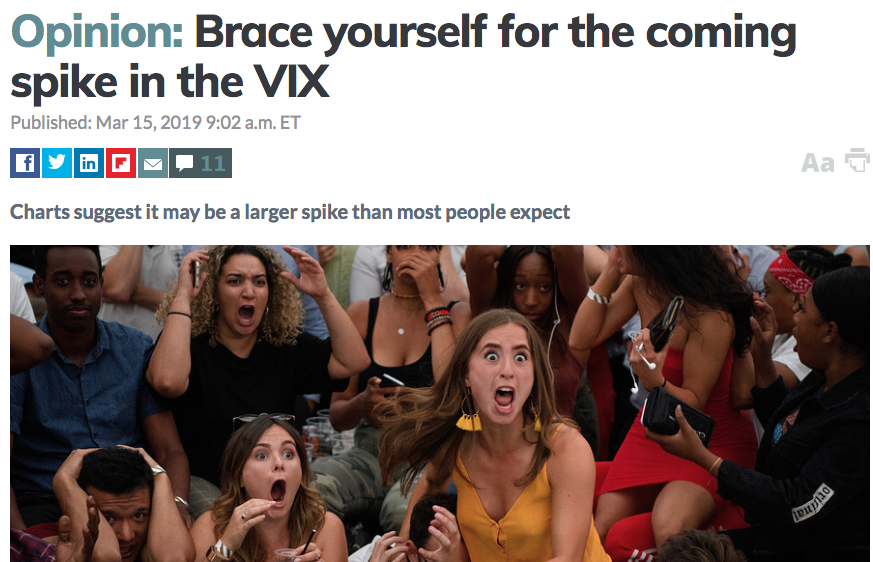
One would have been warned nearly 2 months too early before the markets began pulling back in Mid May with an uptick in volatility that barely held the VIX at 20 for more than a day. Nonetheless, Henrich warned of the VIX possibly achieving 50 based on his chart offering in the March narrative:
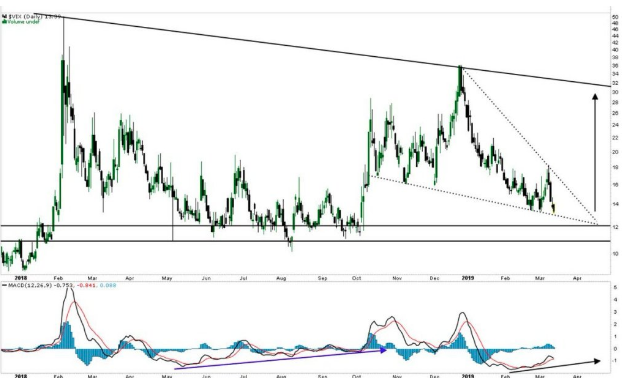
“This chart shows relative strength in VIX despite lower prices while forming a bullish pattern. It supports not only the notion of a VIX gap fill at 24/25, but perhaps a spike into the 30s. She also still has a pattern that suggests a potential run to VIX 50 coming.“
Sometimes, it’s not just about what a market strategist, analyst or general market participant is saying today, but rather what we need to know about what they’ve said in the past. If past is prologue….
We can’t predict what the President will say announce, declare or opine during his speech in New York City today, but what we can suggest is that the U.S. economy does not hinge upon his words today. The consumer serves as the basis of the U.S. economy and the consumer remains quite healthy. When engaging the consumer through an economic purview, there are mainly two considerations. Is the consumer able and willing to spend.
We know U.S. labor markets look good and consumer confidence seems to be strong. But a long run historical look at the University of Michigan Consumer Sentiment tells a more detailed story.
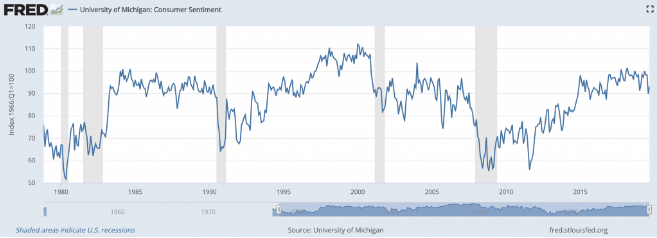
Remember, market sentiment and consumer sentiment can be two different things, depending on how we engage the data. According to DataTrek this cycle’s peak UofMichigan’s reading of 101.4 is well below the tops of the last 2 cycles (Jan 2004, 103.8, Jan 2000, 112.0). What has produced these lower highs you might ask:
- An aging population, more cautious than in their earlier lives, is one explanation.
- Then there is the slower pace of wage growth to consider, something that could weigh on consumers’ economic confidence.
- High levels of student loan debt could certainly hurt confidence among younger demographics.
- No matter the cause, sentiment readings that remain well below prior peaks (and not far from cross-cycle averages) as an important issue to watch.
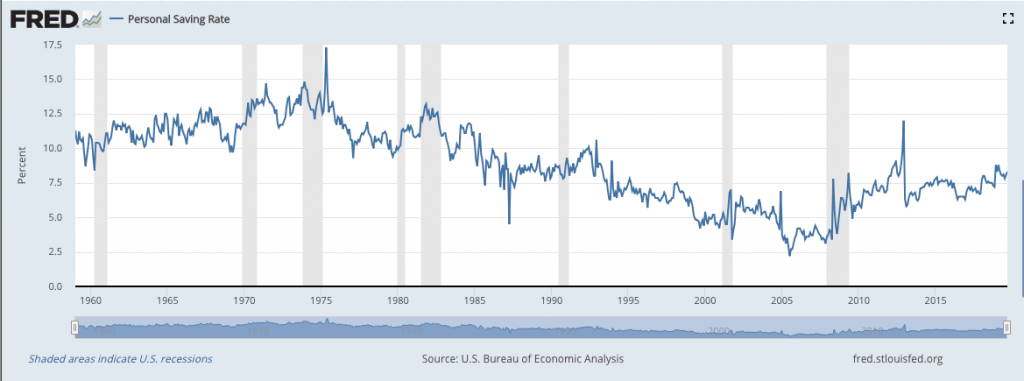
As for the relationship between “ability to spend” (labor market conditions) and “desire to spend” (confidence), we want to highlight that these two drivers of the U.S. consumer economy do not always move in tandem. Just consider that despite record low levels of American unemployment just now, “peak sentiment” was almost 20 years ago. Don’t dismiss this key statistic and what we’ve seen in the Personal Savings rate throughout this economic expansion cycle. As we’ve mentioned in the past, this is the first expansion cycle since the 1970s where the savings rate rose.
So even with the ability to spend, why hasn’t the willingness to spend created new highs in the UofMichigan Consumer sentiment index? Is it the unemployment rate? Let’s look at the trailing 2-year correlations of changes in U.S. unemployment relative to changes in consumer sentiment from 1978 to 2019.
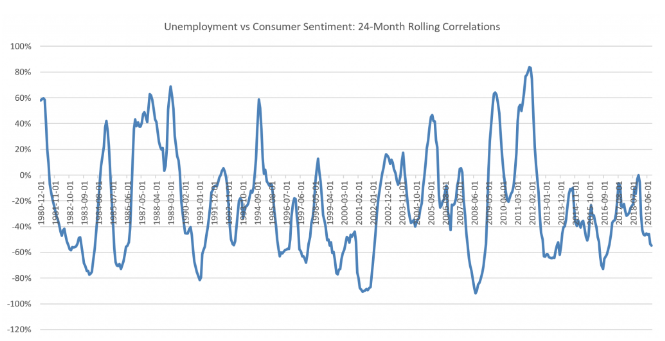
- High correlation levels (+0.6) between falling unemployment and rising consumer sentiment generally occur early in an economic cycle. This occurred in 1980, 1994, 2009 and 2011. The only exceptions were in 1987 and 1989.
- Past those periods, falling unemployment has no noticeable impact on consumer sentiment. In fact, the average 2-year correlation between changes in employment and sentiment from 1978 – present is actually negative 0.2.
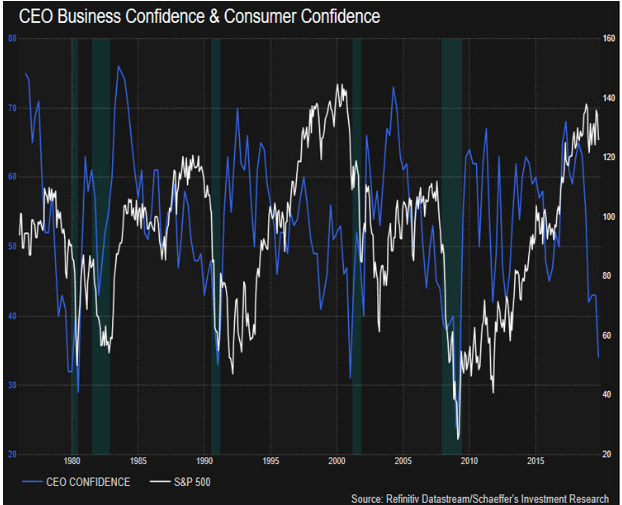
From the DataTrek study, it’s clear that late cycle expansion don’t find a correlation between the unemployment rate and consumer sentiment. Who would of thunk it, but the data doesn’t lie. The following chart of CEO sentiment and Consumer Confidence is equally lacking correlation.