
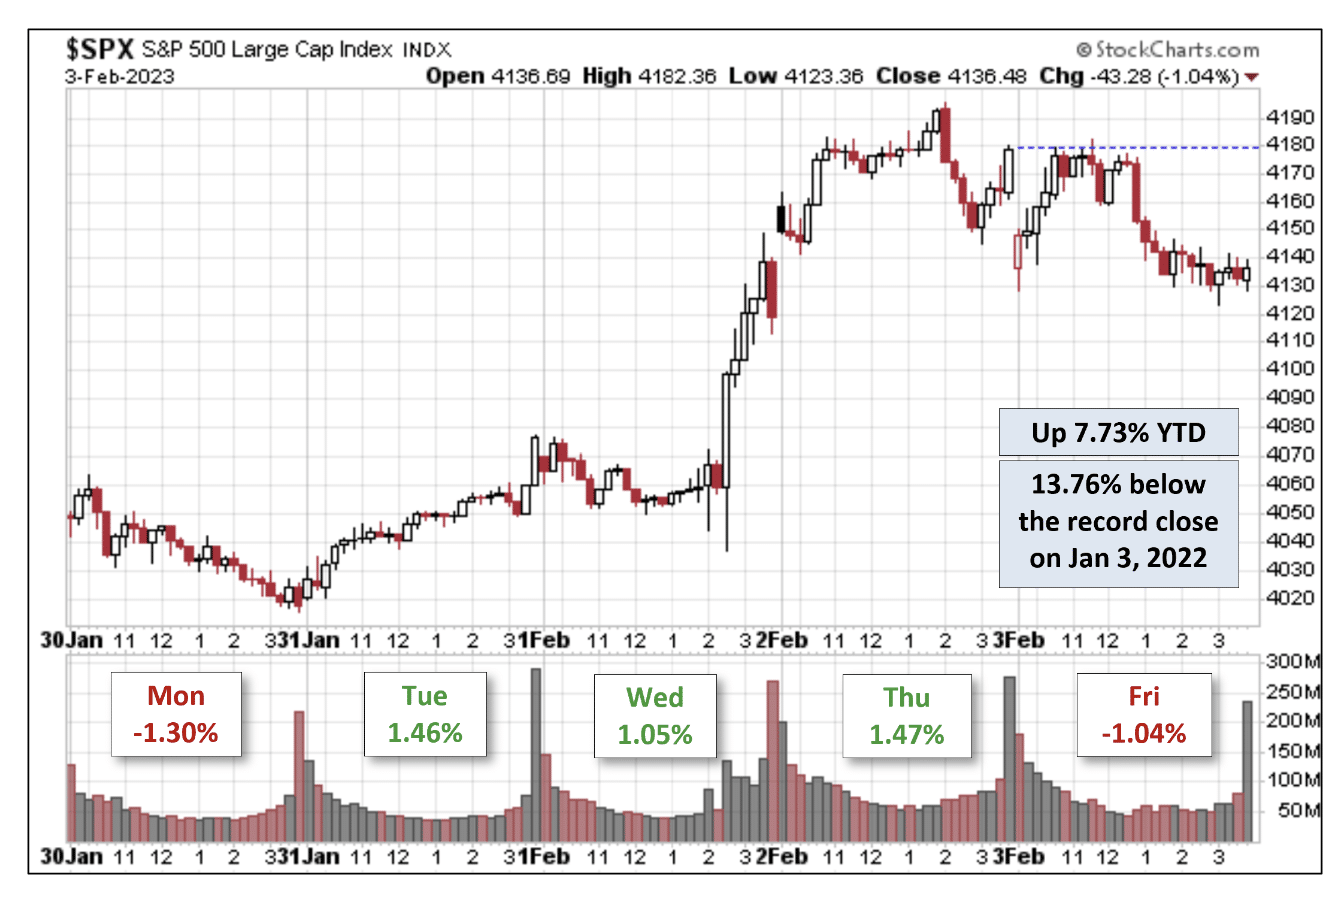
Welcome back traders and investors. This past trading week was jam-packed with optimism, but it ended on a sour note with respect to price action. Animal spirits were seemingly trampling the market landscape until they were beaten back a bit with a greater than 1% pullback for certain of the indices on Friday. Whether or not Friday’s pullback is the beginning of a larger pullback remains to be seen, but is also likely front of mind for most market participants. After a stifling hot January return for the S&P 500 (SPX) and Nasdaq (COMPQ), there are a great many market participants demanding a cool down period of sorts.
At Finom Group, we believe the probability of an interim consolidation/pullback period would prove healthy for markets, allowing those who failed to get on board with the New Year uptrend to do so. Markets don’t go up in a straight long for lengthy periods of time. Consolidation periods are indeed healthy for markets after significant rallies. The most important and relevant aspect for the coming week’s equity market performance is what an investor does with any such price/time consolidation. So let’s hear from our chief equity strategist Seth Golden, on the topic of market consolidation:
“It’s rare to know precisely when a pullback is going to take place, other than hoping individual breadth and/or momentum stochastics are suggesting overbought conditions. But even these overbought conditions can be sustained for longer than most care to consider, and often do in strong market rallies. Having said that, what an individual trader/investor does with a pullback after strong rallies should lean heavily into the composition of the rally leading up to the potential pullback. If breadth thrusts were achieved during the rally, if key levels of resistance have been overcome, if most stocks are trading above their long-term moving averages, if most sectors within the index are above their 200-DMA, and if the sentiment is contrary to the rally’s bullishness, these are all signal posts suggesting the pullback is a great opportunity to add market exposure. I guess if there is anything for a savvy trader or investor to takeaway from their studying of “market internals”, it is how to confidently engage pullbacks with buying activity.”
Thank you for the welcoming words Edward, and creating the space to entertain the idea of how traders/investors should manage their game plan through uptrends, recognizing that most uptrends will be peppered with pullbacks. Confidence will be the goal of this weekend’s reporting and analysis, trading a pullback with confidence. After all, if one thinks they’ve missed a big move in a stock or sector already in the New Year, a pullback in the markets may bring that opportunity back into scope. If that should come to pass; DON’T MISS IT TWICE! If you don’t know what “all caps” means by now, better ask somebody!
I feel like we’ve discussed the market internals/breadth quite often here in the New Year, as well we should. In order to DEFINE a trend, the starting place is market breadth, which has been quite strong in 2023 and a welcome change from 2022. We recognize strong breadth as the hallmark and proof-positive that a new bullish trend has developed. Our jumping-off point if you will. All other manners of technical analysis will prove tangential, confirming that which breadth has already confirmed, but also lending additional details for the sake of investor education. Technical analysis is so very difficult, and anything but “science”. It’s more an art form, and open to subjective biases, than fundamental analysis. What I see and what you see in a chart can often be very different. What we conclude from what we see in the charts, therefore, is likely to differ as well. Nonetheless, it is a time-tested discipline that I encourage all investors to study, again, for the sake of trading and investing with confidence.
If I were to ask you today whether or not you would buy the market Monday morning on a “gap down” of 2%, would you or would you not, and why? The answer should come from one’s understandings about market breadth, and what history informs about forward S&P 500 returns with such market breadth conditions. Market breadth considers the majority of investors’ sentiment and/or actions related to price, and price further informs of that sentiment correlated to the macro-environment. So if the subconscious consideration is “a recession and earnings“, breadth has already spoken to such concerns. Get it, breadth, speaking?
You might think that sounds offsides, but a fundamental principle of investing is an understanding that market prices are forward looking, not representing present day macro-economic conditions, but conditions well out into the future. If we look back on 2022 and carry that to the present day, the S&P 500 devalued price action informed of an economic slowdown predicated on higher inflation rates that would impair the earnings potential for S&P 500 companies. Again, if we fast-forward to the present day, we can validate what the S&P 500 price action was predicting/leading, a slower or possibly even a decline in earnings for first half of 2023.
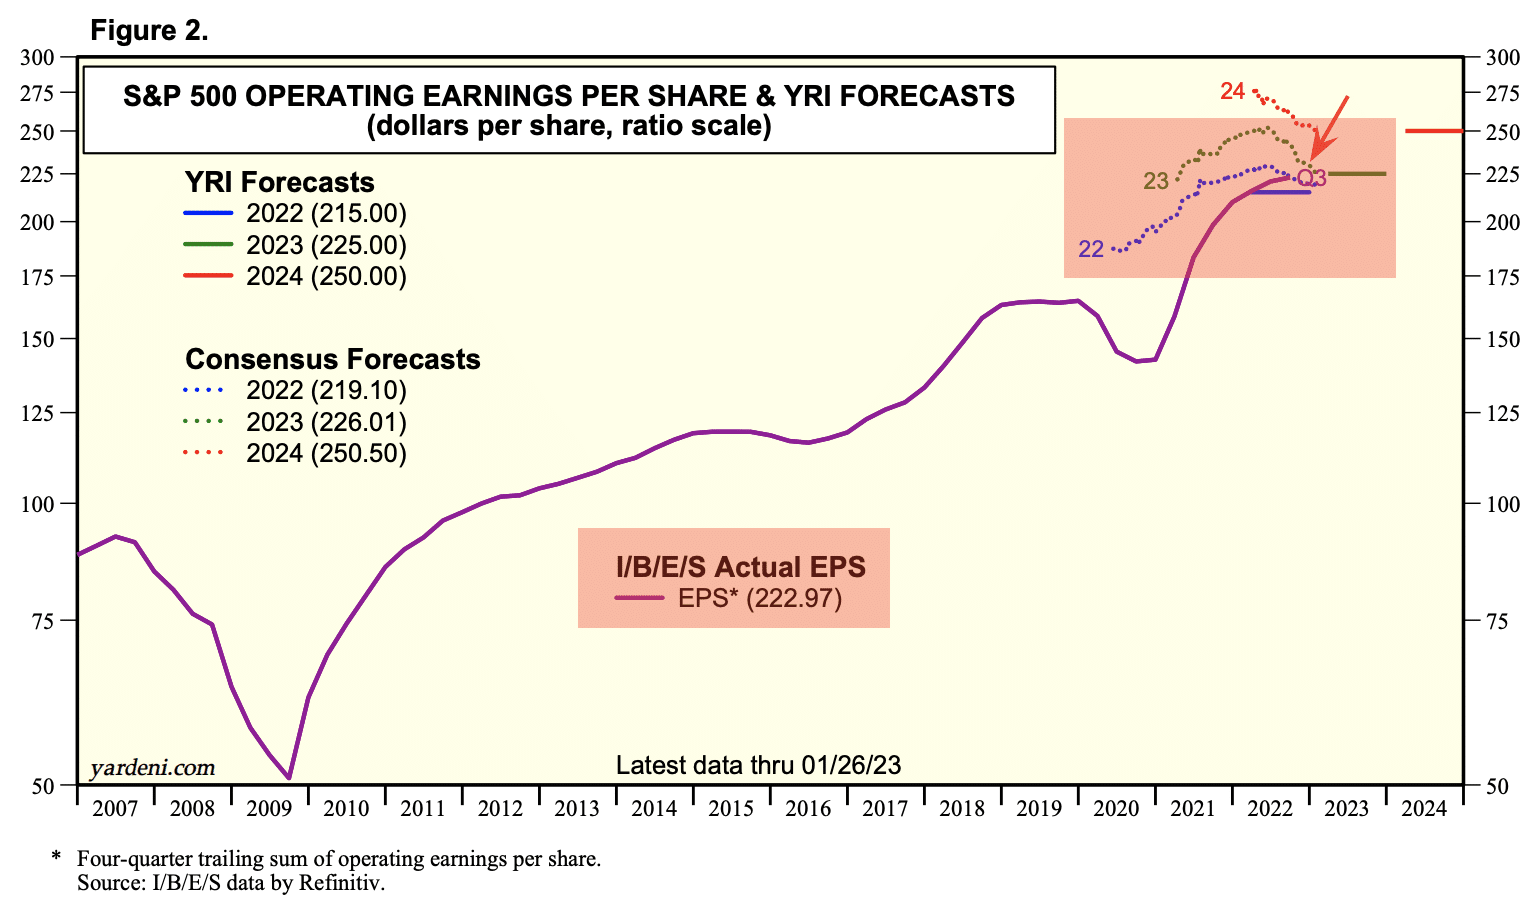
As we can see in the chart of S&P 500 EPS above (Yardeni Research), the red boxes identify the trend in 2022 and 2023 EPS estimates. In mid-2022 they both peaked and rolled downward, for which these annual estimates have continued to fall. The “Actual EPS for 2022 is coming in better than Consensus Forecasts (left side column), but both the Consensus and Actual EPS have been trending lower since mid-2022. Even though the 2022 EPS will likely have grown on a YoY basis, the S&P 500 declined nearly 20% for the year. The funny thing is, 2023’s EPS Consensus Forecast is still pointing to YoY growth. We’ll know for sure what the 2023 EPS Consensus Forecast is once earnings season concludes in a couple of weeks. But for now, what we can conclude from the chart of EPS forecasts is that investors were pricing in an earnings recession for 2023, based on the prevailing macro-economic sentiment. The majority of economists and market participants had been pricing a 2023 economic recession.
You should be able to discern by now that we are combining disciplines in the early portion of this weekend’s report in order to better analyze technicals and fundamentals, ultimately to better define market outcomes into the future. I’m of the opinion that in doing so, we can justify the bullish trend, albeit nascent for early 2023. So let’s continue the process of validating the forward discounting mechanism of the stock market. Recall this chart of the S&P 500 compared, not correlated but compared, to the ISM Purchasing Manufacturer’s Index (PMI)?
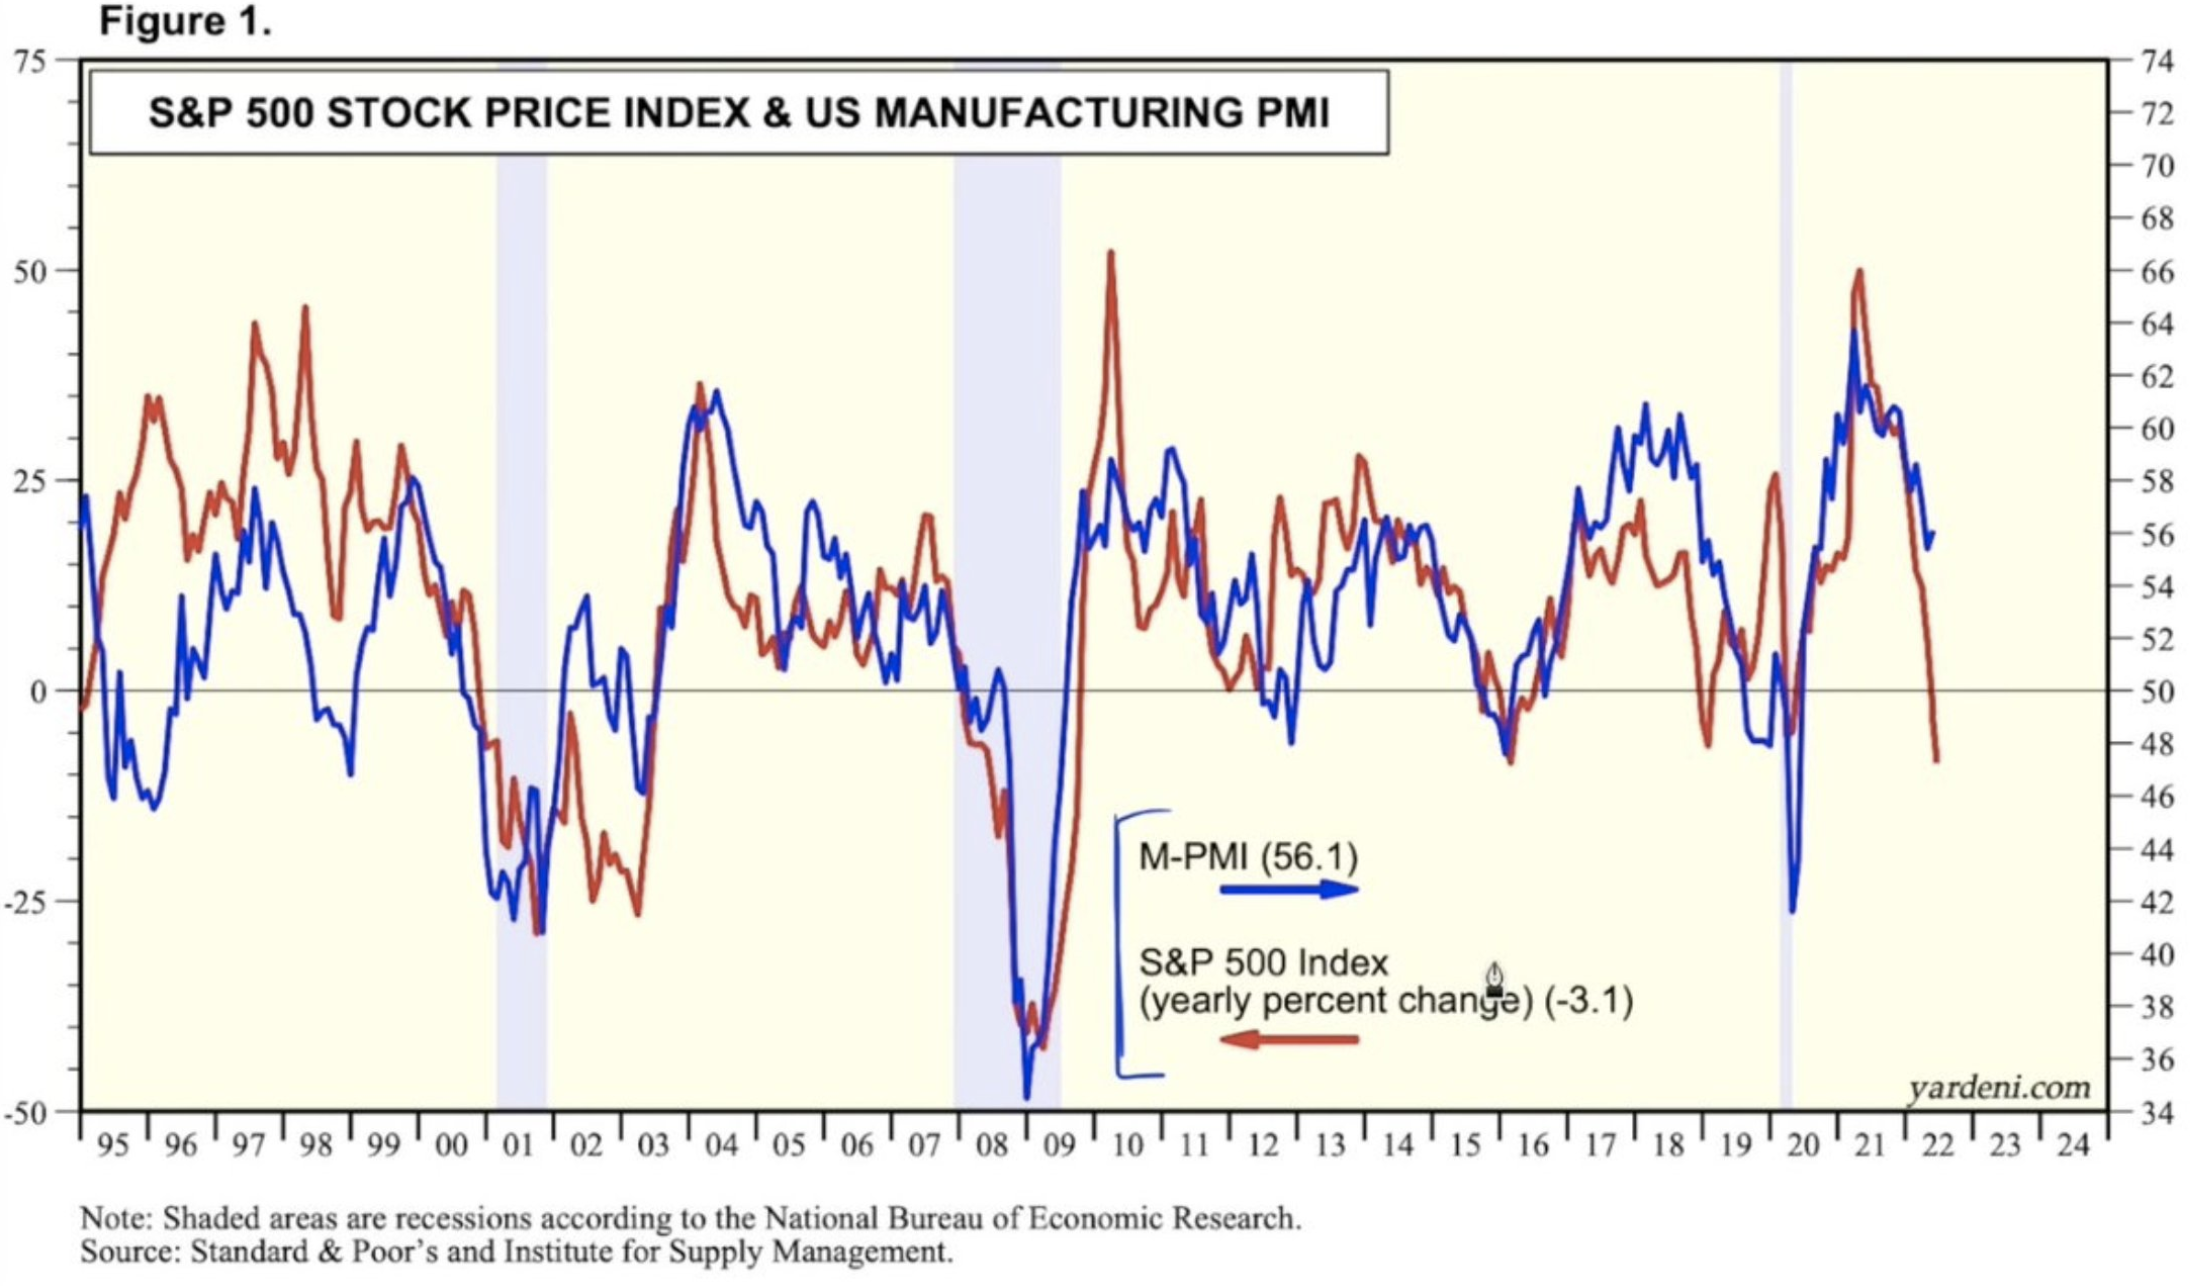
The chart was taken from July of 2022. As we can see, the S&P 500 (red trend line) had dropped significantly more than the PMI (blue trend line). The PMI had reached extremely high levels, consistent with the booming economic rebound from 2021 into early 2022. Once it began to descend from such extreme levels, the S&P 500 recognized it would continue through the back half of 2022, and began the process of forward discounting PMI declines. Below is the same chart, but in December of 2022:
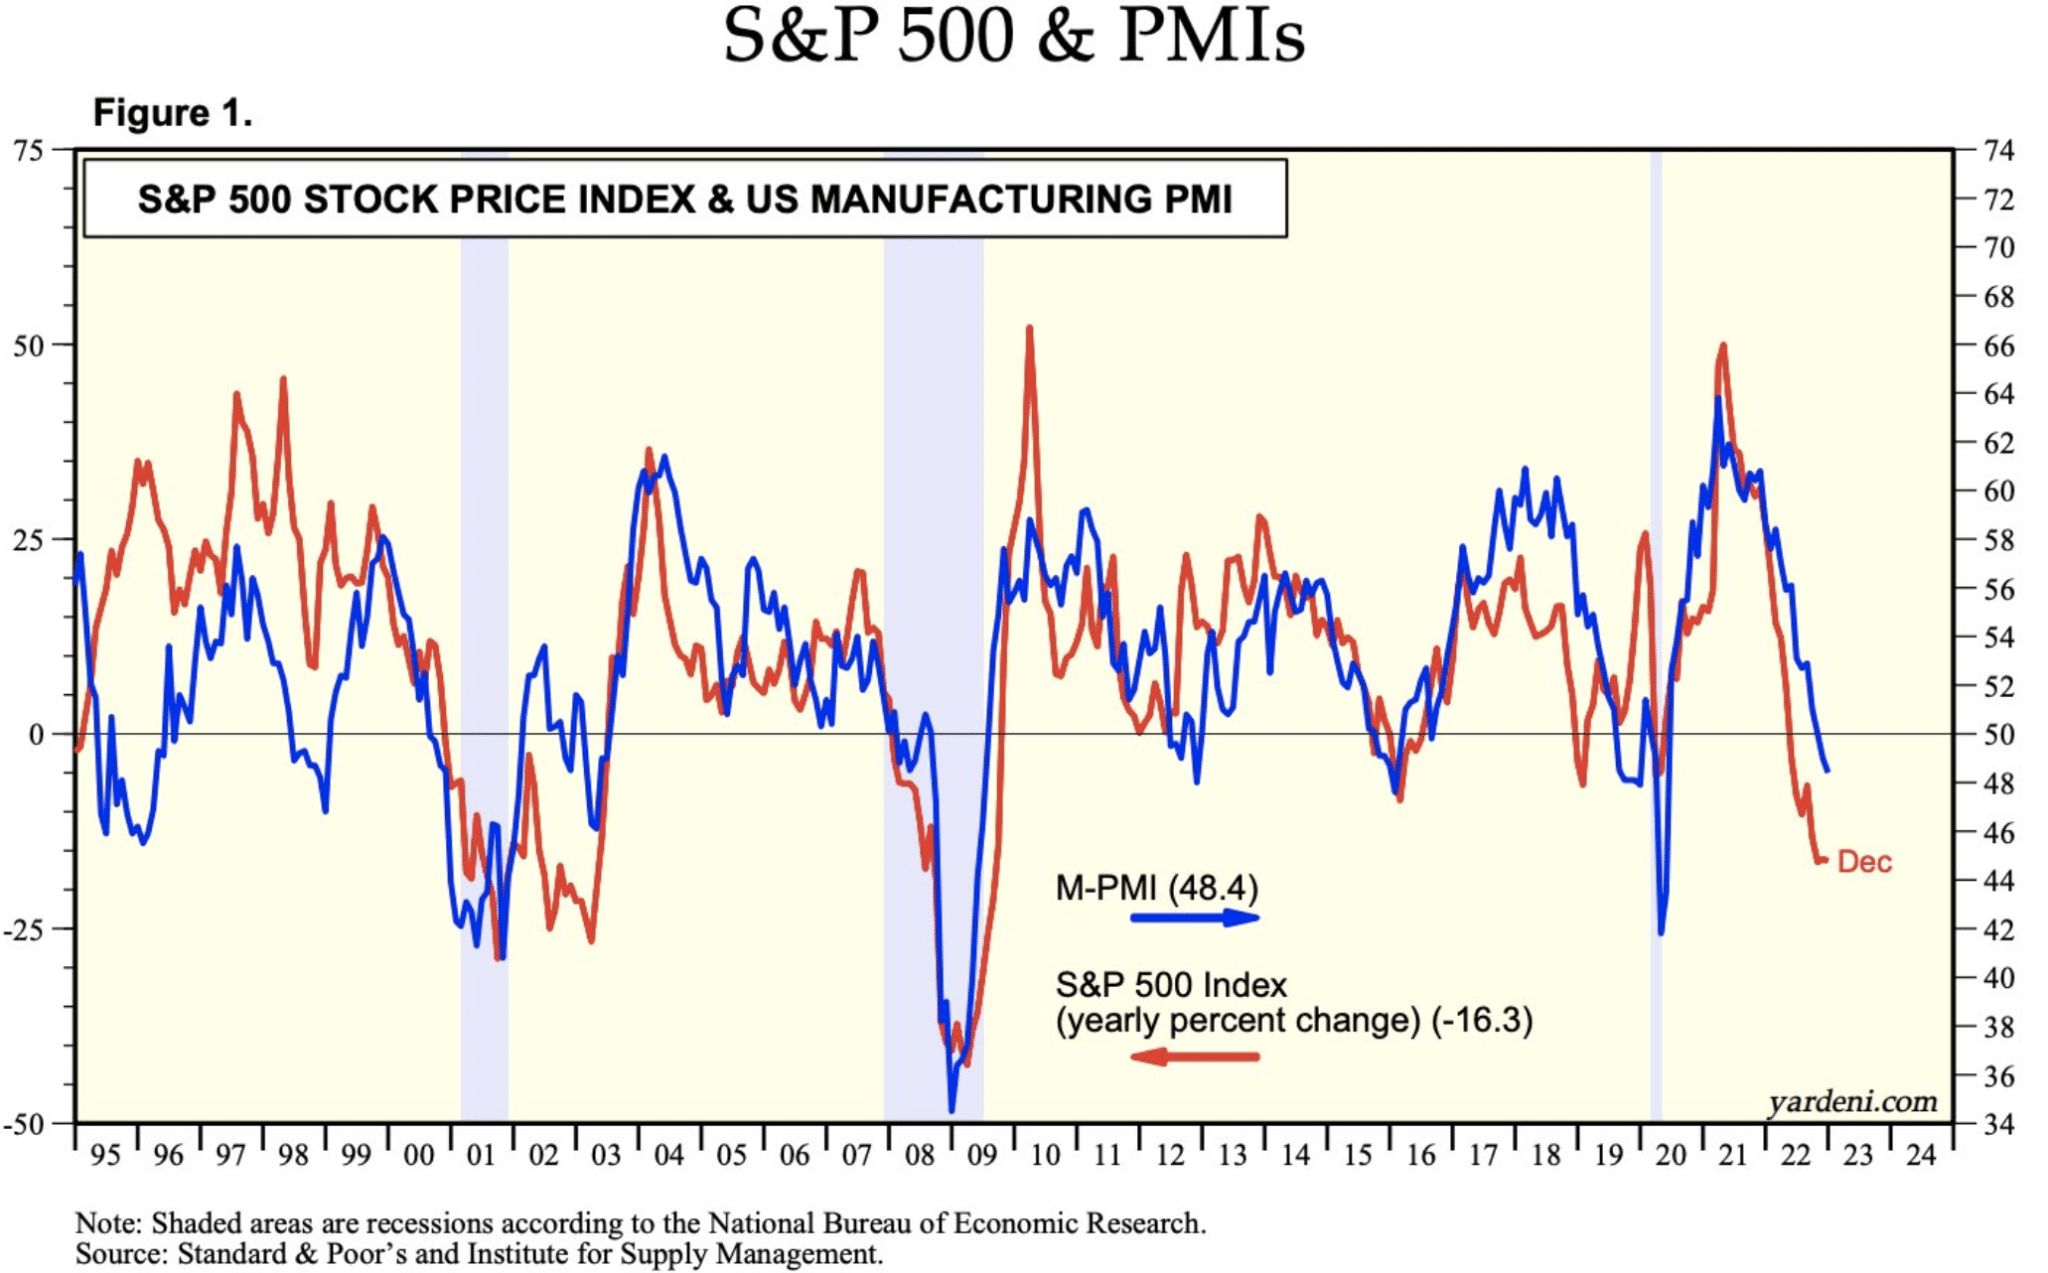
We can see from this December 2022 chart performance that even though PMIs had broken below the 50 level, the S&P 500 had stopped falling. This may have been the early signal for where the stock market began the process of pricing in a rebound in PMIs and the economy for 2023. There is no textbook definition for how many months or quarters forward the S&P 500 is discounting the future, making it all that more important to assuage oneself from trying to time the market, but the type of analysis we are performing here helps to guide an investor’s expectations. A commonly accepted future discounting of the S&P 500 is at least 2 quarters or 6 months. The big picture in the chart above is that the 2 metrics travel a similar path over time, and therefore, prove a good guide or signal post for investors when considering capital allocation. Now, a final chart of the S&P 500 and PMI that brings us to February 1, 2023:

It is quite obvious that the S&P 500 (curled up) is discounting a future trough and rebound in the PMI, within the coming 6-month period, at least ✅. Based on the history of the 2 metrics, we might conclude a near-term bottoming in the PMIs, consistent with avoiding a hard landing in the economy and possibly buffering the downside in EPS for 2023. Buffering a downside in EPS for 2023, what do you mean? The following chart pulls this analysis and forward-looking statement together:
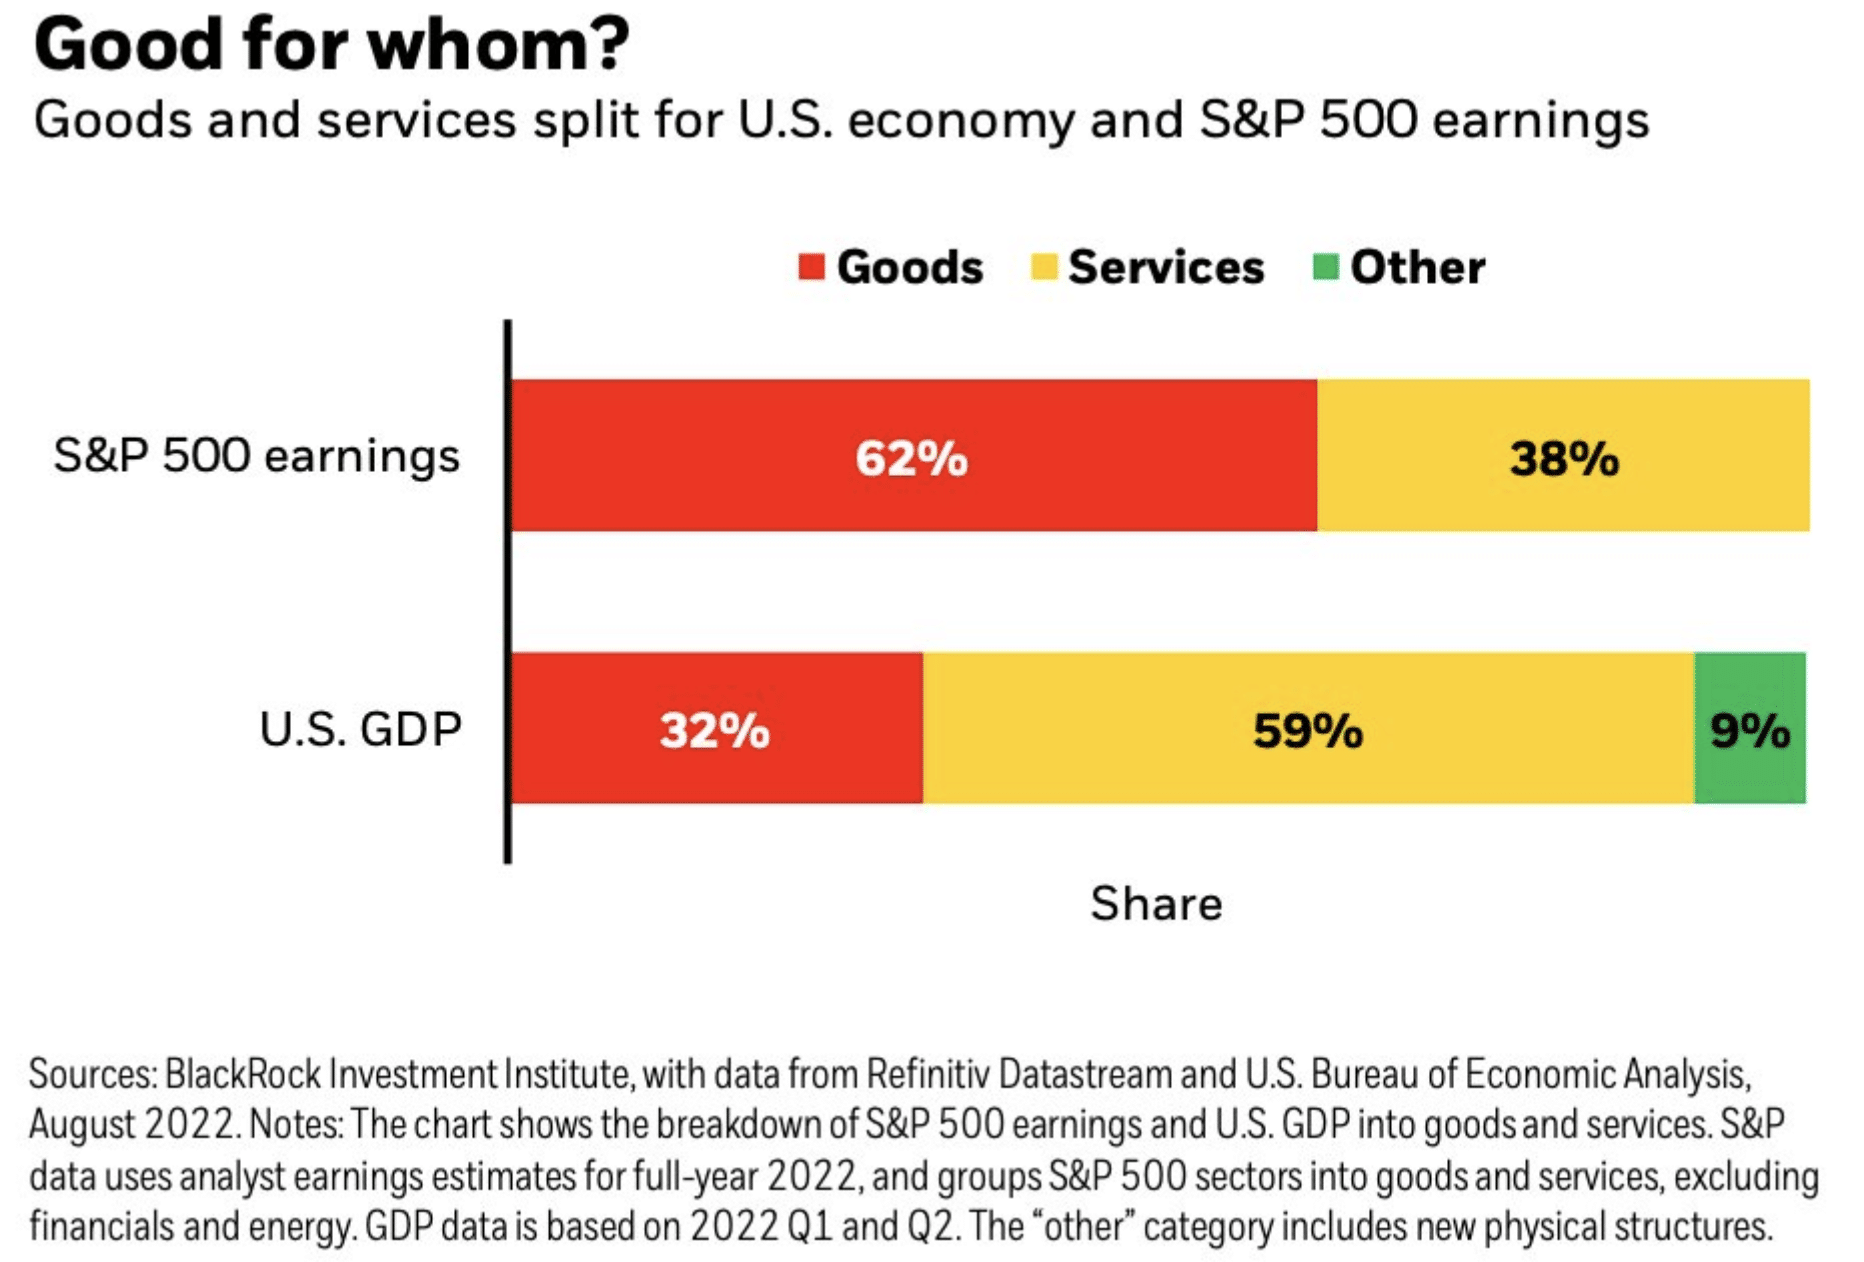
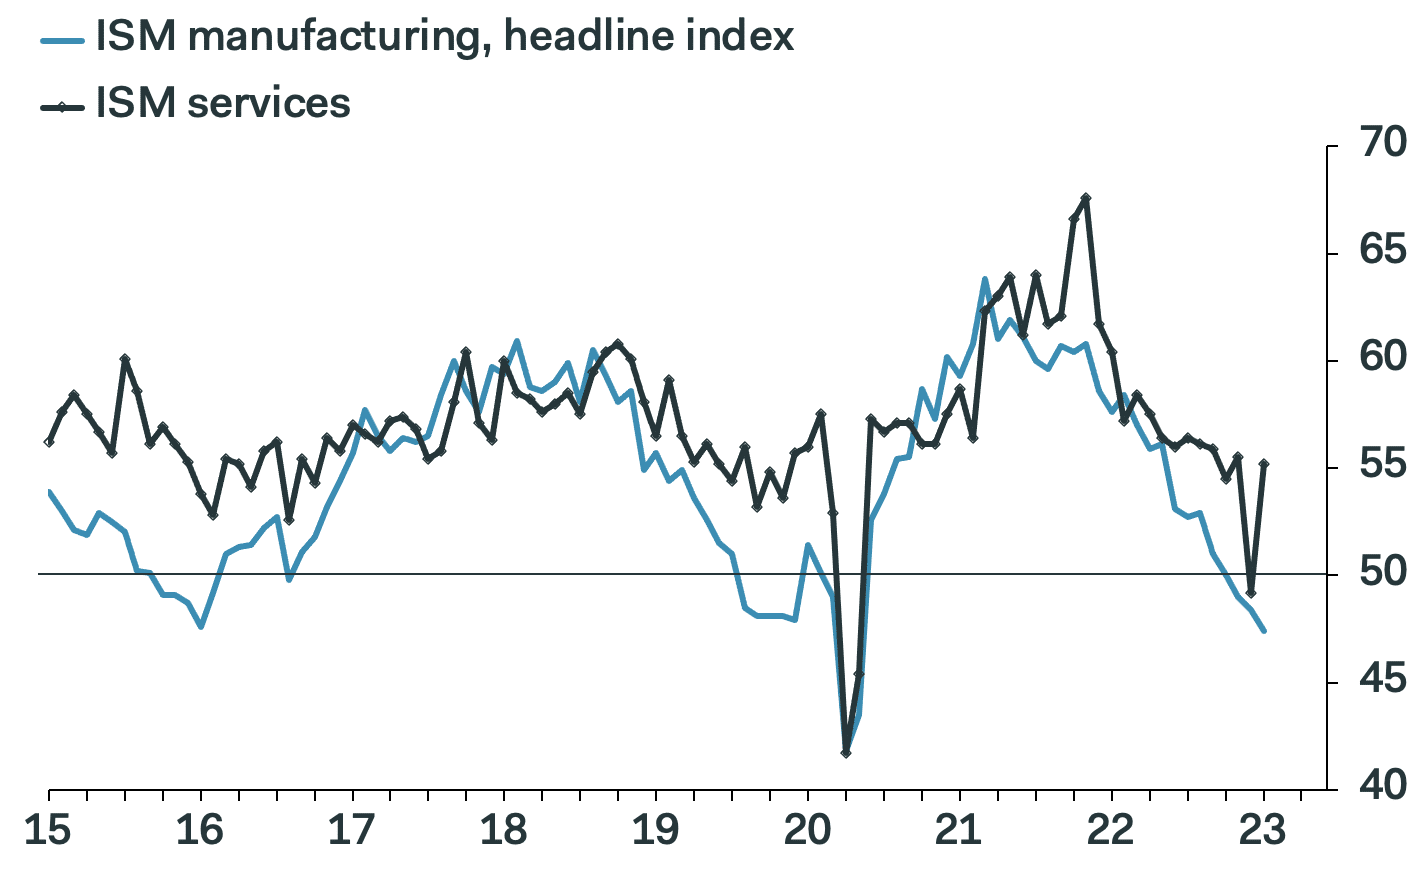
The BlackRock table above recognizes the Goods, Services, and Other portions of the economy, as well as their contribution to S&P 500 Earnings Per Share/EPS. According to the data, Goods are a small portion of the economy, but a majority (62%) of the S&P 500 EPS contribution. Hence, the focus on the aforementioned S&P 500 vs. Manufacturing PMI trend relationship. So when the S&P 500 was discounting a contraction in Goods Manufacturing, it was definitively discounting EPS growth potential in the future, and now that the S&P 500 has begun an uptrend, we can conclude it is discounting the pending trough and rebound in Goods PMI and its EPS contribution. Hence, the aforementioned statement, “Buffering a downside in EPS for 2023.” To conclude, the hard landing camp would need to see a mis-pricing by the S&P 500, which is historically unlikely, but also what may have taken place in 2022 by way of a -20% annualized decline, correcting that potential mis-pricing to some degree here in 2023. But what this further suggests is that the burden of proof has shifted from the bulls to the bears in 2023. The data going forward would have to prove out a continued bearish thesis, which is seemingly unlikely given what we have seen in the labor market, services industry and recent U.S. auto sales. With regards to the Services PMI that recently, also plunged into contraction territory, this week’s monthly reported ISM Services PMI made a complete U-Turn! ⤴️ The surge in the ISM Services Index is far larger than the regional Fed survey data implied, and marks a near-full reversal from December’s plunge. Here is how Pantheon Macroeconomic outlined the recent Services Index surge:
“We were worried that December’s plunge would prove the beginning of a sudden and sustained lurch downwards, following a broadly flat trend over the preceding six months. But January’s upside surprise makes December look more like a temporary departure from that flat trend, perhaps due to winter storms towards the end of December temporarily depressing activity. By contrast, January was unusually warm, and that won’t persist, either. Our base case is that activity in the service sector will soften from here, but not collapse.
The bulk of the improvement was in the business activity index, which rose nearly seven points to 60.4, and new orders index, up a whopping 15.2 points to 60.4. That leaves both indices only down marginally year-over-year, which seems unsustainable given the 450bp of Fed hikes. Add to that the rundown in excess personal savings accumulated during the pandemic, which currently stand at roughly half their $2T peak, and it’s hard to see the apparent exuberance among firms in the service sector lasting much longer.”
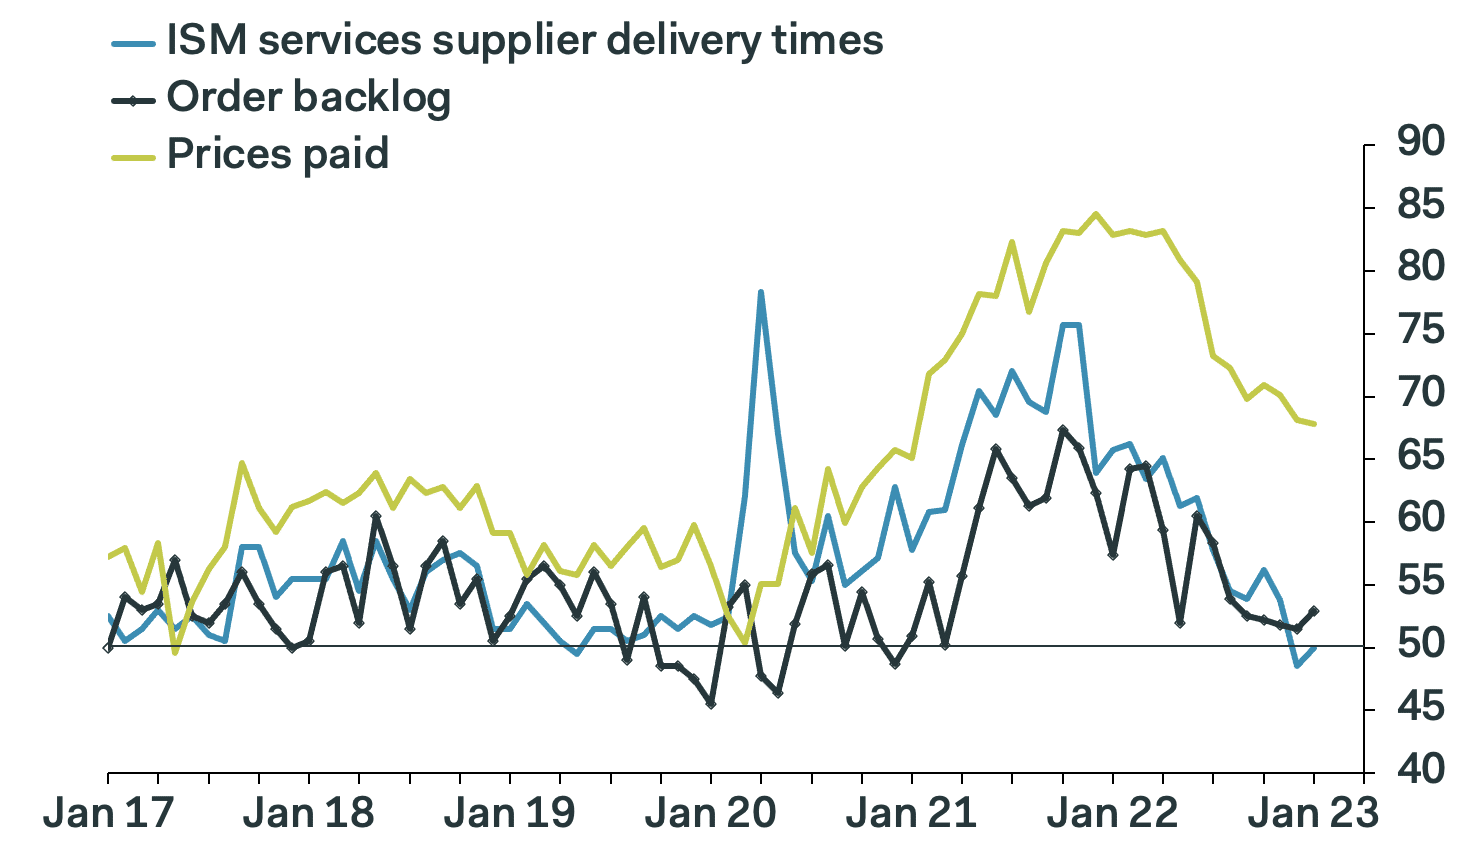
The prices paid component of the index fell for the fourth straight month, to 67.8 from 68.1, but remains elevated by past standards. The good news is that the supply chain components of the survey suggest that conditions have largely normalized already; the supplier deliveries and order backlog components ticked up in January, but have been broadly back to pre-Covid levels for several months now. The big picture here is that disinflation is currently underway in the services sector, despite the Fed’s protestations, and will merely accelerate if the labor market weakens as we expect in the months ahead.”
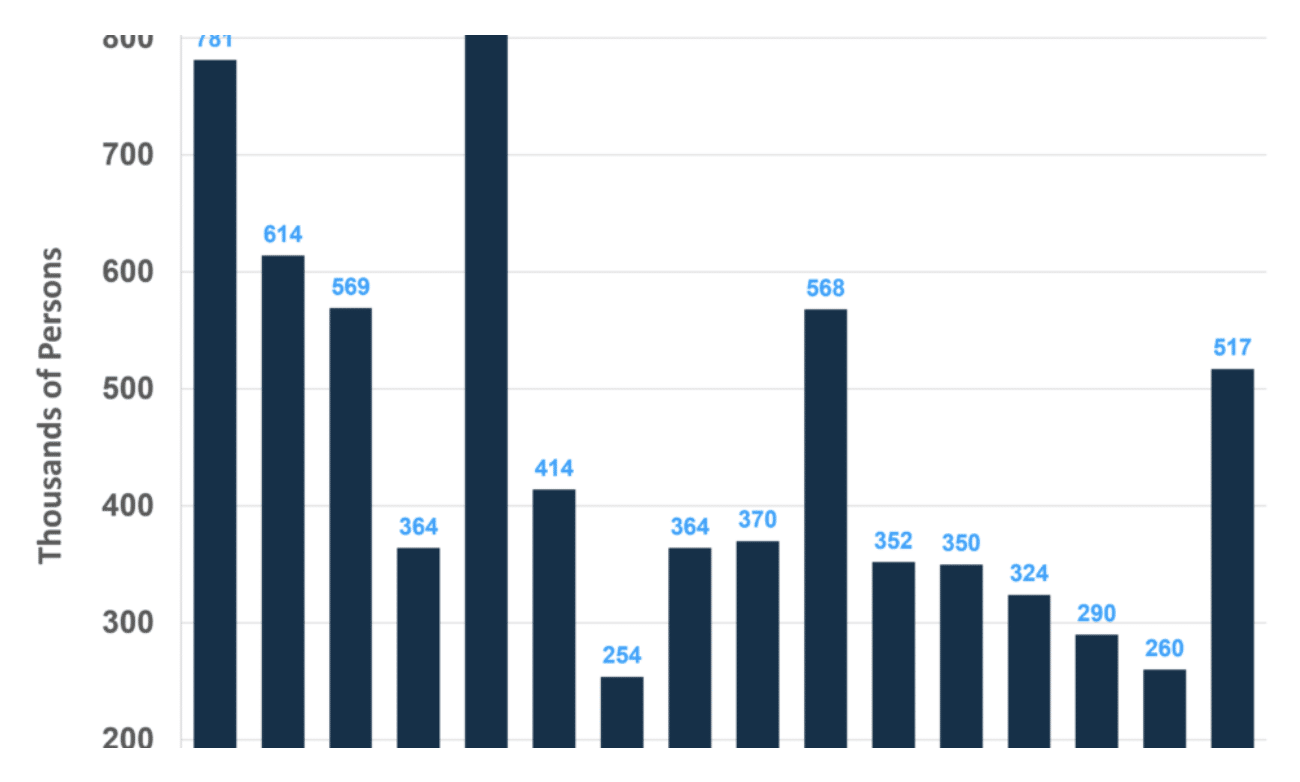
Lastly, we had mentioned Auto Sales as providing strength to the recent economic performance in early 2023. Wards Auto released their estimate of light vehicle sales for January: U.S. Light-Vehicle Sales Record Fifth Consecutive Increase in January.
Wards Auto estimates sales of 15.74 million SAAR in January 2023 (Seasonally Adjusted Annual Rate), up 17.6% from the December sales rate, and up 4.2% from January 2022.
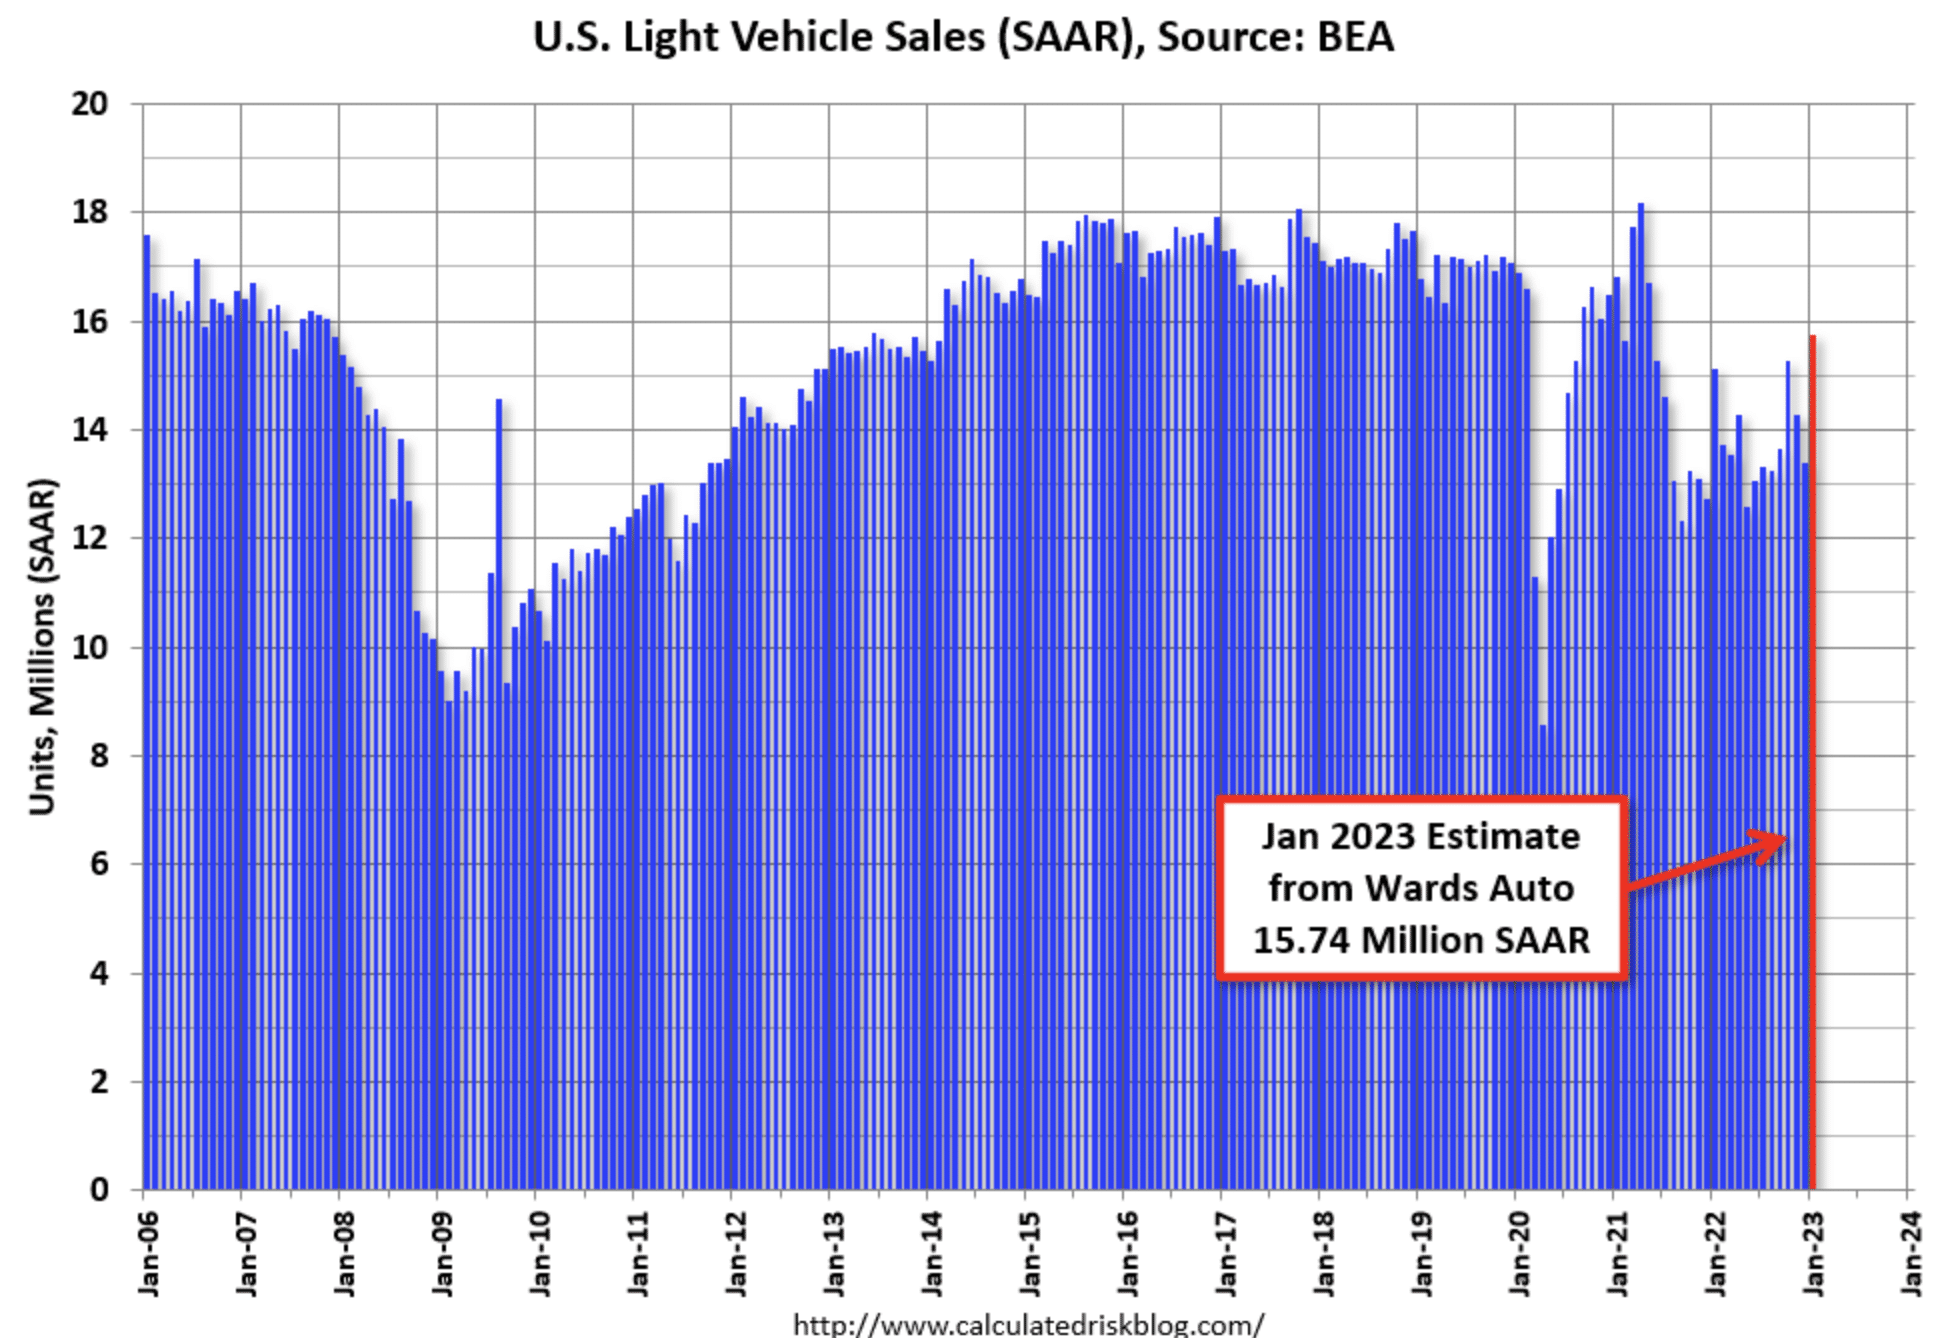
As shown in the chart of Light Vehicle Sales above, the January estimate represents a sharp rebound from the prior month and the highest monthly reading in more than a year. This activity is likely a byproduct of improved supply as well as lower APRs for the consumer.
And jobs, jobs, jobs! The economy created 517,000 jobs in January, well above expectations for a slowdown to 175,000. It was a blockbuster-blowout Nonfarm Payroll report.
After climbing to nearly 3.8% 2 months ago, the Unemployment Rate has plunged to 3.4% in January 2023. The Unemployment Rate is at its lowest level since 1969. For those of you whom are Bryan Adams fans 😉. We have been paying closer attention to the Unemployment rate as it has been a strong signal for an impending and near-term recession. (chart below from Carson Wealth Group)
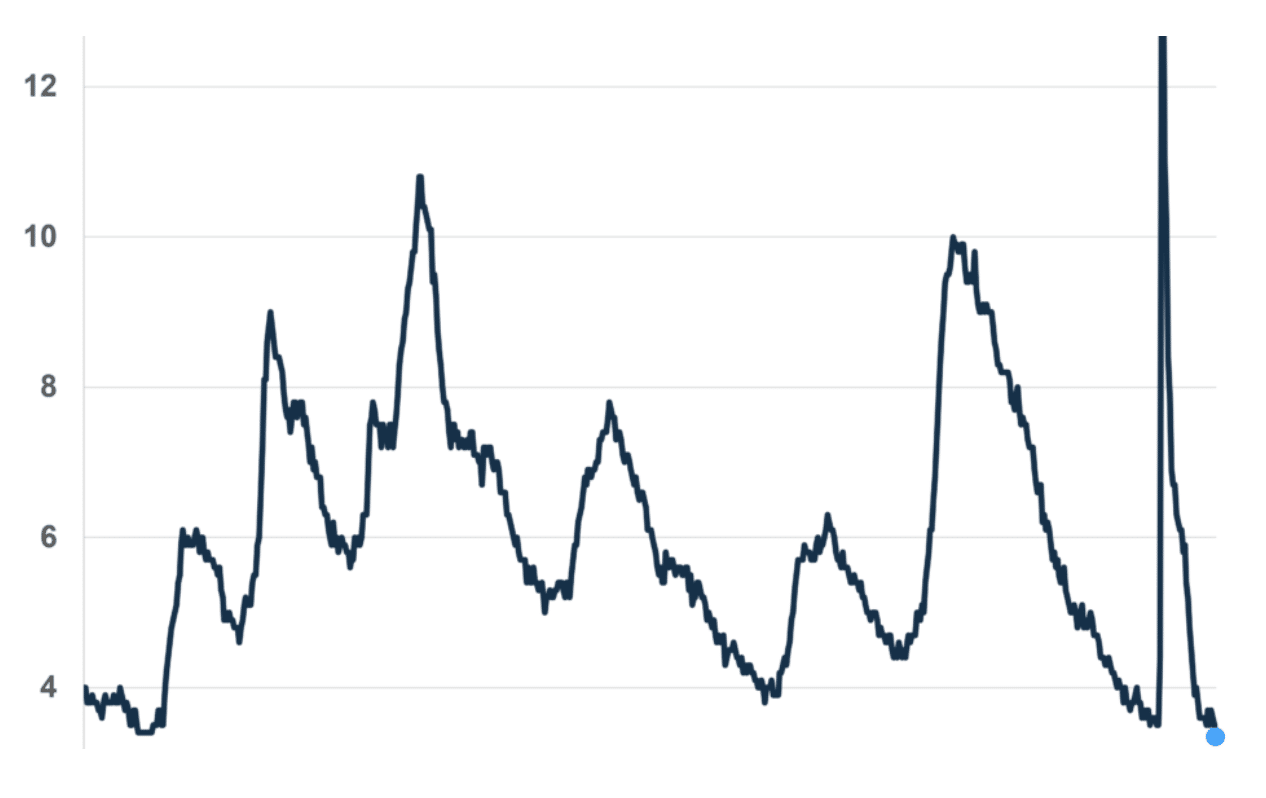
As a reminder, historically when the Unemployment Rate ticks above its 12-month moving average, a recession has been declared within months of the occurrence. The current 12-month moving average is 3.8% for the Unemployment Rate. For the sake of refreshing the data and analysis, with visual aids, here are our notes from within Finom Group’s Research Report on October 9, 2022:
“In contrast with the absolute level, the trend in the unemployment rate, the direction that the rate is moving in, is a coincident indicator of recession, and can sometimes even be a leading indicator. As the table below shows, in each of the 11 recessions that occurred since 1948, the trend in the unemployment rate turned higher months before the recession began. The average lead for the period was 3.45 months.

Admittedly, the phrase “turning higher” is ambiguous. We need to be more precise, and so we’re going to define the phrase in terms of trailing moving averages. That is, we’re going to say that the unemployment rate trend has turned higher whenever its current value crosses above the moving average of its trailing values over some period, and that the unemployment rate trend has turned lower whenever its current value falls below the average of its trailing values over some period.
In the following chart, we plot the unemployment rate alongside its trailing 12 month moving average from January 1948 to January 2016. The red and green circles delineate important crossover points, with red crossovers delineating upward (bearish) turns, and green crossovers delineating downward (bullish) turns: (bear/bull in market performance terms)

As you can see, historically, whenever the unemployment rate has crossed above the moving average, a recession has almost always followed shortly thereafter. Similarly, for every recession that actually did occur in the period, the unemployment rate successfully foreshadowed the recession in advance by crossing above its moving average.”
The good news; we are further from the 12-month moving average of the Unemployment Rate today than back in October 2022, again putting the onus for a hard-landing squarely on the pundits and bearish camp. 🎯
You’ve often heard me say, “You can have all the data in the world, but if you can’t sequence it properly, the data lacks purpose and/or utility; it’s worthless to the individual.” Every word above, from the start of this week’s Research Report, is an exercise in sequencing the data, and we believe… properly! We also believe the latest round of economic data pushes the probability of a recession further out, than many economists have forecast. Having said that, we should recognize the fluidity of the data and unprecedented circumstances surrounding the global economy do not lend well to forecast optimization. Remain flexible and openminded with respect to future economic data and outcomes.
Moreover and not to overshadow the main point of combining our previously reported technical analysis with today’s fundamental analysis, and by all accounts, we believe the breadth that has led price (as it should historically), which further discounts economic/earnings outcomes, has been validated by all of the analysis above.
So What’s Under The Hood?
It would be commonplace to consider Friday’s price action to spur more price consolidation in the days/weeks ahead. As investors/traders, we can only speculate and attempt to surmise the probabilities of price consolidation. Nobody, and I mean nobody, no matter how hard they profess to KNOW, can know with any certainty how deep or long a pullback can/will last. Nobody! All we are trying to do as investors/traders is to define the probabilities within reason.
With the aforementioned in mind, let’s start with the broadest of breadth and momentum indicators, the NYSE Summation Index (NYSI). The NYSI has come a long way through 2022’s lows to the recent 2023 highs, above 1,100 to end the week. This is an expressively strong level and signal, as we’ve previously outlined.
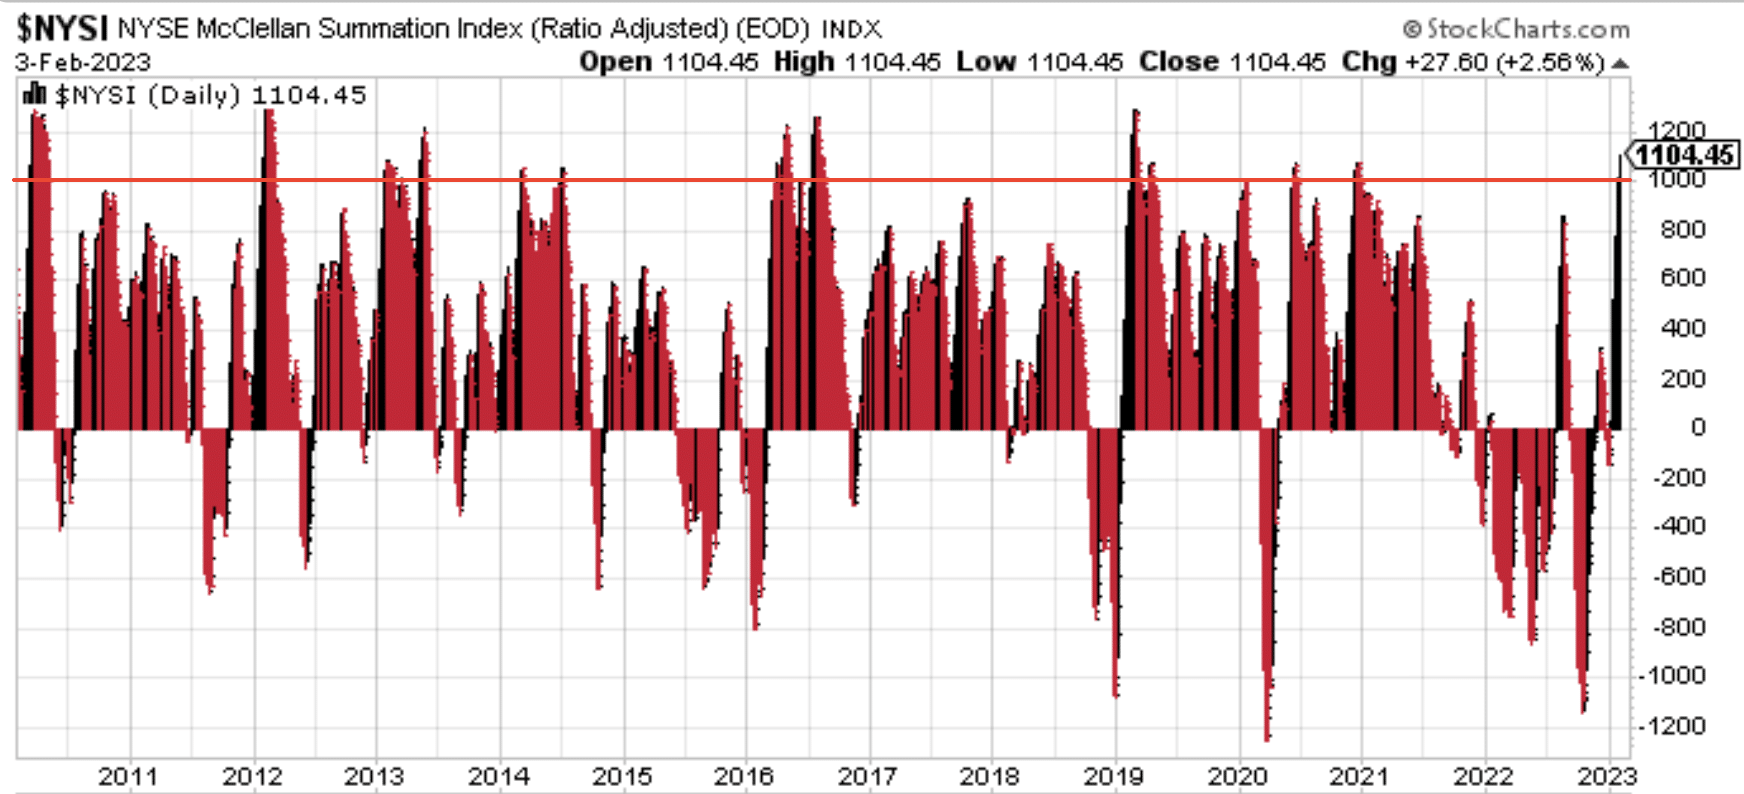
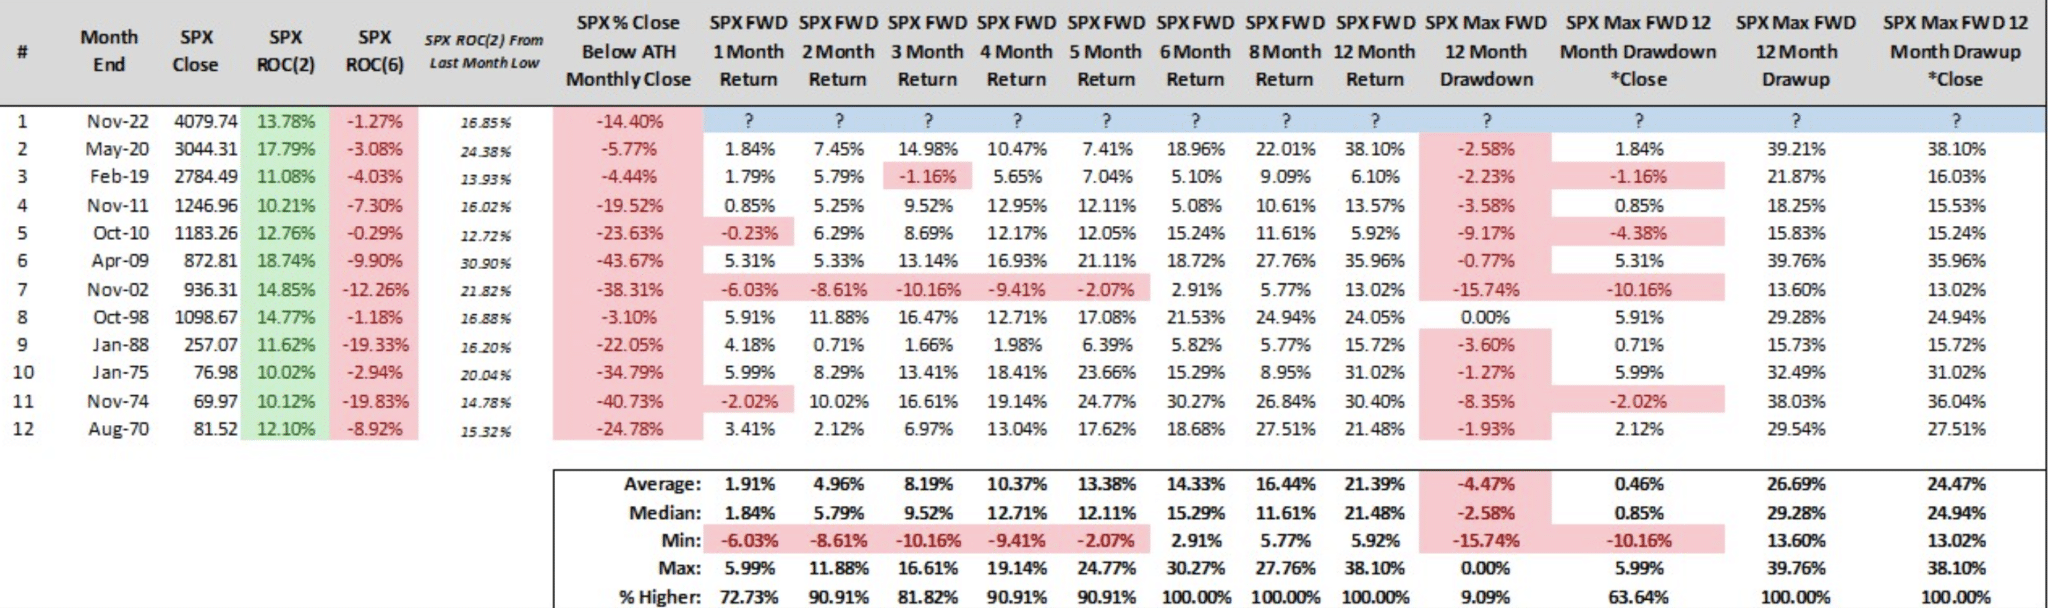
The NYSI got above 1000 and the chart above goes back to 2010, evidencing the power of the signal each time the NYSI rises above such levels. We also know the data surrounding the NYSI breaking above 900 for the first time in a month. We emphasized this quant data back in 2019 and 2020, which both led to significant annualized gains for the S&P 500. (see table below)

Note that the 2020 signals bear question marks in the 12-month forward S&P 500 return column, but we know that after the 2020 signals the market was consistently making new all-time highs throughout 2021. This also takes the % Positive row higher for each forward monthly and annul return than stated in the table. The % Positive 12-month rate is now 94% with the 2020 signals completed in 2021. Nevertheless and more pertinent, I would encourage investors/traders to take notice of the red in the table as well. There were pullbacks in the market along the way, in various years, after the signal date (chart via Urban Carmel of The Fat Pitch).
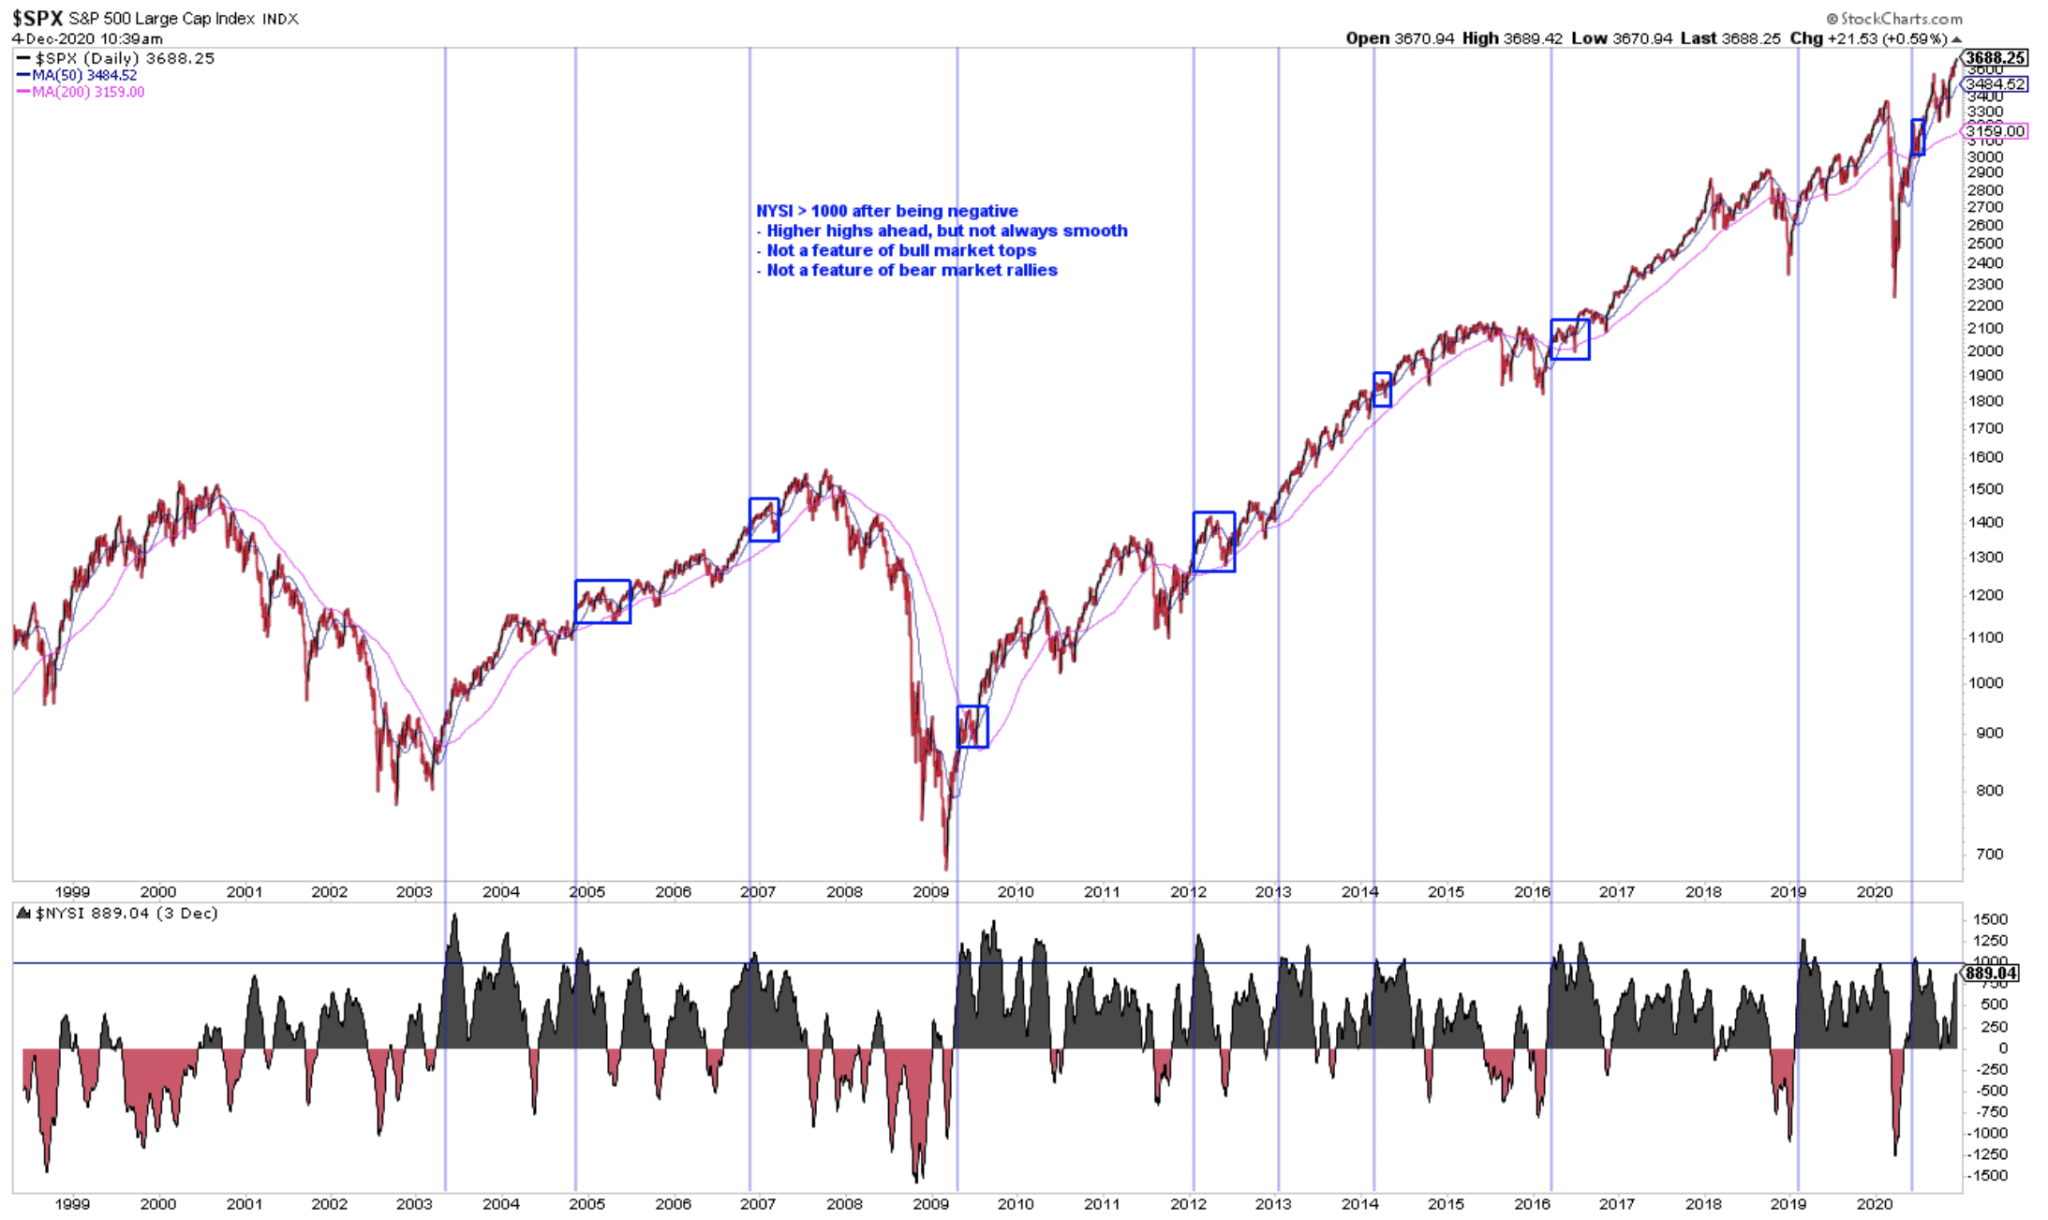
Additionally, the chart above depicts when the NYSI went from less than < 0 in October 2022 to close above > 1000 recently. The last time it closed >1000 was November 2020. Also noted in the chart above from The Fat Pitch are the dips in the S&P 500 (top chart) that occurred post the NYSI breaking above 1000. Longer term, strong breadth momentum is a tailwind that doesn’t eliminate drawdowns, but it is also not something that happens at bull market tops. In every instance, the market was higher 12 months later.
The difference between the forward probabilities noted in the NYSI getting above 900 for the first time in a month versus getting above 1000 was the 2007 date. In 2007, NYSI got above 900, but not above 1000, hence the difference in the 1-year forward returns associated with this date. This actually suggests that investors/traders don’t believe another financial crisis is looming, and they would be right to believe that based on the following J.P. Morgan data:

A look at the health of the U.S. Consumer via the J.Pl Morgan data reveals a U.S. Consumer that is better off than it was pre-COVID, and materially better than virtually any time in history. Highlighted in the red rectangular box was the Charge-Offs and Delinquency Rates during the Great Financial Crisis era. Today, the levels for these measures are nowhere near where they were during the Great Financial Crisis era… period!
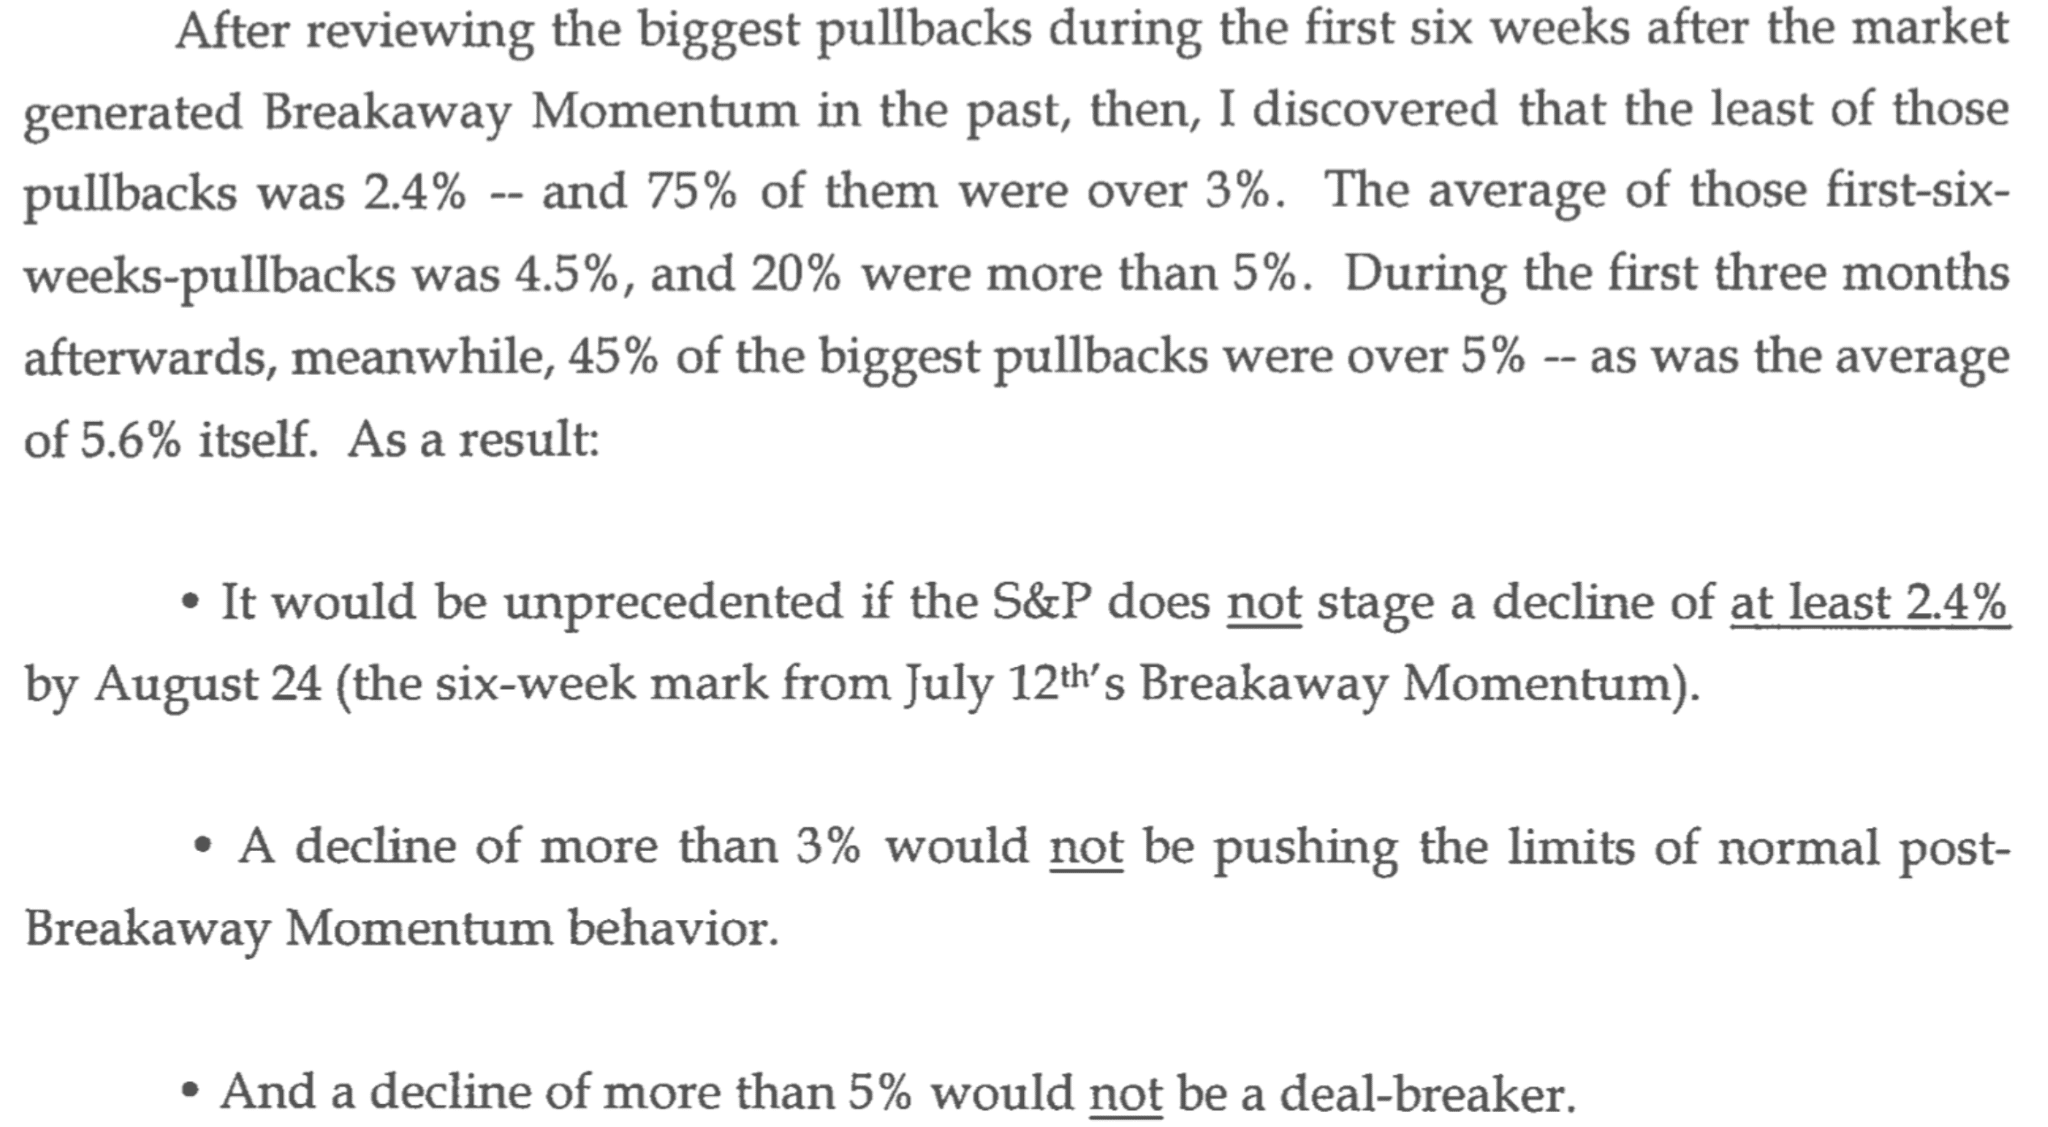
Now, recall that the market expressed several breadth thrusts in January, one of which was the highly respected Breakaway Momentum breadth thrust or BAM. Here were our notes on the potential for a pullback magnitude for the BAM, historically:
“With respect to drawdowns from a Breakaway Momentum breadth thrust, they tend to be shallow, occurring mostly in the weeks that follow the initial breadth thrust. Pullbacks are to-be-expected, but it is important to recognize that a Breakaway Momentum breadth thrust is in the pantheon of “buy-the-dip”, actionable signals should a meaningful pullback occur. As a discipline, and after such a powerful breadth thrust occurs, pullbacks are highly profitable investing opportunities for the months ahead 💯!
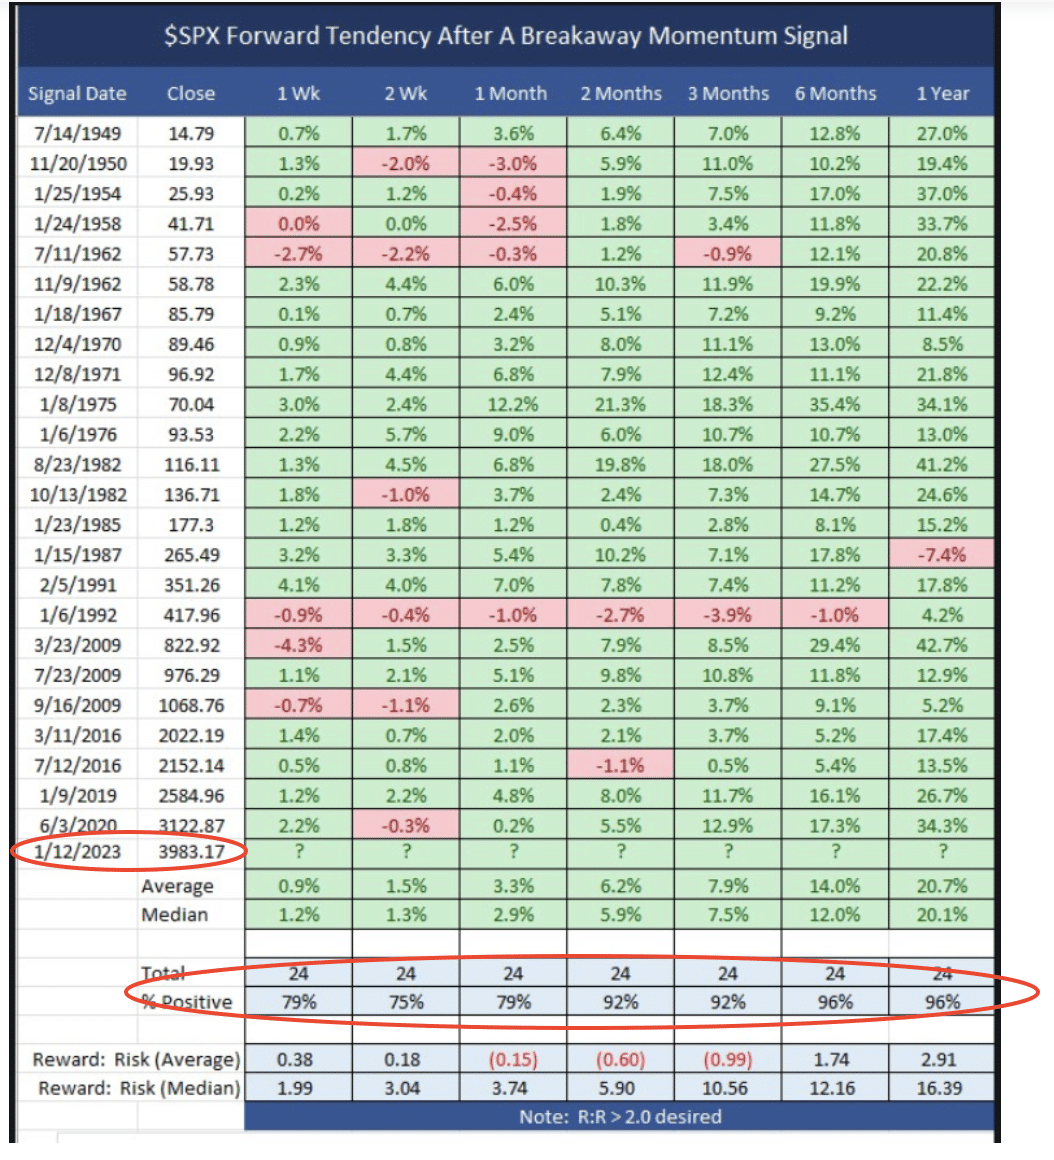
The S&P 500 was 3,983 when the BAM signaled. Since then it climbed nearly 200 points. The 2-12 month return, positivity rate is 92% or better across the stated time period. Additionally, the monthly pullbacks are extremely abbreviated and shallow. Having said that, there is likely some intra-month volatility greater than assumed on the monthly table above. Some of the intra-month, larger pullbacks are note in the following excerpt:
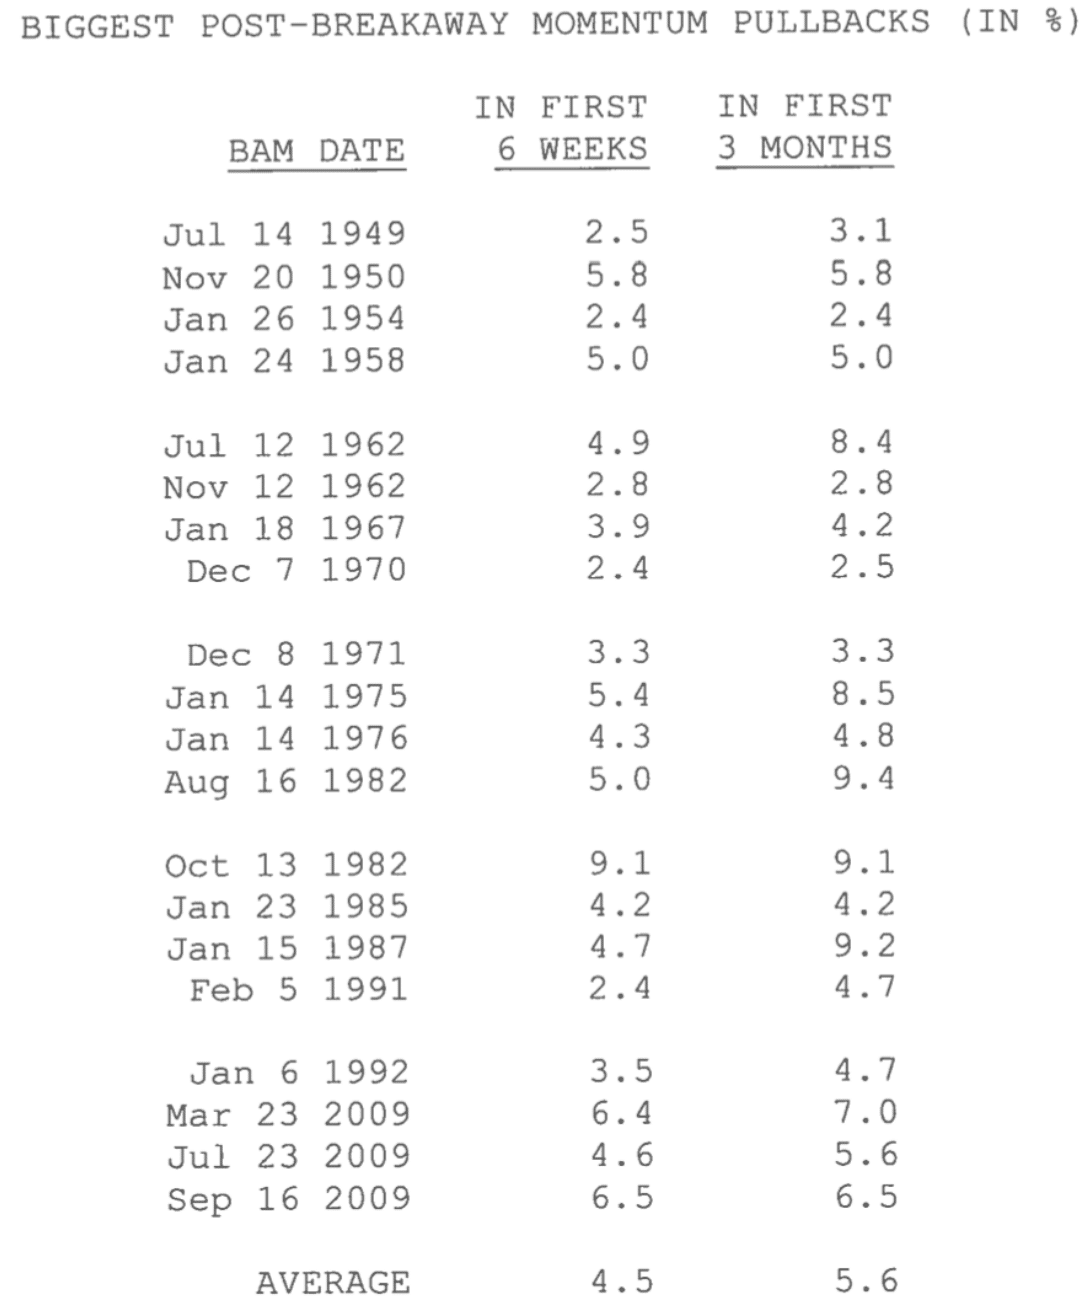
The average pullback after a BAM is 5.6% intra-month, but as one can see, the greatest was nearly 10 percent. How probable is a 10% pullback? Well, even the NYSI getting above 900 shows a meaningful pullback of nearly 8% in 2010 (we won’t consider 2020’s, 23% decline as it was pandemic-related). These significant pullbacks should be part of one’s baseline expectations. If the market surprises with a lesser pullback; good, fine, great! Either way, the game plan hence forth should recognize any pullback as an opportunity to either re-leverage or increase leverage rather than induce fearful selling activity.
So let’s do the math either way, and see if we can narrow down the probabilities and magnitude of a pullback. Some of you already know these are the Golden nuggets of the report, based on past exercises in defining where we are and could be heading. Good for you; you’ve been doing your homework!
A 10% pullback from the recent closing S&P 500 high of 4,179 would land the S&P 500 back at 3,762. Oh no, no… we simply can’t have that, either intraday or on a closing basis. And why?
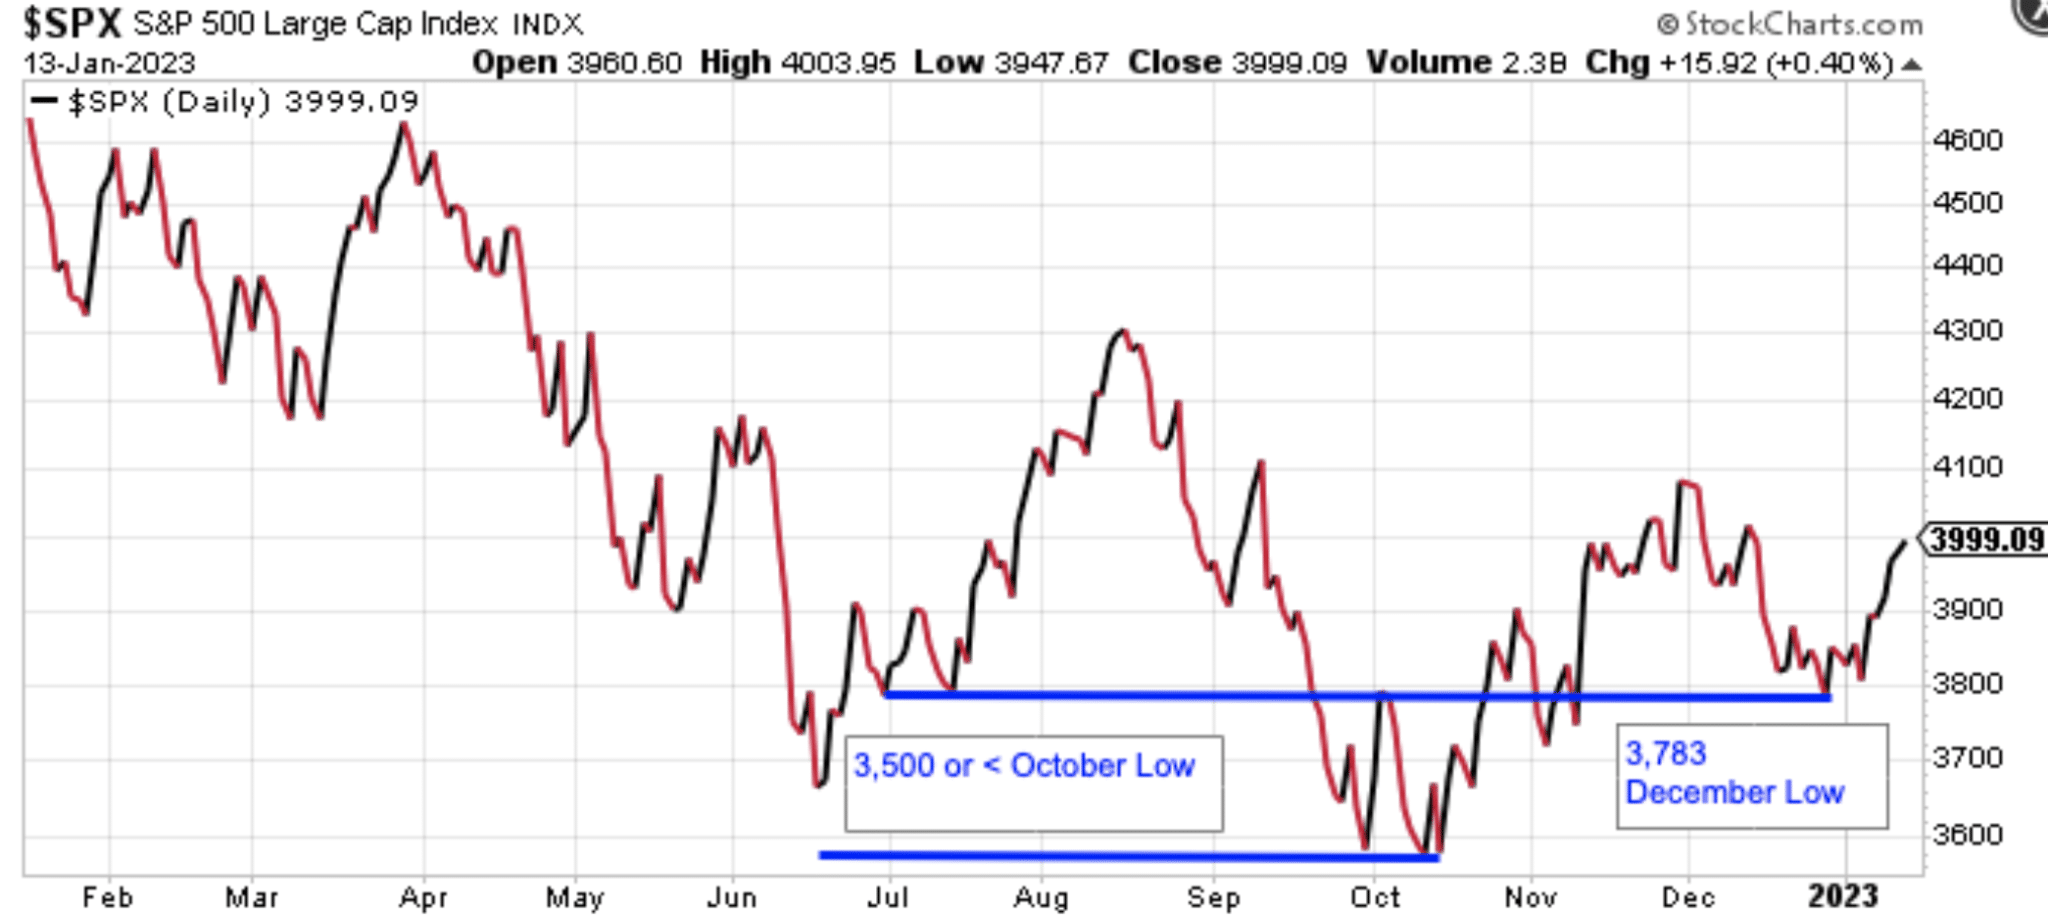
Recall that in mid-January we had readjusted our capital allocation Roadmap higher, due to the breadth thrusts expressed and the lesser probability that these breadth thrusts would allow the S&P 500 to break below the December 2022 Low (3,783). Based on our math, a 10% pullback would nullify the breadth thrusts and renders much of the breadth strength YTD in question. Simply put, we think a December Low retest or 10% pullback is unlikely due to the breadth thrusts and significance of the NYSI trend. A 9% pullback would not feel great, but it would not nullify breadth thrusts; very, very important to distinguish!
Another sequential reason that supports our belief a December Low retest and/or 10% pullback is not in the cards is due to a positive January Trifecta completion.
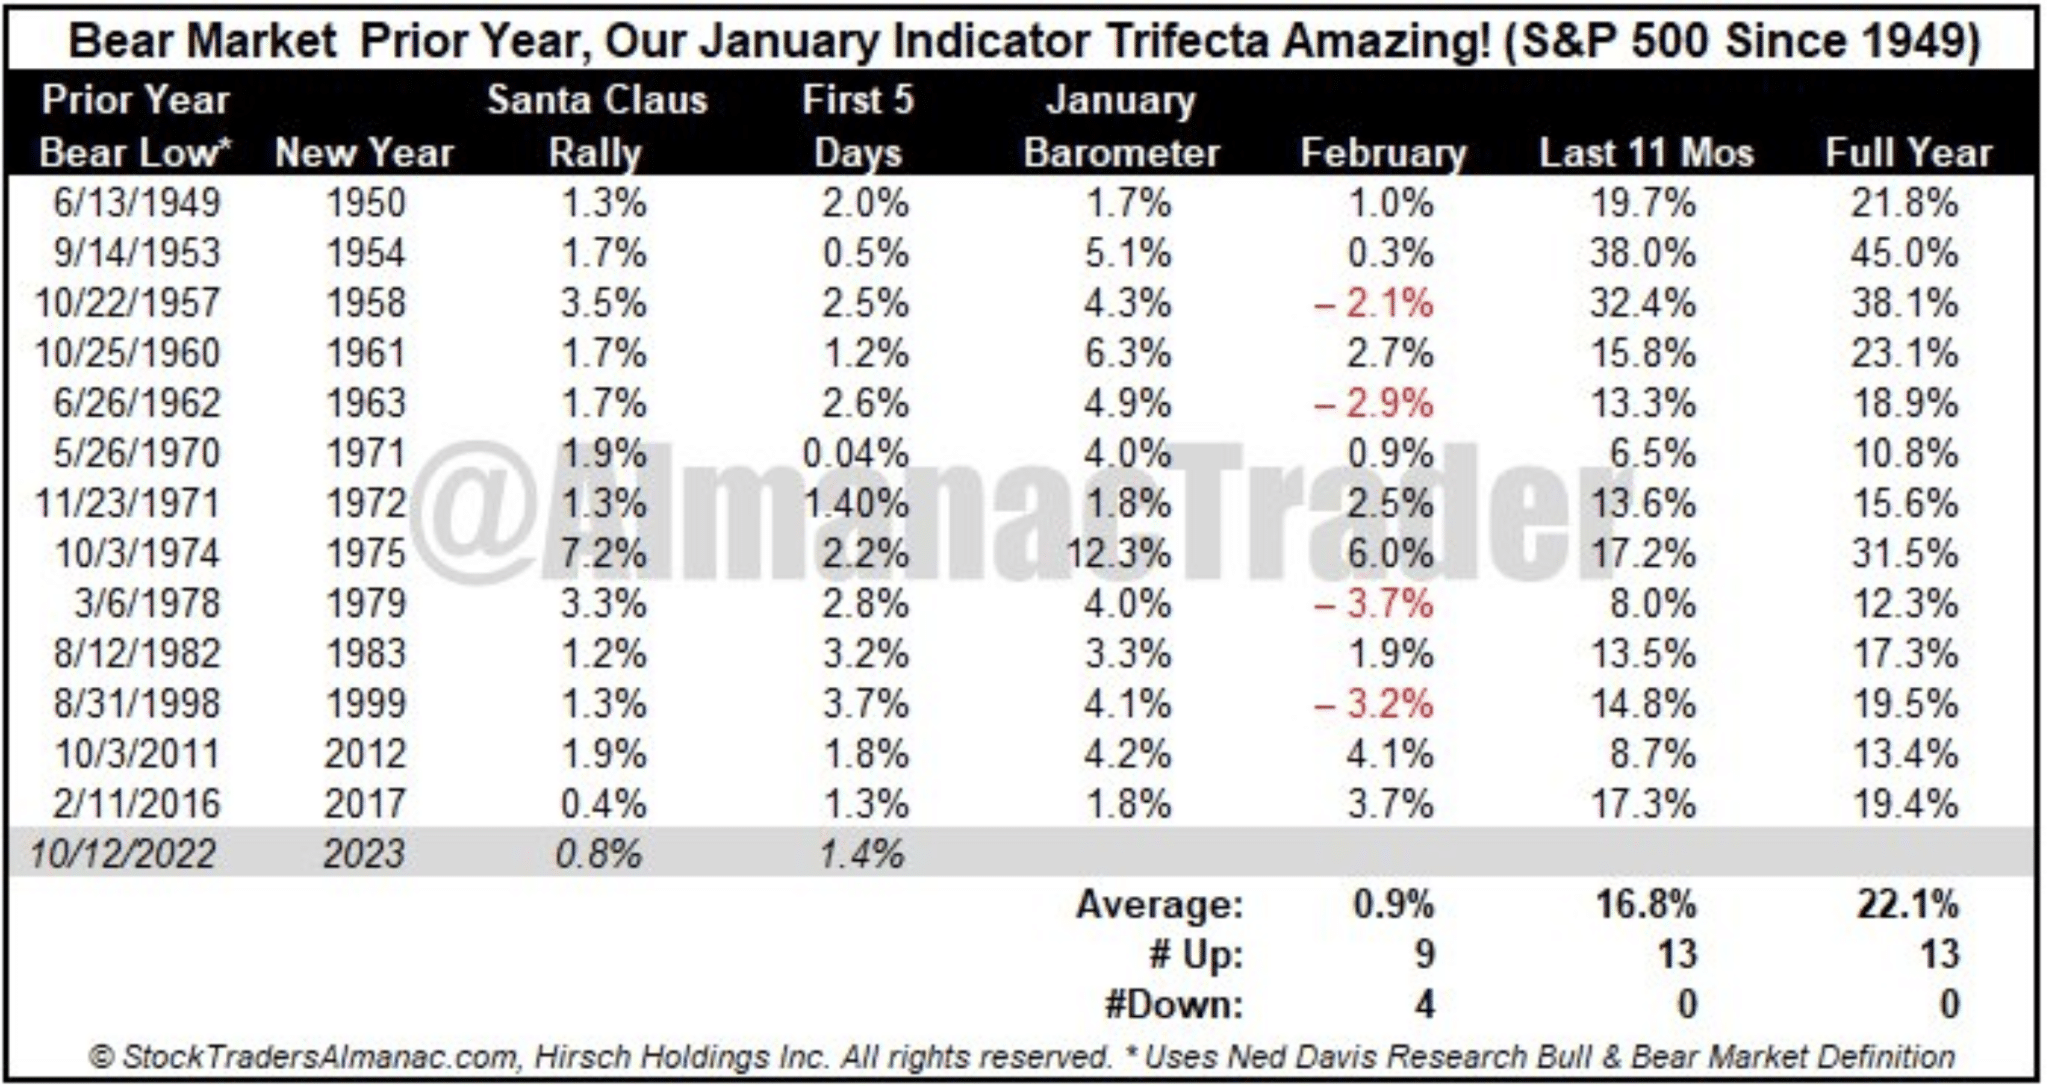
As shown in the table above from The Trader’s Almanac, after a positive January Trifecta completion, the February monthly return is positive the majority of the time, and in the years where it was not positive, the greatest drawdown for the month was -3.7 percent. But what about after the month of February? Could the declines persist long enough to introduce a multi-month pullback of greater than -3.7% and still less than 10 percent? Let’s continue to sequentially dig a little deeper to answer this question.
Recall that in November the “2 and 10” study from Steve Deppe was outlined alongside its significance.
- The study above from Steve Deppe recognizes a 2-month, 10% or greater advance in the S&P 500.
- Last time this occurred, prior to the current thrust, was in May of 2020 with a 17.79% advance.
- 2 and 10 breadth thrust.

- This signal occurs with a trailing 6-month decline, as is noted in the study above, 4th column.
- What is most notable about the study is that the 6, 8, and 12-month returns after the breadth/ROC achievement, the market was positive every single time.
- Is it possible that this will prove the first time the signal will fail come mid-2023 and November 2023. Sure! We know this would prove the lesser probability however.
- One month after this thrust occurred the S&P 500 had fallen by roughly 5%, which has occurred in the past. However, the 2-month forward returns after a 2 and 10 breadth thrust have been positive 90% of the time. The only time such a thrust delivered a negative return was after the November 2002 thrust and unfortunately now in January 2023 by about 1%. Yes, it is interesting to note that many of the thrusts came in the month of November, as shown in the study above.
The S&P 500 is currently higher than when the 2 and 10 thrust occurred. The 4-month return from the study above has a 90%+ positivity rate, which suggests there would be a low probability that should the market consolidate in February, even to the maximum drawdown noted in the January Trifecta, it is unlikely to persist with another monthly decline thereafter because the 4-month return after a 2 and 10 thrust has only been negative once.
For an additional parameter, we can also look at the November Midterm Year to April performance history.
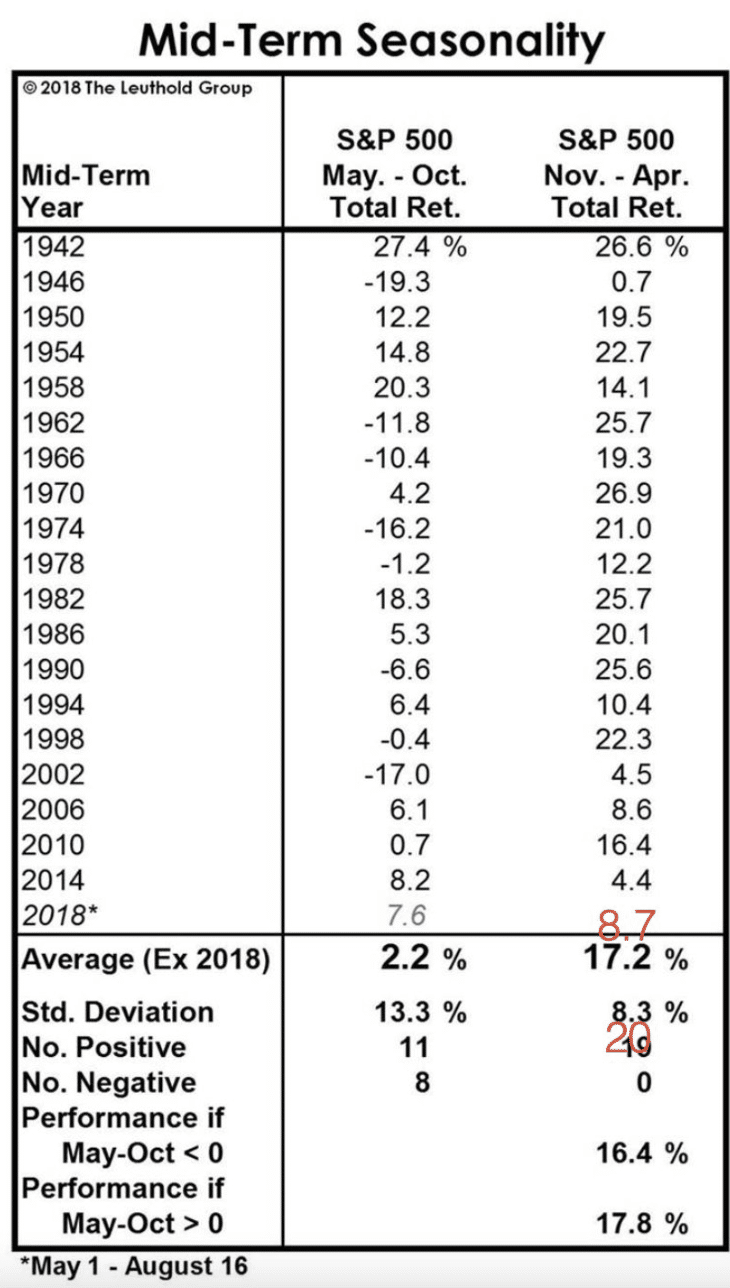
- Since 1942, the S&P 500has NEVER delivered a negative return from November Midterm election year through April of the following year.
- Average return is roughly 17%.
- Worst performance .7%.
The S&P 500 November 2022 starting price for the month was ~3,871 (low price 3,719 and high price 4,080). History suggests that through April of 2023, the S&P 500 would finish above the starting price for November 2022, and to express the 100% positive return probability outlined in the table above for the stated period. Again, this suggests a lesser pullback for the market near-term than a feared 10% pullback.
Bottom line: This is yet another exercise in sequencing the technical and quantitative data to project forward the probable market price action. Based on the weight of the evidence, we are not seeing a high probability of anything more than a 7-8% maximum pullback from the analysis, at the index level. If something greater materializes, it will go into the piggy bank of factors to consider, and further analyzed. We think it wise for investors/traders to leave some room for error given the ongoing rate-hike cycle. The yield-curve inversion bothers us far less than the Fed listening to the yield-curve speaking.
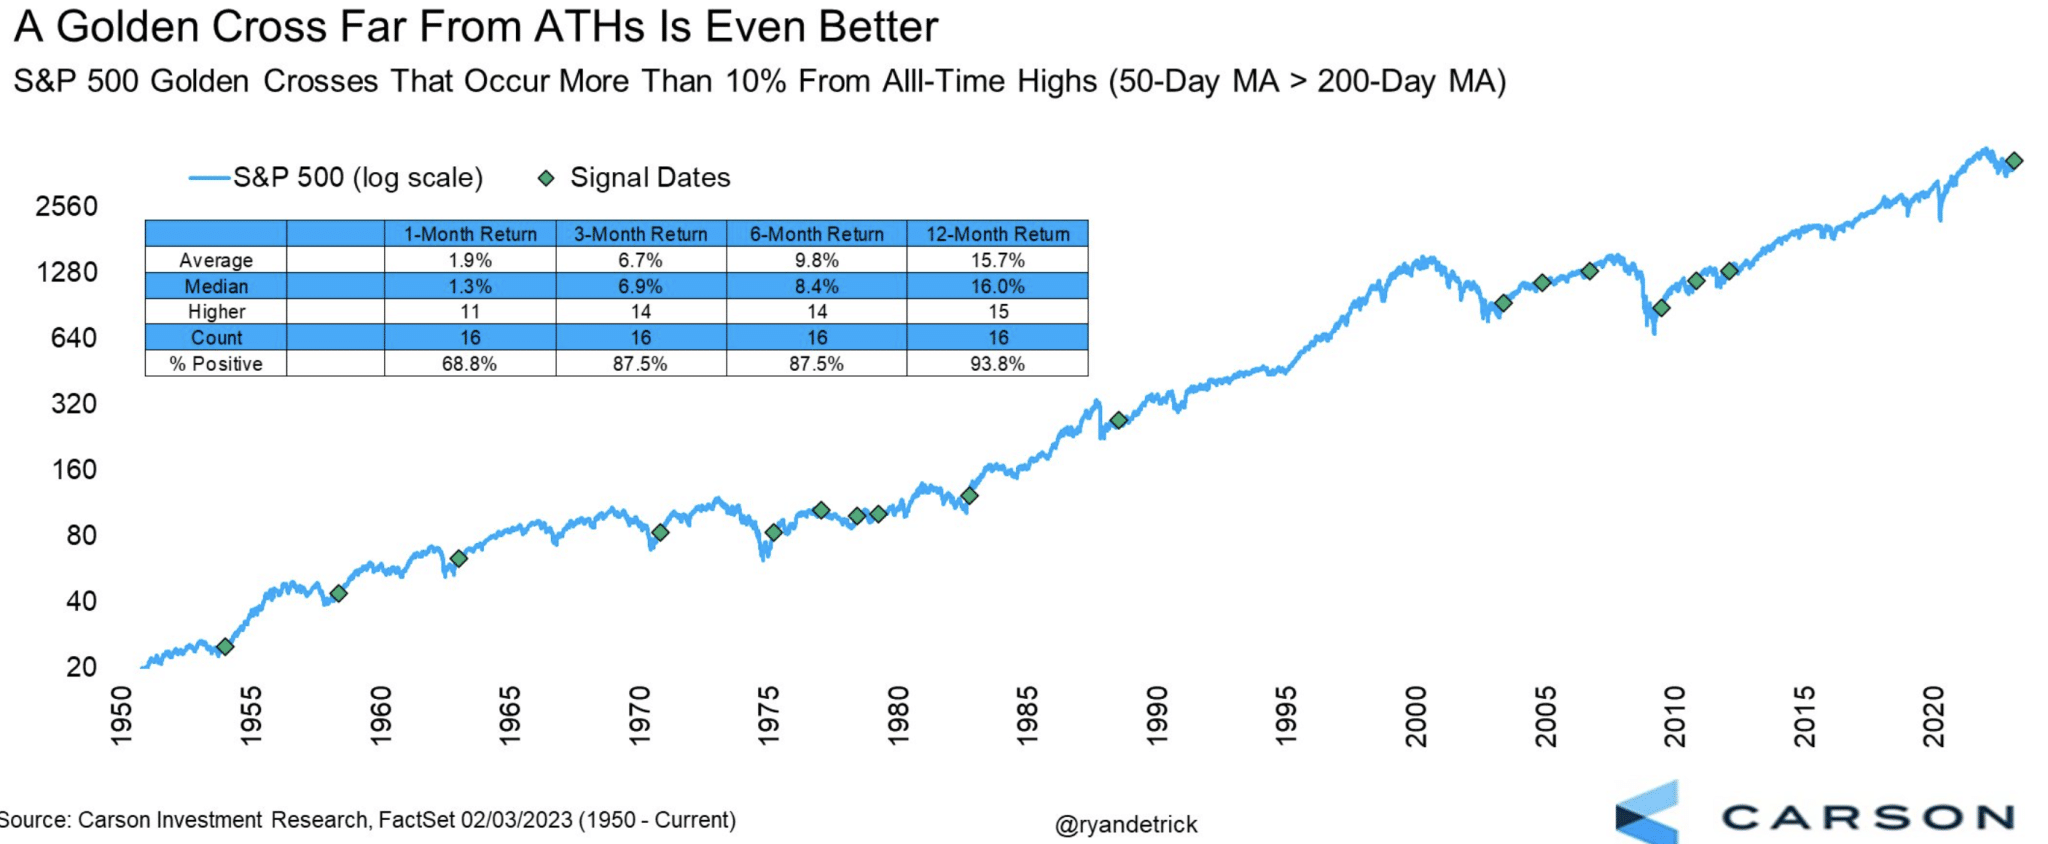
Moreover, the technicals have been aligning well, indicating a risk-on environment afoot. The S&P 500 Index ETF (SPY) had previously expressed a Golden Cross, and since trended higher. This past week, the S&P 500 itself has expressed a Golden Cross.

When the S&P 500 50-DMA crosses above the 200-DMA, this is called a Golden Cross. What is special about the current Golden Cross is that it took place greater than 10% from the all-time highs in the S&P 500. Historically, the market has been higher 15/16 times a year later. Always think long-term. As shown in the table below from Ryan Detrick, forward 3-12 month positive returns occur roughly 90% of the time.
There are a great many charts and bullish feats of strength confirming a new bull market is afoot, so many it would prove overwhelming to outline each and every one. Rather than run through a series of such charts, we suggest the NYSI and number of sectors currently above their 200-DMA speak to the new bull market perfectly well. Willie Delwiche of Hi Mountain Research offers the following commentary on sector performance and S&P 500 forward return probabilities:
“It was 0 for 11 as recently as September, but yesterday finished with 9 S&P 500 sectors above their 200-day average. The 8 previous times over the past 2+ decades that we have gone from 0 to 9 have been signals that relatively good times lie ahead for stocks. Indicators of trend offer a more continuous assessment of the environment. For example, looking at the trend in new highs versus new lows may provide more information about the health of the market than having observed a signal spike in new highs or collapse in new lows.

Returning to the expansion in the number of sectors above their 200-day average. Both the signal and the trend are currently encouraging.”
With all the information and analysis outlined, it would be hard to argue that this is not a new bull market, but many will suggest that to be the case. Bear markets are considered over when there is a daily close 20%+ higher than the lowest low. Here are the % changes from bear market lows to recent high closes for the index ETFs: $SPY +19.727%, $QQQ +22.599%, $IWM +22.043%, and $DIA +20.77 percent. It would appear as though many of the indices are in a new bull market, and undeniably so. With respect to the Nasdaq 100’s strength, here are some interesting statistics from Fundstrat and supportive chart:
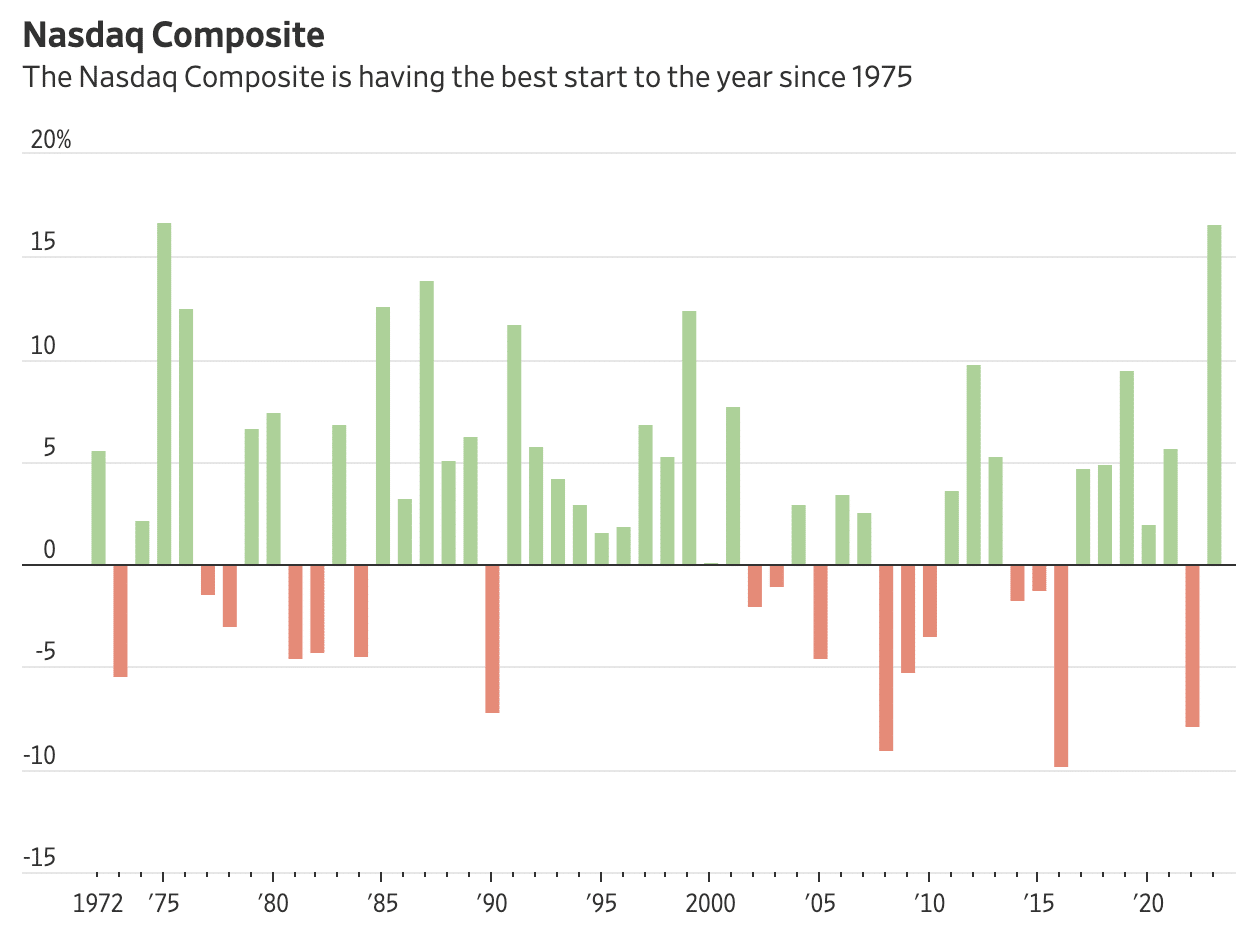
- The NASDAQ 100 YTD Return = 14.9%.
- Through Feb 3 this ranks #4 start Since 1987.
- Of the top 10 YTD starts through February 3rd.
- Returns on average are strong through end of year.
- Average return the rest of the year is: 28%.
- Median return: 24%.
- 8/9 saw further gains, greater than 90% positivity rate.
Our final quant study of the week also comes from Fundstrat. In speaking in favor of a new bull market and/or uptrend, we should see that the longer-term breadth is confirming the index’s strength. For this, we look at how many stocks are trading above their 200-DMA. As of this past week, the S&P 500 had 75% of stocks trading above their 200-DMA. See data/chart as follows:
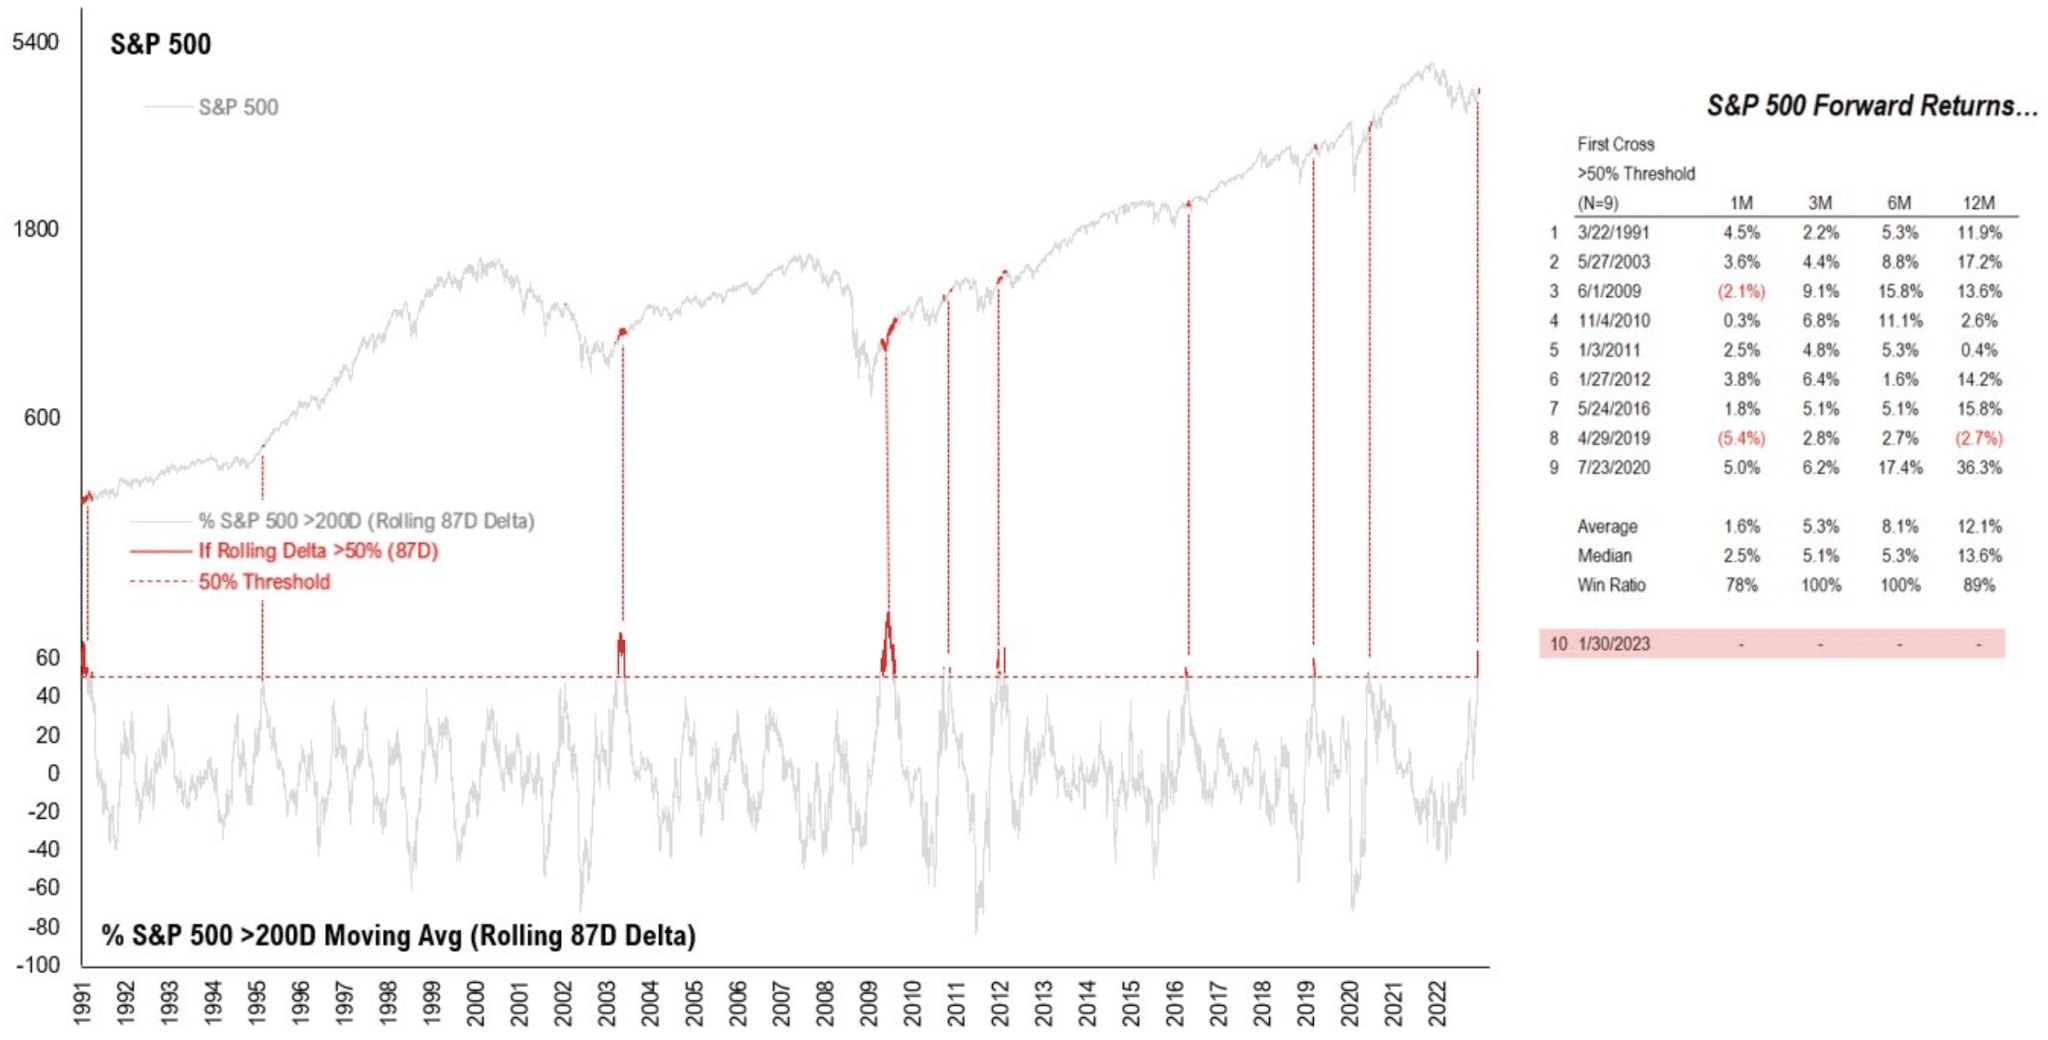
What is most impressive is that the index went from only 11% trading above their 200-DMA on 9/27/22 to 75% in just 87 days. So the Delta or number of days in between is 87 Delta or 64 percent. Historically when 87 Delta of stocks above their 200-DMA Crosses 50%, it’s bullish. Note the forward positivity rate in the table above going out 3, 6, and 12 months is 100 percent. Again, this speaks to the probability of drawdowns going forward.
As we wrap things up for the week, I would emphasize that all environments for which the market delivers value, be it in a bear market or after a significant rally, is a matter of disciplined engagement. Take advantage. Even in our former recognition of the 1966-1967 Analogue do we see various pullbacks along the way.
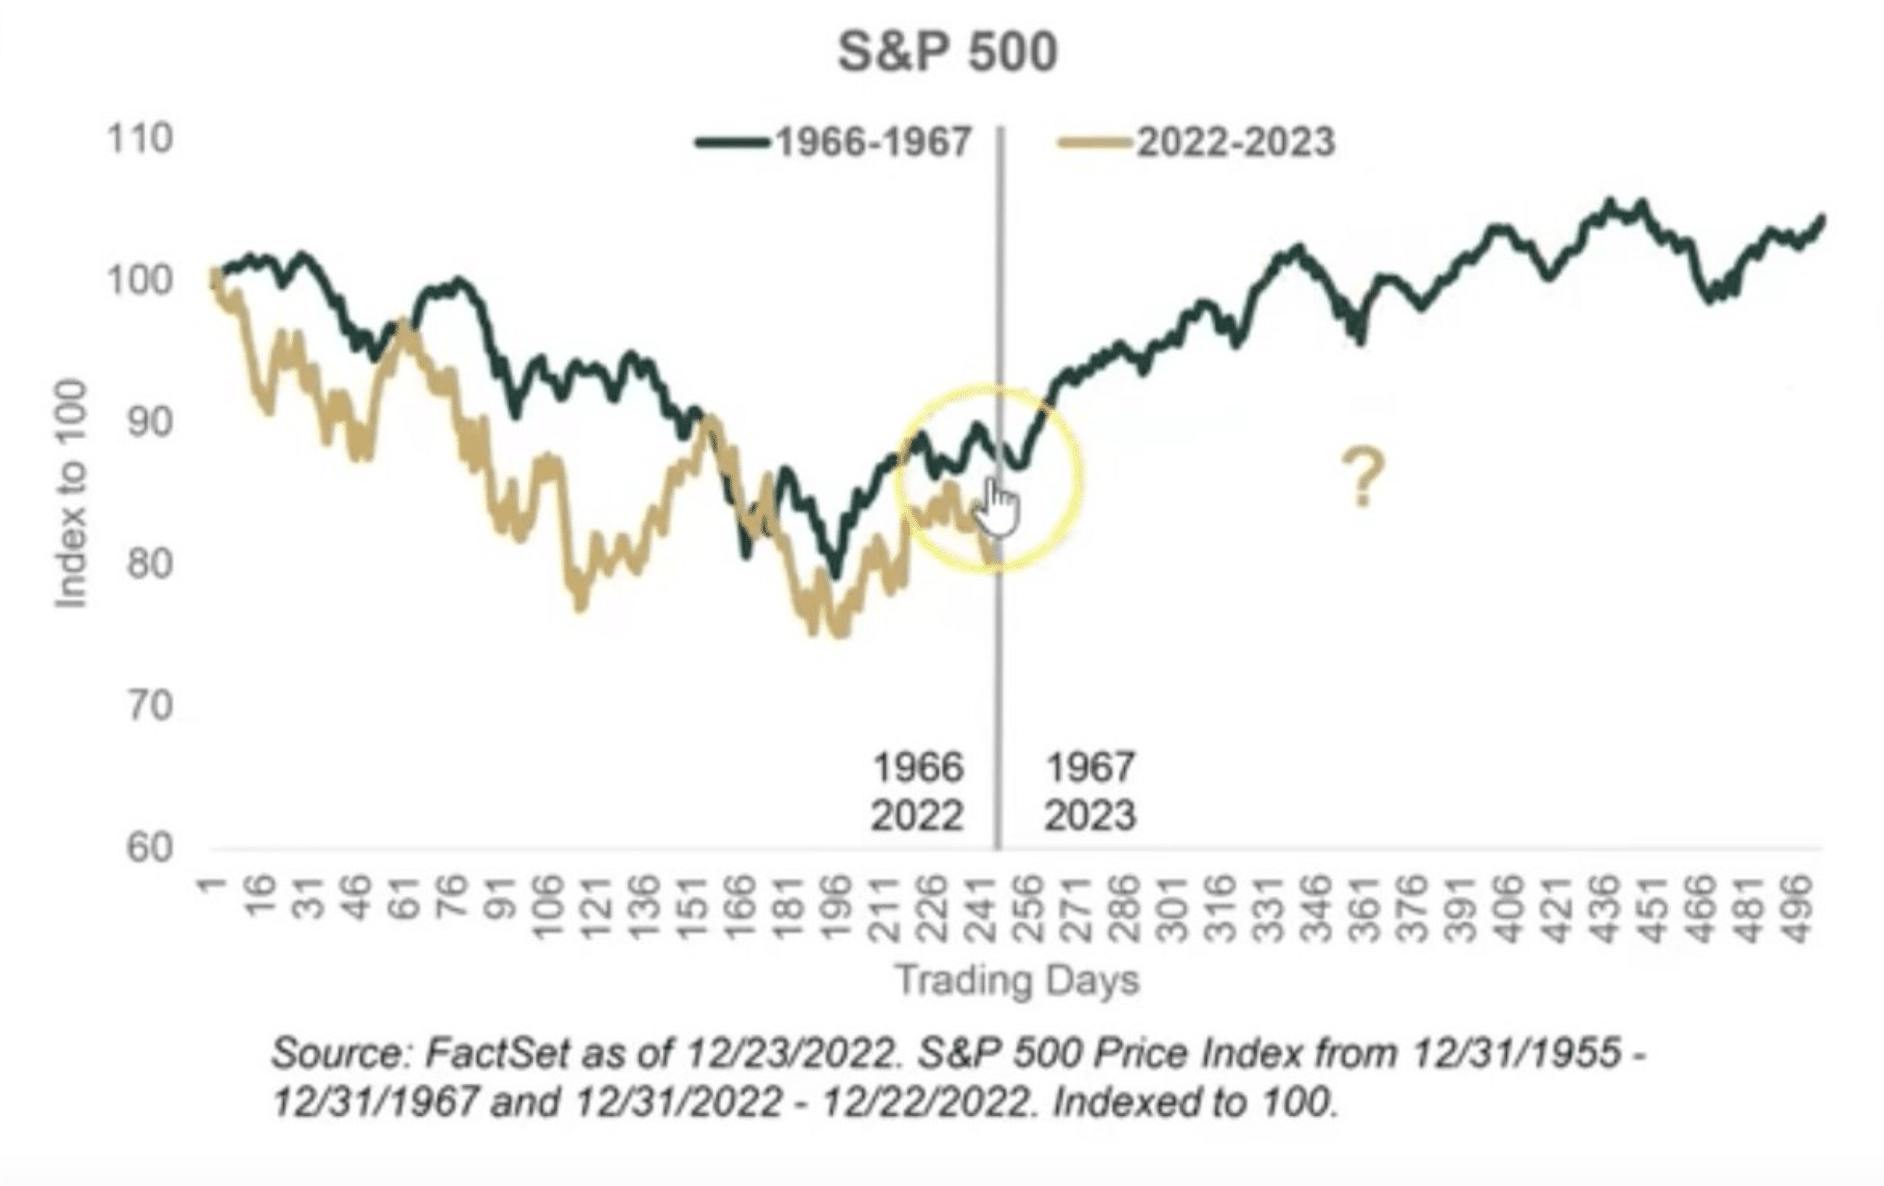
In 1966, the S&P 500 fell 22% starting January, bottoming in October 1966, just like 2022. The Fed hiked rates continuously in 1966, as inflation soared with a WAR raging in Vietnam. Additionally, all this was happening during a Midterm Election year, like 2022. After gaining 6% in Q4 stocks soared 24% in 1967. The S&P 500 gained 7% in Q4 2022. So far, the early start to 2023 is tracking the 1966-1967 Analogue extremely well, although we shouldn’t expect a perfect replication.
Final Consideration:
Although the Growth and FANMAG cohort of stocks had a more significant pullback this past Friday, I view this pullback as an opportunity for several stocks and/or ETFs in this area of the market, especially with consideration to Amazon (AMZN). Late last year, we had started building a long-term position in the name as it was trading in the high $90 to $81 range. We issued and completed 11 official trade alerts for Finom Group Premium members, resulting in a cost average of ~$85 in the name. In considering Apple (AAPL), Alphabet (GOOGL), and AMZN reporting on the same day this past week, AMZN’s stock reaction was the worst, although I hold the opinion it’s quarterly performance was the least bad, and guidance was positive with respect to sales in the Q1 2023 period.
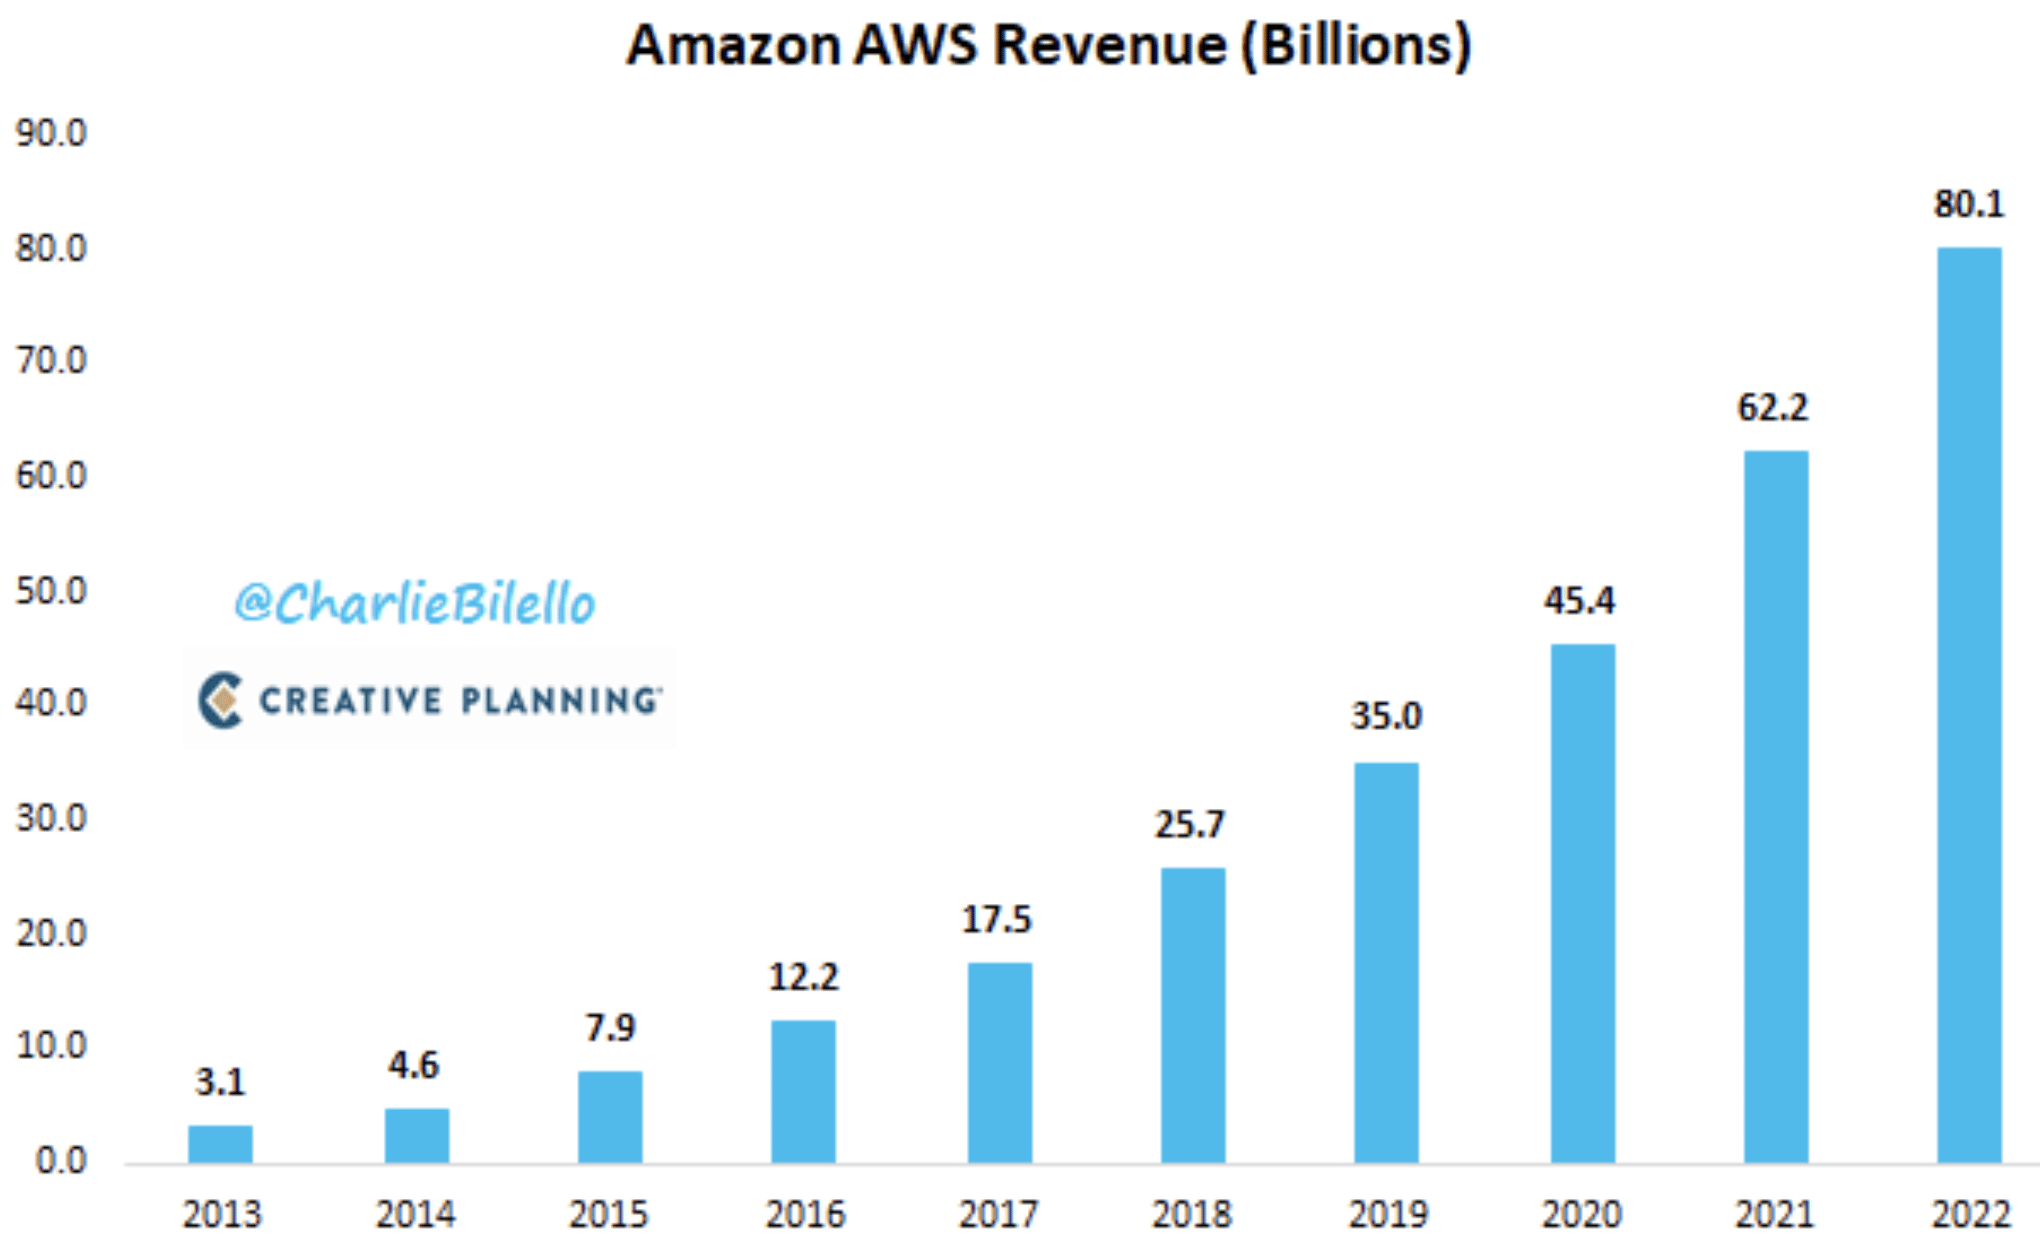
What’s so amazing about Amazon’s AWS business division, is that AWS revenue in 2022 ($80 billion) was higher than the revenue of 457 companies in the S&P 500 (chart via Charlie Bilello). It has grown from $3 billion to $80 billion in just 9 years (44% annualized growth rate). The slowing growth rate in 2022 is largely due to the global impact of the Russia/Ukraine war and rate-of-change headwind from the pandemic year. I’ll continue to be opportunistically buying shares of AMZN, should devaluation persist over the ensuing 90-day period. I’m not terribly confident, however, that devaluation will persist for very long. As always, this is not a recommendation, but an idea for investors to consider longer-term and should such a Growth stock suit their risk profile.
Heading through February, I hope the analysis within this weekend’s Research Report finds investors/traders engaging potential pullbacks with confidence; so don’t worry about pullbacks, but be happy when they arrive, and get you some exposure, bruh! 😉


