
Entering the trading week we were forced to understand there would be an additional selling force in the market. We disseminated information over the weekend through our weekly research report that identified the culprit that would plague the market this week.
“Finom Group urges investors to remain cautious as the current trading week may find investors selling the rips. Why? One very key event that is going to express itself this coming week for the markets and investors is hedge fund redemptions. Nov. 15th is the deadline for investors to put managers on notice to get some, or all, of their money at year end. If history is any guide, the rush for the exits will be rapid. Clients have already pulled $11.1 billion even before funds fell into the red for the year.”
After the major averages fell 2% and greater on Monday, the selling pressure persisted on Tuesday, but to a lesser degree. The Dow finished lower by 100 points and the S&P 500 (SPX) fell by 4 points with the Nasdaq (NDX) basically flat on the day. The continuation of selling in the major indices came even as China and European equity markets rallied, thus, validating the differentiating variable presently overriding U.S. investor appetite, hedge fund redemptions.
The additional selling pressure yesterday came with a continued bearish sentiment from the analyst community and a recent Bank Of America Merrill Lynch fund manager survey and notes from analyst Michael Hartnett.
“We remain bearish, as investor positioning does not yet signal ‘The Big Low’ in asset markets,” says Hartnett, in the bank’s closely watched November fund manager survey (the capitalization isn’t lost on us, nor Wall Street, we presume).”
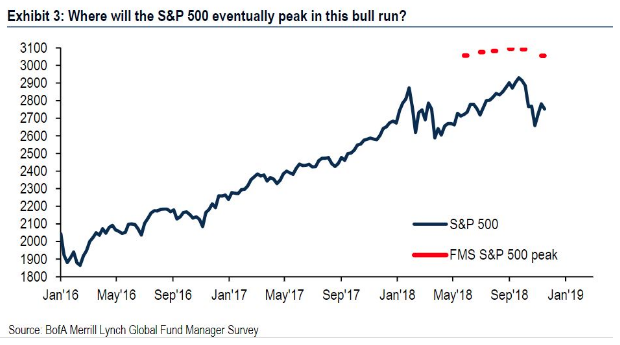
At present, the bank’s Bull & Bear indicator, which tracks investor sentiment is hanging around 3.1, meaning no “contrarian buy signal” is being flagged, offered Hartnett. Managers surveyed believe the peak of this bull run is not here yet, with 12% upside seen from current levels, taking the S&P 500 to 3,056 (weighed average). One of three respondents said they think the market has already peaked.
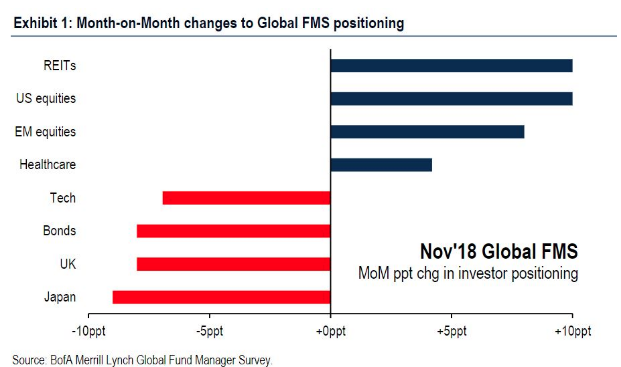
 As shown in the table below, cash levels also dropped in November to 4.7% from 5.1%, meaning investors bought into that October correction, upping exposure to U.S. and emerging-markets stocks, REITs and health care, which is now the No. 1 overweight, in the survey.
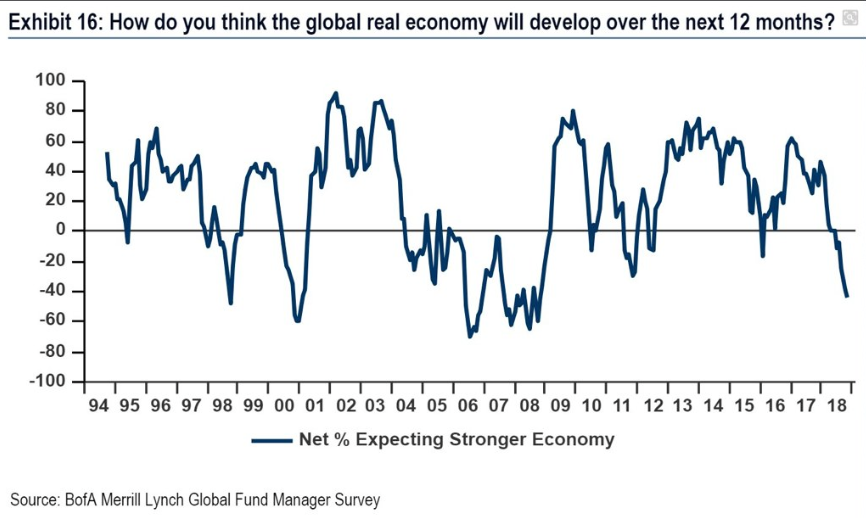
Moreover and according to the fund manager survey, fund managers are not optimistic about 2019, as macro expectations sink to a 10-yr. low.
Right on target with the BAML fund manager survey, Germany economic activity showed a contraction in the most recent data announced on Wednesday morning. Fresh data published Wednesday showed that Europe’s economic powerhouse registered its worst performance in five-and-a-half years, according to the Federal Statistical Office. Gross domestic product–the broadest measure of goods and services produced in an economy–shrank at a quarterly clip of 0.2%, which translates to an annualized rate of minus 0.8%, according to the office. That is the lowest rate since the first quarter of 2013.
Economists said that the weak result was largely caused by temporary factors, notably bottlenecks in the approval of passenger cars in the wake of the new WLTP emissions-testing protocol. Exceptionally low water levels at the Rhine river–a major transportation route for oil and other goods– depressed activity even further.
“In the fourth quarter, the German economy will grow again simply because car manufacturers are likely to gradually ramp up their production again,” said Commerzbank economist Ralph Solveen.
Germany has been facing the threat of tariffs from the U.S. Administration since the spring. A late Tuesday evening report from Bloomberg, however, suggest such tariffs may be “on hold”. The Trump administration will hold off on imposing tariffs on auto imports for the time being, Bloomberg News reported Tuesday night. Trump and his top trade advisers met Tuesday to discuss a draft report by the Commerce Department on the national security implications of auto tariffs, Bloomberg reported, and agreed to hold off on tariffs at least until the report could undergo revisions.
Given the current market conditions, the main question that remains front of mind with investors is whether or not the market will retest the October lows. To answer this question all we have to rely upon is historical context. The charts below show each 10% fall since 1981, with the blue arrows indicating the initial low and then the subsequent low retest. There are 21 instances and only 6 exceptions, 4 of which occurred between 1996-2000 (green arrows). Since the 2009 bear market low, there have been 6 separate 10% corrections before the current one, and only 2012 made a “V bottom” with no low retest.
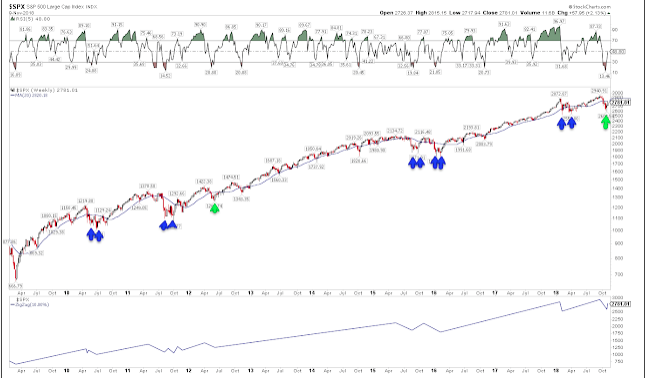

Based on the charts, the historic context, there remains a very high probability for the markets to retest the October lows. Only one time, in 2012, did a 10% correction result in a V-shaped recovery there after. And keep in mind that at Tuesday’s close, the Nasdaq is already just 1.7% from the October closing low. If it leads, then the rest will continue lower in the days ahead.
Given the technical market breakdown and breakdown in investor sentiment since October, one could easily suggest a bear market scenario is coming to fruition. But the neither the technicals or sentiment indicators are inline with economic conditions or corporate earnings growth. That is what makes the current market conditions, as a whole, so confounding.
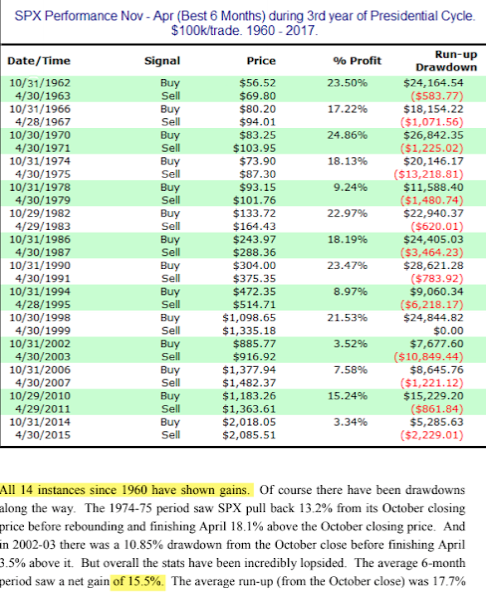
We’ve seen the seasonal data in past articles and plastered across the media headlines for what may prove a more positive outcome for markets in the coming weeks and months. SPX has risen over the next 6 months following a mid-term election every time since 1946. That’s 17 occasions in a row. Shown below are the last 14, since 1962: the average gain has been 15% with risk-reward more than 5:1 positive (from Quantifiable Edges).
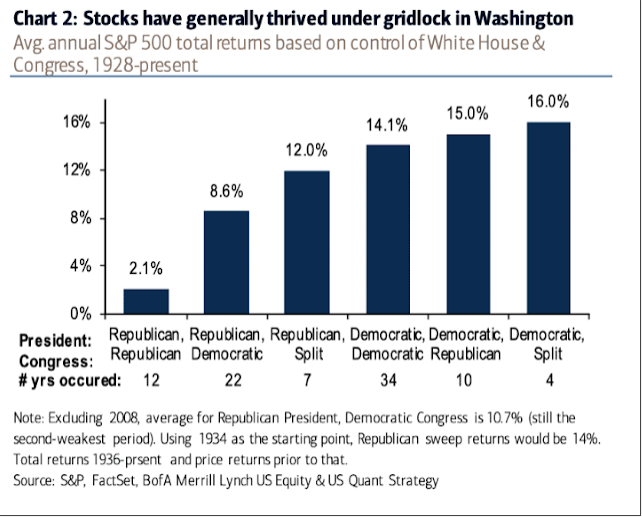
Even when we look at a flipped Congress, the forward returns have historically proven strong and that’s according to BAML own research. It’s unlikely the election results, which created a split Congress, will have a long-term negative impact on US equities. Since 1928, the current combination has occurred concurrently with an average rise of 12% in SPX over the next year (from BAML).
We’ve thrown a lot of statistical, historic data at you and supporting charts/tables to boot. Having said that, investors and traders are forced to contend with the present market environment until a turn comes. Near-term market pressures may prove to be a strong, long-term opportunity for investors with a longer-term horizon, but for those focused on the week-to-week results, hedging opportunities may be presented and before markets take a leg lower. Hindsight is 20/20 for traders, thus enforcing the validity of the long-term perspective.
As we noted in previous daily market dispatches, we believe a near-term pop to the upside in oil prices is close at-hand. Here are some of the key reasons that oil prices have staged a record setting drop, after posting a 52-week high back on Oct. 3:
- Oversupply: The Organization of the Petroleum Exporting Countries raised its production in September by 100,000 barrels a day to 32.78 million barrels of oil a day—a one-year high, according to the International Energy Agency.
- A surprise: Trump granted waivers to eight countries, allowing them to temporarily continue buying Iranian oil despite U.S. sanctions on the country’s energy sector, which took effect Nov. 4.
- Seasonality: A time of planned shutdowns at major crude-oil refineries for maintenance, is more active than normal, resulting in more crude in inventories amid a period that was already expected to see slowing demand
- Trump: President Donald Trump has been consistently advocating for lower oil prices and on Monday issued a tweet urging for even lower prices
- S. oil: U.S. production climbed by 400,000 barrels a day to a record 11.6 million barrels a day for the week ended Nov. 2, adding to oversupply worries
Tuesday’s massive plunge in the price of crude oil may have been just the type of capitulation that was needed before the rise in price ensues. This is the most oversold oil has been from 1983 – present.

So was Tuesday’s 7% decline in WTI the bottom or not? According to the following table provided by bullmarkets.co, it very well could be… for now.
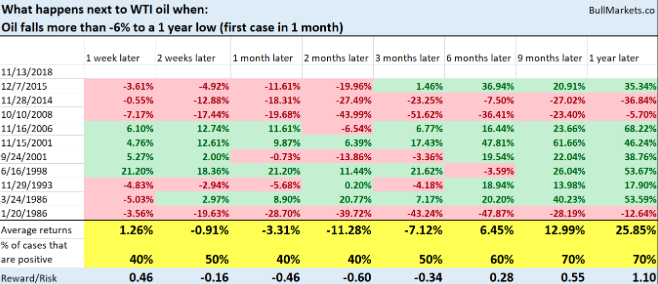
As one can see, oil’s returns over the next 3 months lean bearish, but over the next week it leans bullish and before retreating further.
Is it difficult to simply negate such negative market sentiment and sentiment that has remained largely negative for the last 30 days or so? Even more, is it difficult to brush the negativity aside as economic growth and earnings remain robust? Certainly that’s a difficult task for investors and why they call it “climbing the wall of worry”. But with that in mind, LPL Financial hopes to remind investors of what drives market performance over time, earnings! In the firm’s most recent blog post they offer the current performance metrics for the Q3 2018 earnings season as follows.
- Strong Q3 earnings season nearly in the books. With 90% of S&P 500 Index companies having reported, S&P 500 Index earnings growth is tracking to an impressive 27.9% year-over-year increase, the highest growth rate since the fourth quarter of 2010 and 6 percentage points above expectations as of quarter end. Beat rates of 77% and 60% for earnings and revenue are impressive, as is the amount of earnings upside. However, we are most impressed with the amount of revenue upside-tougher to generate-that has been generated over the past two weeks. Revenue growth is tracking to an 8.5% year-over-year increase, compared to 7.7% just two weeks ago. The strong top line performance, clearly boosted by a strong U.S. economy, is particularly impressive given there is no direct benefit from the lower corporate tax rate. The resilience of earnings estimates, despite tariffs, has also been impressive. S&P earnings estimates for the next 12 months have only been reduced by 0.8% since quarter end, less than the 5-year average decline during earnings season of 1.6% and the 10-year average decline of 2.1% (source: FactSet).
We’re very close to the end of earnings season and Macy’s (M) will be a key report delivered before the opening bell Wednesday, as it remains a gauge on the state of consumer sentiment and spending. Additionally, investors will anticipate both monthly retail sales and Wal-Mart’s (WMT) Q3 report on Thursday morning. Have a great trading day out there folks!


