

Research Report Excerpt #1

- Over the last twenty-one years, the full month of October has been a solid month for the market. DJIA, S&P 500, NASDAQ, Russell 1000 and Russell 2000 have all recorded gains ranging from 0.6% by Russell 2000 to 1.9% by NASDAQ.
- But these gains have come with volatile trading, most notably during the early days of the month. October has opened softly with mild gains on its first trading day by DJIA, S&P 500 and Russell 1000. On the second day, all five indexes have been weak followed by a rebound on the third trading day before additional weakness pulls the market lower through the seventh trading day. October 14th is the 10th trading day of this October calendar year.
- Monday will mark the 12th trading day of the month, typically where the indices have peaked during the month and before another leg lower into the 17th trading day of the month. The leg lower is not usually a new, monthly lower-low by the way**.
- And after that, the market has historically found support and began to rally through mid-month and beyond.
Research Report Excerpt #2
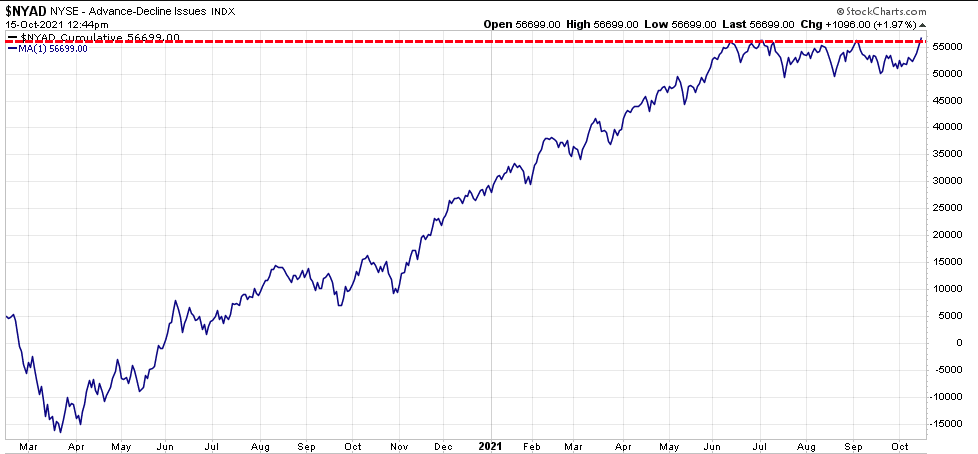
Moreover, we shouldn’t forget that the former high in the NYSE A/D Line confirmed the former S&P 500’s highs back in June. New S&P 500 highs in June are a bullish sign for the second half of the year IF they are confirmed by the NYSE Advance/Decline Line, which it did! Below are the forward S&P 500 returns given a June NYSE A/D Line confirmation signal. (Date of signal was June 16, 2021)
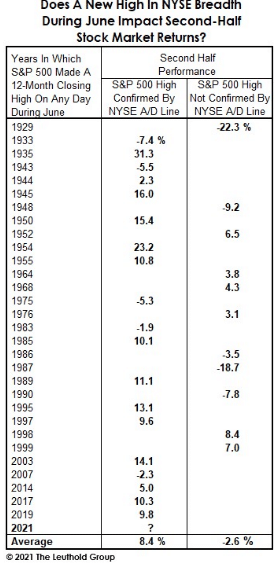
The average return from a June “NYSE A/D Line confirming signal” is 8.4% since 1929, with many occurrences. Since the date of this confirmation signal on June 16th, the S&P 500 has gained 6% to-date and did travel almost 8% from that date to the September 2nd all-time high. It looks like, indeed, history is repeating and the former highs have a reasonable probability of being revisited, potentially eclipsed by year-end.
Research Report Excerpt #3
Given we had previously focused on the S&P 500’s 14-day Relative Strength Index in our weekly State of the Market, let’s see what this indicator lends to the coming week’s expectation/s.
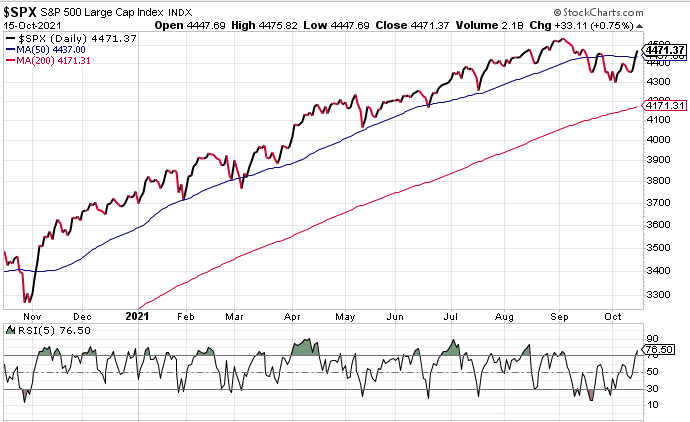
The first thing you’ll notice in the S&P 500 chart above is that the index finished nicely above its 50-DMA for the first time in nearly a month and only 1.45% below its all-time high. The bottom panel you will notice that I’ve adjusted the 14-day RSI to a 5-day RSI; this is to account for the strong 3-day rally mentioned previously. Using the 5-day instead of the 14-day RSI, it helps us to determine if the rally delivered “overheated” conditions. A reading above 70, which it ended the week 76.50, would prove overheated.
Research Report Excerpt #4
Headline CPI rose 0.4% overall with the core increasing 0.2% in September following respective August gains of 0.3% and 0.1 percent. After 2 consecutive MoM drops in CPI, the latest rise was to-be-expected and will hold inflation at elevated levels through year-end. We’ll get to this rationale in a moment.
The headline jump is a little hotter than expected, while the latter is in line. On a 12-month basis, the headline rate rose to 5.4% YoY versus 5.3% YoY in August, with the ex-food and energy component holding steady at 4.0% YoY. Nearly all of the components increased. This is now the 10th straight month that headline inflation came in ahead of the 5-year average of 0.2 percent.
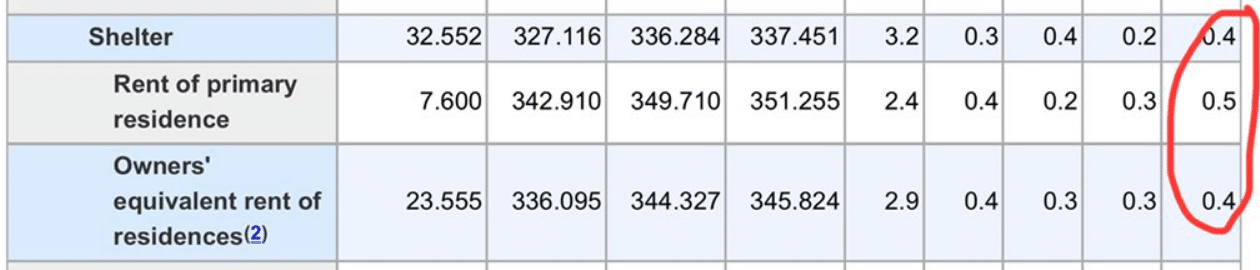
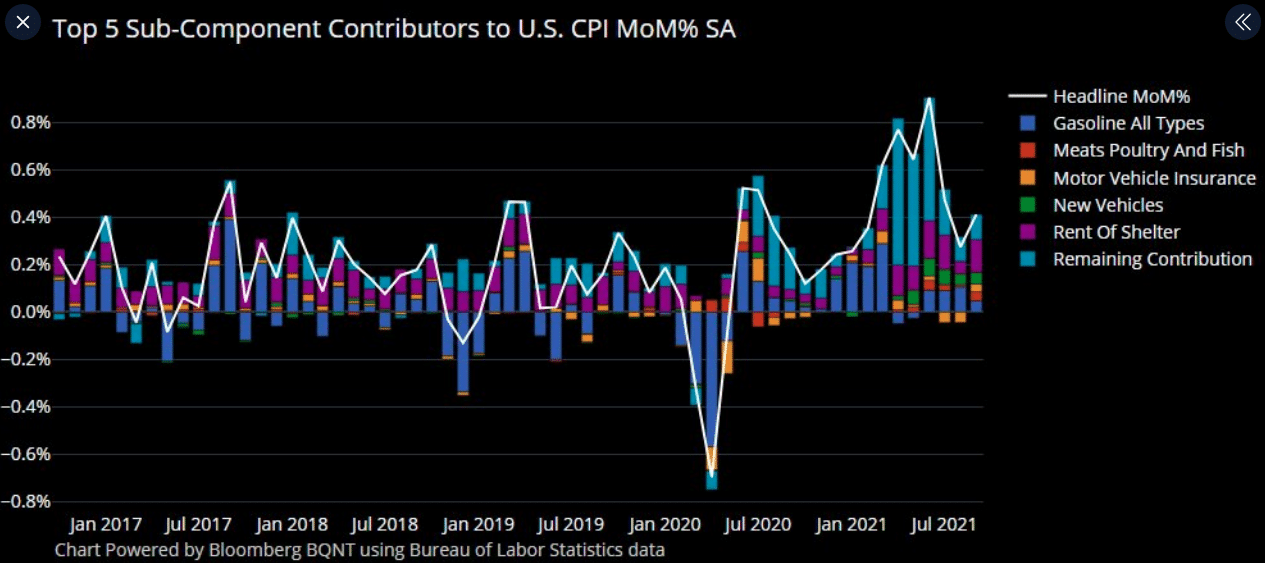
The two tables/charts above identify the impact of the eviction moretorium having ended in September, with a subsequent rise in rent of primary residence/rent of shelter rising swiftly. Rent inflation accounts for 31% of CPI (if you account for primary residence + owner rent equivalent. This will be a key component of the Consumer Price Index remaining elevated through year-end and the elevated level of this category won’t be anniversaried until this time next year.
Research Report Excerpt #5

A source of uncertainty today is that there are two different types of inflation: sticky and flexible. Sticky inflation, currently around 2.6% annualized, tends to exhibit longer staying power. Sticky categories include rent, owners’ equivalent rent, insurance costs and medical expenses.
Flexible inflation has climbed this year to nearly 14%, the highest since the 1970s. However, this level of inflation likely won’t last. The flexible category contains products such as food, energy and cars, where prices can move a lot higher or lower over time. For instance, that’s already happened with lumber, copper and soybeans. Prices for those products skyrocketed this spring and have since come down.
Research Report Excerpt #6
I do not favor such “sentiment” surveys or “soft data”, as they typically do not lend well to predicting realized consumer behaviors by way of consumer spending. The soft data/surveys often lend themselves to undershoot realized consumer behavior, and the recent trend in retail sales, a measure of consumer spending habits, highlights this point. In a nutshell, the consumer answers the survey questions in the UofM Consumer Sentiment survey that suggests they may have a lesser appetite for consumption of goods and services, but the retail sales data, which is the “hard data” invalidates the “soft data/survey”.
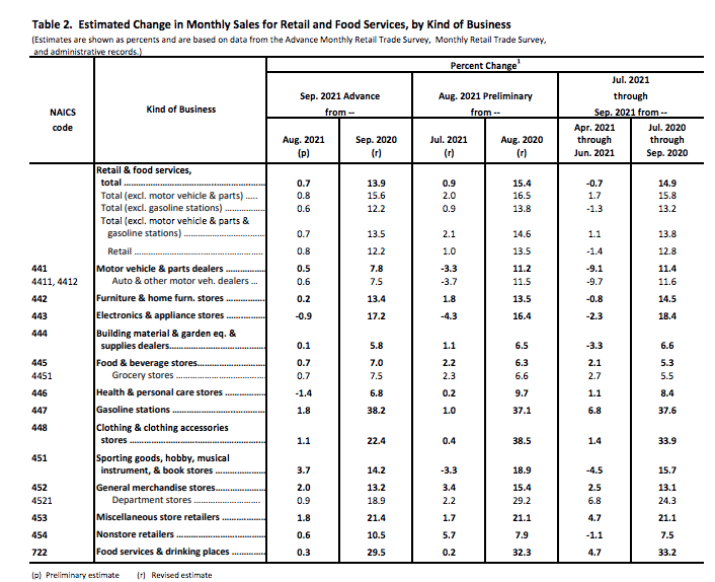
Despite what the UofM Consumer Sentiment report offers, the consumer continues to indicate they’re doing just fine, as their spending habits remain robust. That is important because they represent 70% of economic activity in the United States. (retail sales MoM and YoY by category in chart above)
The U.S. Census Bureau reported overall retail sales grew 0.7% month over month in September vs. forecasts for a 0.2% decline, while retail sales excluding autos and gas also saw solid gains, rising 0.7% month over month vs. estimates for a 0.4% increase. On a YoY basis, sales rose a solid 13.9%, slightly lower than August’s 15.4 percent. Excluding autos and gas, sales rose 15.6 percent. Total retail sales rose over the past 2 months and 3 of the past four, as shown in the LPL Financial chart below, despite the impact of the Delta COVID-19 wave this summer.
Research Report Excerpt #7
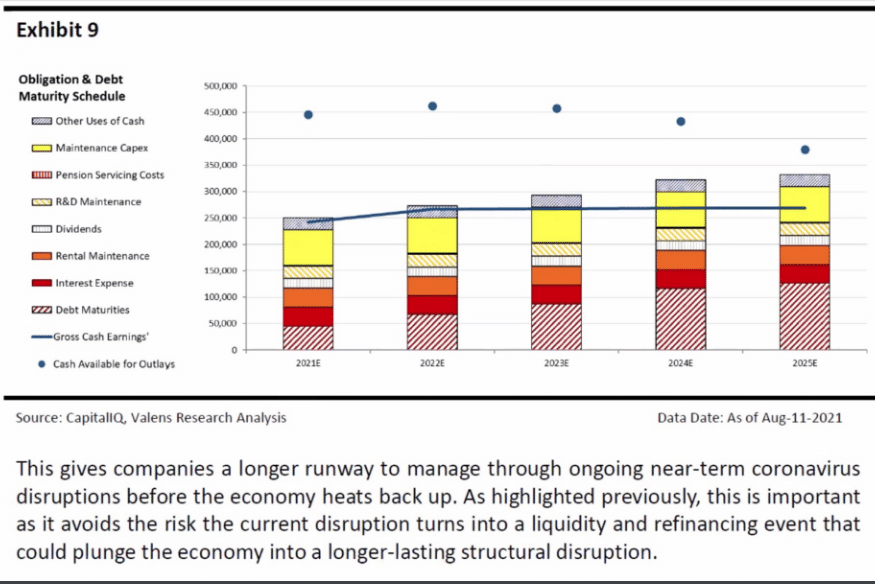
U.S. corporate balance sheets are the healthiest they’ve been in decades, so credit spreads should also remain tight The chart below shows U.S. Corporations having no material refinancing needs until 2026, which implies the opposite of a bear market as well!
Research Report Excerpt #8
Recall that last week, for Q3 2021, the estimated earnings growth rate for the S&P 500 was 27.6 percent. At this point in time, however, more S&P 500 companies are beating EPS estimates for the third quarter than average, and beating EPS estimates by a wider margin than average. Due to these positive surprises, the index is reporting higher earnings for the third quarter today relative to the end of last week and relative to the end of the quarter. The index is now reporting the third highest YoY growth in earnings since Q3 2010. And now, the blended earnings growth rate for the third quarter is 30.0% as of the end of the trading week.
Insight/2021/10.2021/10.15.2021_EI/sp-500-earnings-growth-q3-2021.png?width=920&name=sp-500-earnings-growth-q3-2021.png)
Research Report Excerpt #9
Johnnie B. “Dusty” Baker Jr. (born June 15, 1949) is an American Major League Baseball manager who currently manages the Houston Astros. He’s also famous for offering the following quote, that can serve investors very, very, very well:

“Positive energy lasts. Negative energy dissipates.”
In many ways, many-many ways, this is evidenced in all walks of life. For our investing purposes, our goals and dreams if you will, it never rings more true during the times when that negative energy shows up. The negative energy is to the investor’s advantage, as they consider a long-term time horizon.
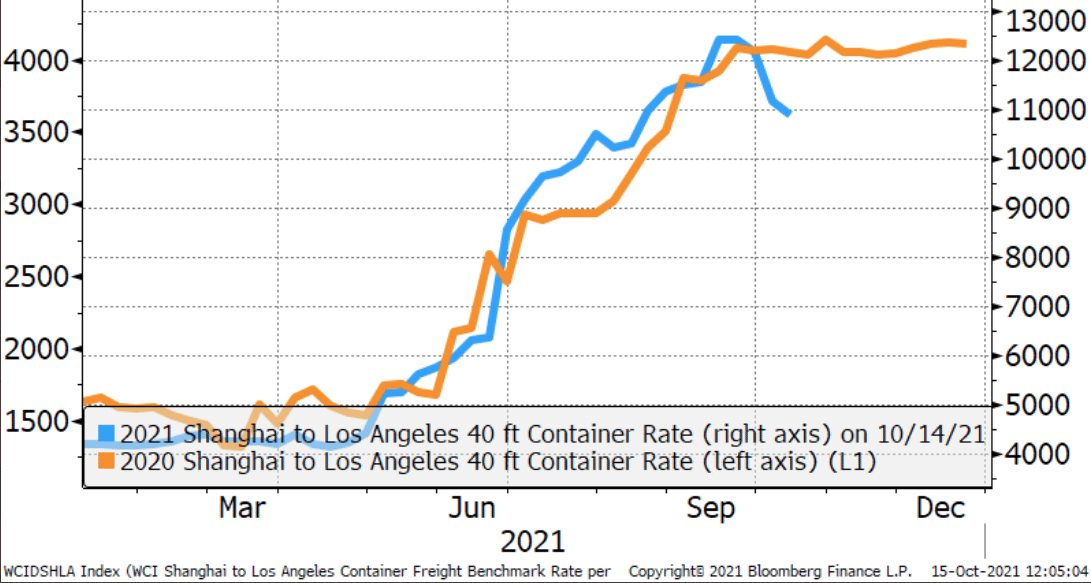
Think about all the negativity around inflation, shortages of supplies/materials/goods and the congestion at the ports. That can only last so long, human ingenuity steps in to solve problems and create a positive lasting energy. This is the quote from Dusty Baker that I think of lately when I look at the crested and descending trend line in container rates and anchored ships off the coast of California:
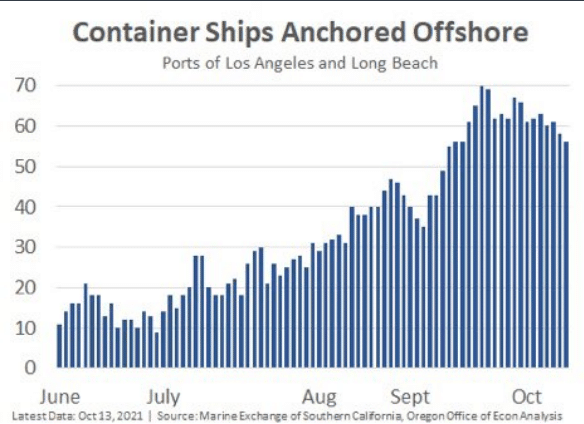
A savvy investor knows that the good or positives alway win out over the bad or negatives in the long run. That’s ultimately how a savvy investor thrives. When things get too negative, know that energy will soon prove fleeting and positive energy will arrive and sustain itself for a longer duration.


