
About half the S&P 500 companies have reported first-quarter results last week. Approximately 80% of those companies reporting results surpassed analysts’ earnings estimates, better than the 74% four-quarter average. And earnings outperformance was substantial, with companies surpassing average estimates by 9.4%, above the average of 5.1%, according to FactSet data.
For the week, however, the Dow still managed to fall 0.6% and the Nasdaq lost 0.4 percent. The S&P closed down 0.01% and that was enough for all three to post their first weekly decline of the past three weeks. Much of the damage to the major averages occurred in the beginning of the trading week and could be blamed on the 10-year Treasury yield crossing the 3% high water mark, a level not seen since 2014.
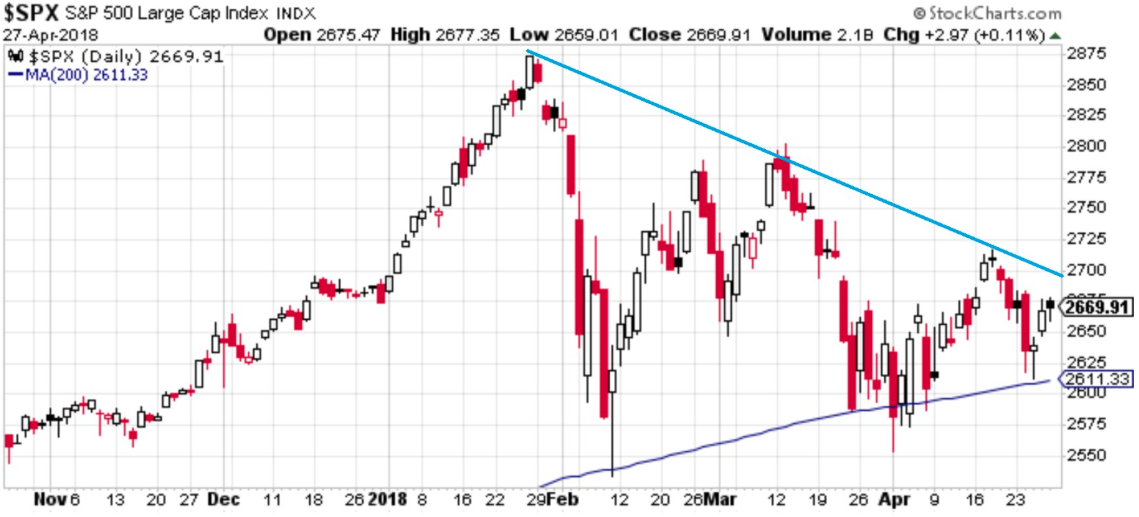
It has been quite disheartening for investors participating and watching the major averages move sideways over the last 60 days or so. The sideways action has also been quite volatile with the VIX average above 16 during the 60-day period. The heightened levels of volatility in the market breed investor angst and often find markets churning until a greater degree or quality of certainty is found, hence the sideways markets. This year marks 25 years of the VIX and it is no better fitting than to witness such record moves in the VIX complex than on such an anniversary.
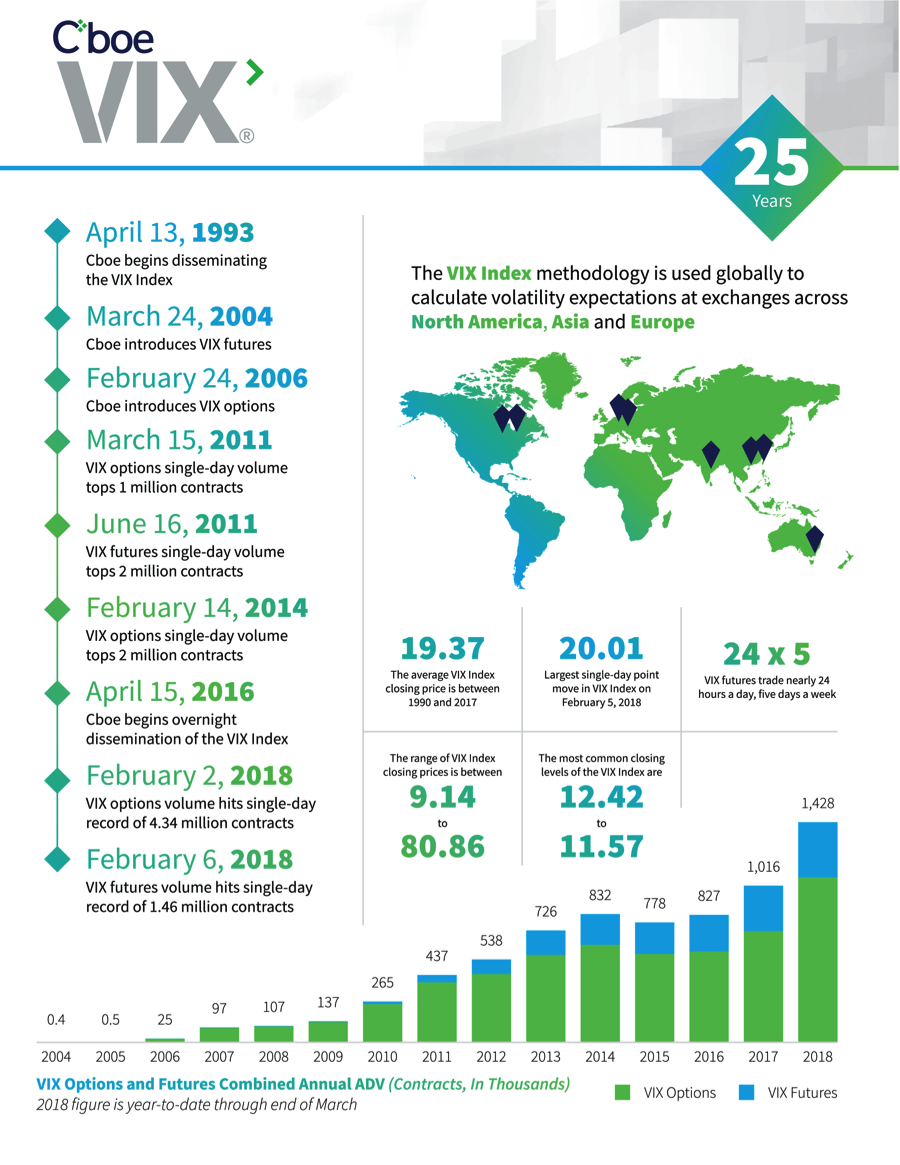
We’ve started to see the VIX complex break some records this year. The VIX futures term structure has found itself in backwardation for much of 2018, a very uncommon and extended sight throughout term structure history. As history suggests, term structure is generally in a state of contango, nearly 90% of the time. Having said that, term structure reverted from the unnatural state of backwardation to a more natural state of contango last week.
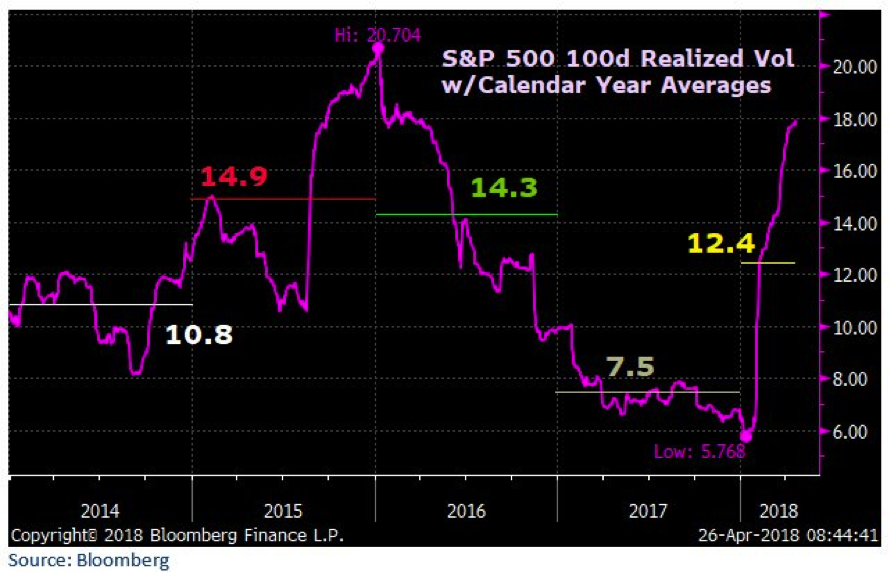
One of the ways in which Finom Group offers market perspective is through realized 100-day volatility in the market/benchmark S&P 500 over time. The following chart identifies very clearly the low levels of realized volatility last year were the extreme high sentiment point and not the norm that should be expected. This year, the market is simply reverting to a more normal state of volatility for which it would naturally seem to be extremely volatile by comparison.
So which way will markets head this week? The continued earnings picture, but also some key pieces of economic data will largely determine that. We have many headlines expected for the week and all of which aim right at investor sentiment and consideration surrounding inflation, economic strength and geopolitical issues. There is a good deal of relevant data to be released that includes the PCE data alongside Wednesday’s Fed Policy announcement. Most economists expect the PCE to continue to tick higher and ultimately achieve the Fed’s 2% inflation target objective in 2018. No change in rates is expected at this month’s Fed meeting, but the Fed’s language will be carefully scrutinized. Of course, the end of the week is bookended by the all-too important Nonfarm Payroll data.
Real and Frank Talk
The sideways and consolidation period for equities can only persist for so long. Eventually, the markets will either break to the upside or breakdown. There are no real and tangible signs of a recession in the economy; there is only a transitory slowdown at best and for which has been the precedent in past Q1 cycles. But more importantly, the trend for YOY retail sales and consumer spending remains on track for steady growth, where 70% of economic activity takes place. We are and should expect some levels of reflation/inflation in 2018 to present itself, but not impact the economy to any significant degree for another 12-18 months. So why all the angst and fear? Well, is it really angst and fear or normalization of price-to-earnings? Maybe we are just resetting the clock before the next leg higher and as markets follow earnings over time. There’s so much noise impeding the market’s progress in 2018 and investors may have to practice more due diligence than they had to over the last couple of years in order to extrapolate returns.
- “We are living in this time of great news and focusing on the possibility of future headwinds,” said Art Hogan, chief market strategist at B. Riley FBR Inc. “It’s a marked change from when everything was rosy,” he said, referring to last year’s market resilience. “I could punch you in the nose and you could say ‘That’s going to be good for earnings. Hogan’s advice is to clients: “Don’t listen to some of the noise, a lot of that is going to resolve itself.”
Earnings
So now let’s get into the heart of the market, earnings! As noted earlier in this report, earnings continue to come in better than expected week-after-week, forcing agencies to revise their Q1 2018 S&P 500 earnings forecast higher.
Aggregate Estimates and Revisions
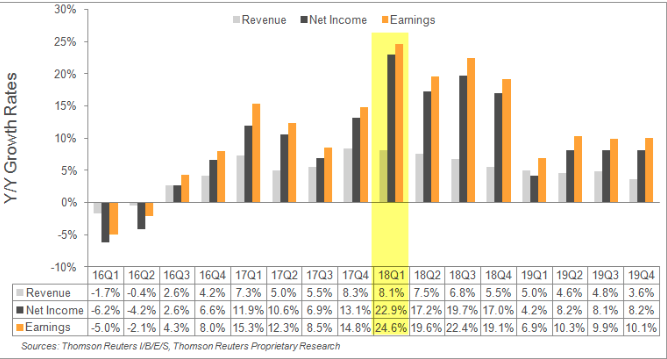
- First quarter earnings are expected to increase 24.6% from Q1 2017. Excluding the energy sector, the earnings growth estimate declines to 22.7%.
- Of the 267 companies in the S&P 500 that have reported earnings to date for Q1 2018, 79.4% have reported earnings above analyst expectations. This is above the long-term average of 64% and above the average over the past four quarters of 75%.
- First quarter revenue is expected to increase 8.1% from Q1 2017. Excluding the energy sector, the revenue growth estimate declines to 7.7%.
Many investors and analysts have suggested, “This is as good as it gets” with regards to corporate earnings. But if that’s the case, the S&P 500 is getting mighty cheap and with a multiple less than 16 presently. Much of the “good as it gets” characterization, that also suggests all the earnings growth is a one-off tax reform affect, may be found in error. It has been uncertain as to whether or not the lowered corporate tax rate would wind up with greater buybacks and dividends or actually feed through to increased capital expenditures. A good deal of that subject has now found some hard and fast data come to light, as corporate earnings season peaks.
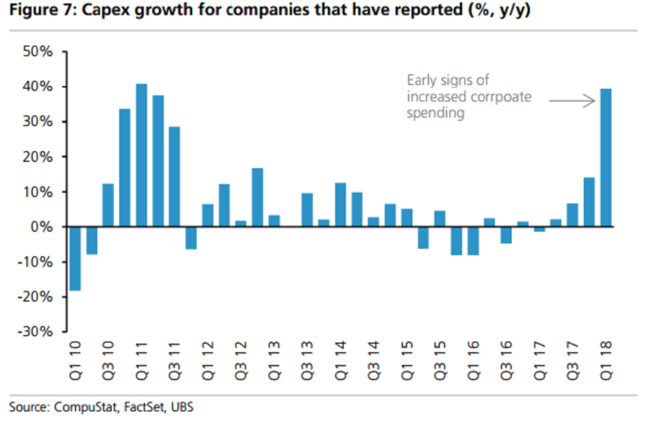
Finom Group expects this spending to build factories, upgrade equipment and rebuild infrastructure to act as a tailwind for the economy. It’s quite logical and possible that the increased level of expenditures by corporations serves to prolong the economic cycle, which would otherwise make “this time different”.
As far as the trading environment goes, the heightened levels of volatility can present a great deal of opportunity depending on a trader’s discipline and resourcefulness. Finom Group offers many trade alerts through its private Twitter feed on a weekly basis. Our last trade of the previous week was on shares of Macy’s (M) that found a new, intraquarter high trading price which we determined would aid in the act of profit taking.
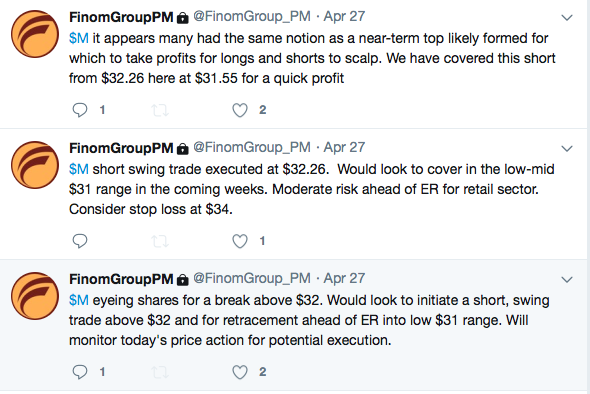
The trade set up nicely and was executed as predetermined intraday for a nice profit. Subscribe to finomgroup.com today and access our trade alerts!


