Geopolitical exogenous events continue to rattle markets and are creeping into the macro-fundamentals by way of economic data. U.S. equity markets were set to open lower on Tuesday and after the elongated holiday weekend, as additional tariffs were levied against China on September 1st. While that geopolitical issue was met with a flight from risk assets, the fundamental economic data exacerbated the declines in the first half hour of U.S. trading.
The Institute for Supply Management’s manufacturing index fell to 49.1% in August from 51.2% in July. This is the lowest reading since January 2016. Economists surveyed by the Wall Street Journal forecast the ISM factory index to slip to 51.0 in August.
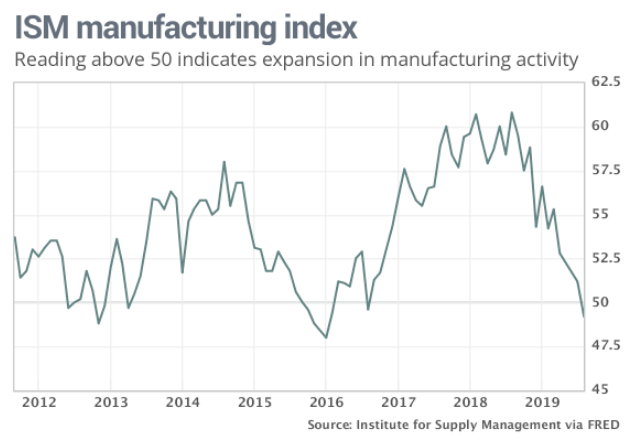
The IHS Markit reported that its manufacturing purchasing managers index improved moderately in the final reading in August. The index rose to 50.3% in August from the 49.9% flash reading.
Within the ISM Manufacturing data, some of the more concerning issues remain with employment and export orders.
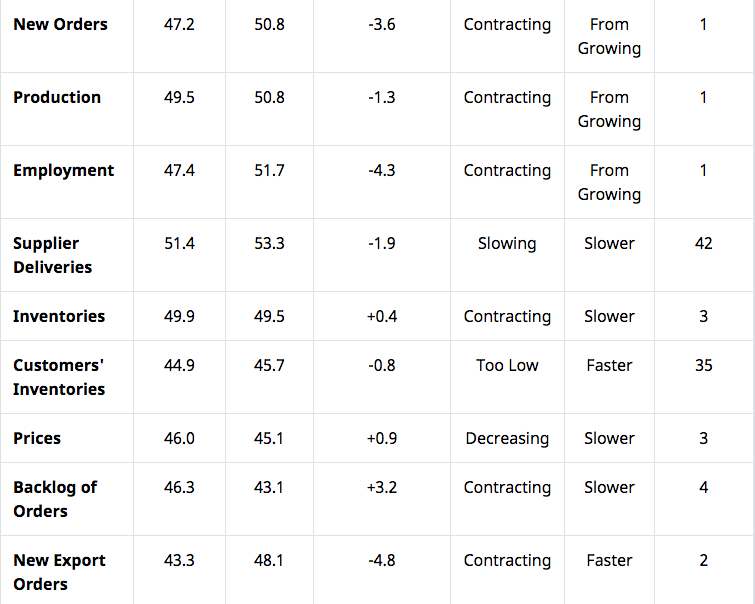
Based on these survey results, the ISM Manufacturing Index may remain in contraction territory over the next couple of months without a significant boost to confidence and activity. After the release of the ISM Manufacturing Index that indicated the first contraction reading since 2016, the major averages added to their losses and tumbled to their lows of the trading session
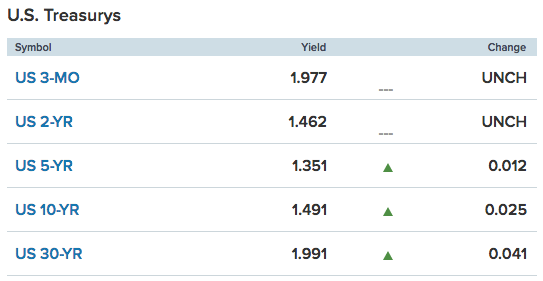
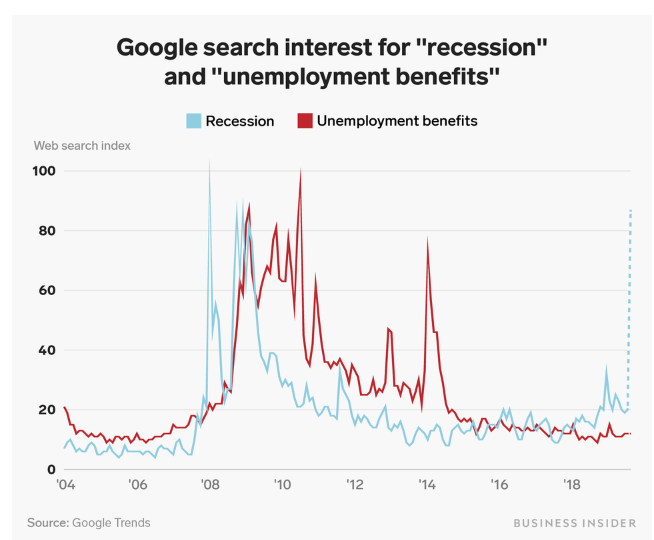
The poor economic data came with increased implied volatility (VIX) and found bond yields falling to their lows of the trading session. The read on manufacturing was somewhat expected and will prove to impact Leading Economic Indicators (LEI) reading when it is released later this month. Given the weakening economic data in certain sectors of the economy, a yield curve inversion, a Fed rate cut in-hand and more expected to come, recessionary fears remain elevated. This is a topic Finom Group covered in its recent weekly Research Report as follows:
“Google searches on “recession” have spiked quite notably recently, but searches on “unemployment benefits” have not.”
While nothing is pointing to a near-term recession, that doesn’t mean we simply can’t talk ourselves into a recession, invoking a self-fulfilling prophecy of sorts. There are several areas of concern with regards to the economy that continue to raise such recessionary rhetoric if not propaganda in the media. It’s mostly hyperbole, but much of it points more toward asset classes than economic data. Take for example this article from CNBC yesterday:
A recession is an economic condition, a characterization of negative EPS growth for 2 consecutive periods as most text books define. Yes, we’re aware that such a occurrence didn’t take place in 2001 even though the NBER decided to characterize the period as recessionary. According to the National Bureau of Economic Research(NBER), which is the private, nonprofit, nonpartisan organization charged with determining economic recessions, the U.S. economy was in recession from March 2001 to November 2001, a period of eight months at the beginning of President George W. Bush’s term of office. See map of GDP results for the 2001 year below:
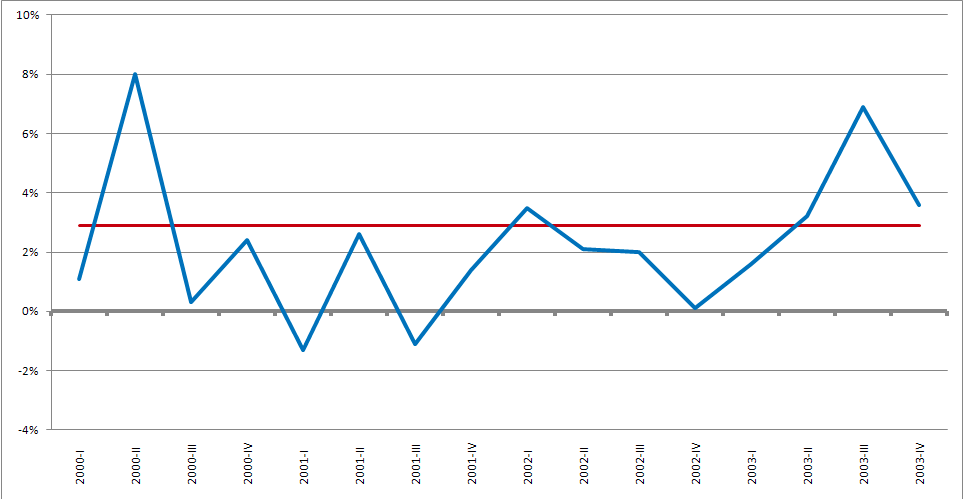
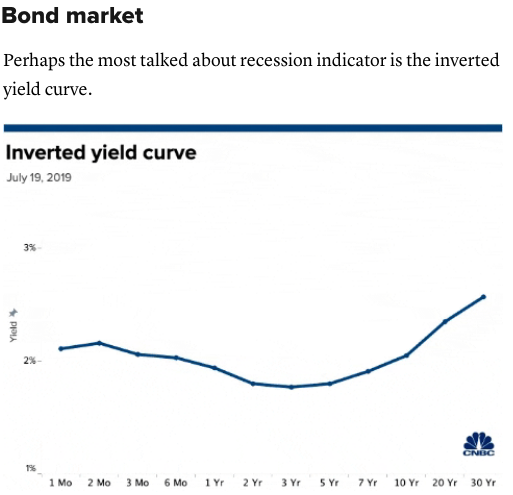
NOT A TEXT BOOK RECESSION! But who’s gonna argue with something that took place some 18 years ago. It does beg the question though whether or not the 1998 yield curve inversion was a false positive signal for a recession. Within the noted CNBC article, they still believe that one recession signal is a yield curve inversion.
Of course, the article also denotes the price rise in Gold and plunge in Copper prices as recessionary signals, even though they are not economic data points. But then they totally redeem themselves with articulations on corporate earnings growth, or lack thereof.
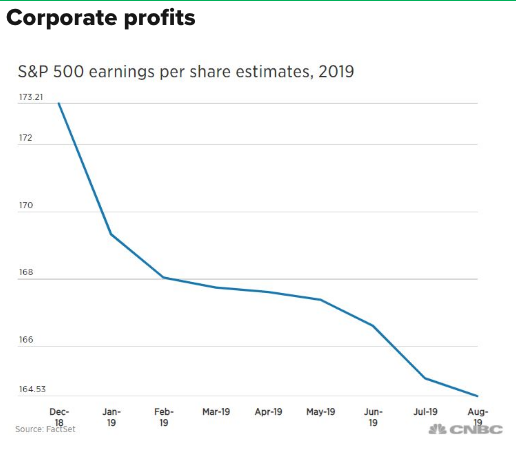
“Earnings growth estimates have come down drastically this year. Last December, analysts estimated S&P 500 earnings growth for the year would be around 7.6%, according to FactSet. That number is now around 2.3%.
Goldman Sachs and Citigroup strategists last month reduced 2019 and 2020 earnings estimates for the S&P 500, citing a sluggish economy, trade war threats and potential currency devaluations.“
While shipping indices have been all over the map this year, from the Baltic Dry Index to the Harper Index, CNBC denotes the dire activity recorded in the Cass Freight Index. Keep in mind, the index had a nice bounce off the bottoms from December 2018, but since the Mexico tariff threat and raised tariffs on China back in May, the Cass Freight Index has been on the decline again.
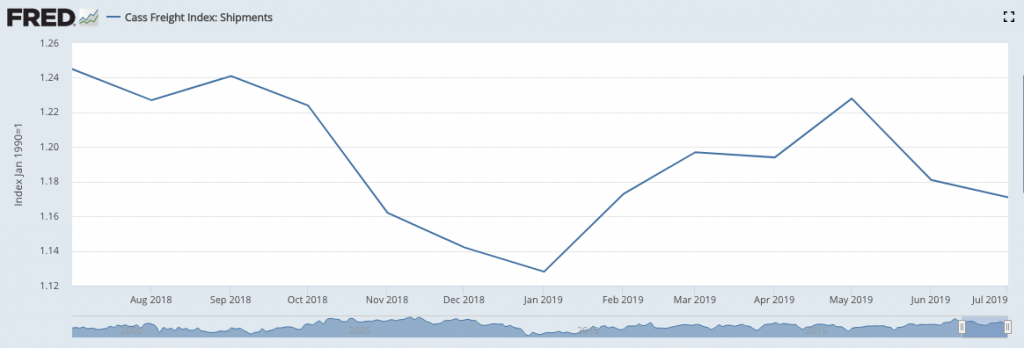
The Cass Shipments Index fell 5.9% in July, following a 5.3% decline in June and a 6% drop in May.
“We repeat our message from last two months: the shipments index has gone from ‘warning of a potential slowdown’ to ‘signaling an economic contraction,’” the July report said. “Although the initial Q2 ’19 GDP was positive, it was not as positive upon dissection, and we see a growing risk that GDP will go negative by year’s end.”
Trade uncertainty and a protracted trade feud have definitively impacted shipping indices since July 2018. Business spending has been curtailed with gross private domestic investment falling some 5.5%, the worst since the fourth quarter of 2015, according to the Commerce Department’s quarterly GDP report. And now that ugly ISM Manufacturing reading released Tuesday. How many of these are really recessionary signals though and aligned with the modern economy that is more service and consumer oriented? Should we consider anything from the manufacturing sector as recessionary, given its smaller contributions to the economy in perpetuity? The following chart suggests we shouldn’t:
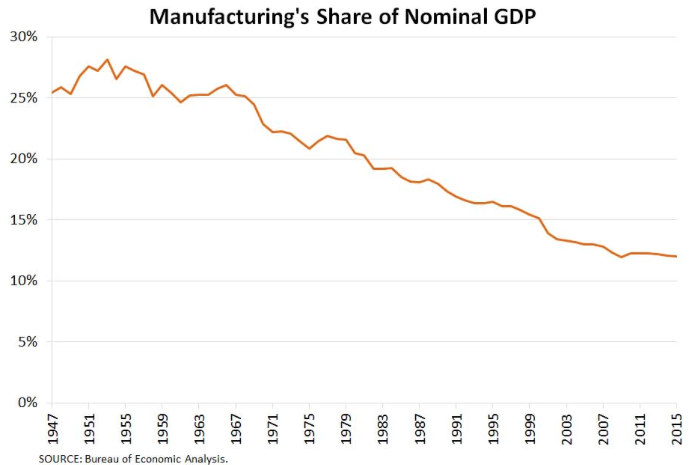
Manufacturing has contracted 9 other times since 1948. The S&P 500’s one-year return averaged +12.0% and was positive 8 of those 9 times, with risk of -4.7% return compared to reward of +12.7 percent.
“Jeff Miller of Dash of Insights says that the ISM’s own analysis suggests that August’s reading of 49.1, if annualized, implies real GDP growth of 1.8 percent. That is not really a surprise, and also not a recession indication/confirmation.”
Moreover, what about chip sales. There was a time when the Dow Jones Industrials Transportation Sector (DJT) was also thought of as a recession indicator, or at least something to warn of an impending market correction. It’s known as the Dow Jones Theory. Having said that, in the modern, information technology era most everything we use to compute, transmit, copy and communicate demands chips. It’s why many have become more accustomed to favor the chip sector sales as an indication of economic strength or weakness since the turn of the century. Undoubtedly, this sector has been work for much of 2019.
Global chip sales fell YoY for a seventh straight month in July, according to the Semiconductor Industry Association late Tuesday. For July, global sales fell 15.5% to $33.4 billion from the year-ago period. “While global semiconductor sales in July were once again down on a year-to-year basis, month-to-month sales were up slightly,” said John Neuffer, SIA president and CEO, in a statement. Looks like things may have hit an interim trough in chip sales?
With the S&P 500 basically stuck in the mud over the last 12 months, all of this weakening in the economic data and corporate earnings might suggest the market has been discounting growth.
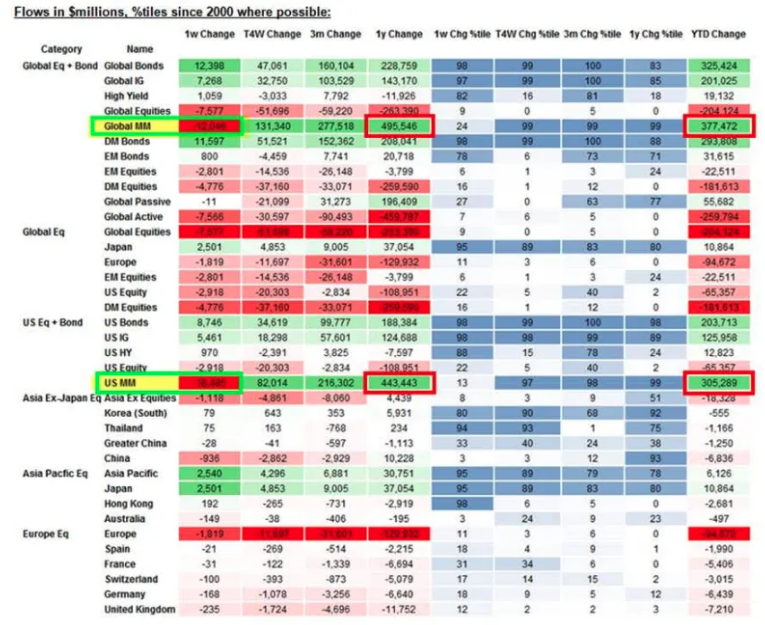
The S&P 500 forward 12-month PE ratio is right around 16.8 and hardly reflecting the relative risk premium it might deserve when considering the “risk free rate” in bonds.
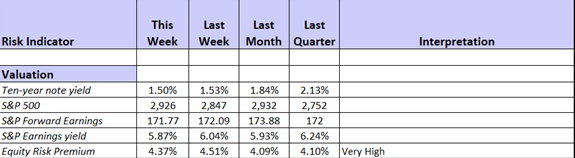
The market rarely makes a mistake and is always forward-looking. It aims to price in the next 6 months earnings valuation, somewhat dependent upon the equity risk premium model. As displayed in the above table, as the 10-year Treasury yield has fallen nearly 1.4% since its 2018 highs, the equity risk premium elevates and suggests equities have a greater value going forward. Some of these fundamental sentiment indicators can also be realized in the market technicals.
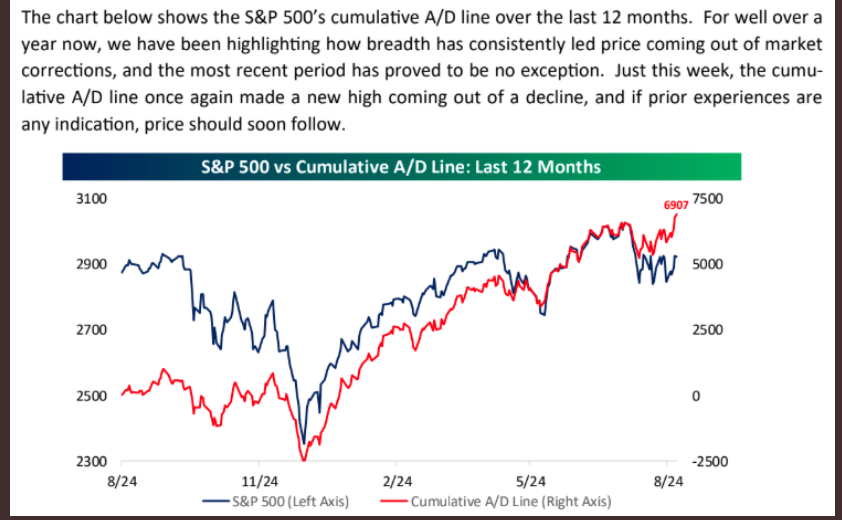
Last week, both the NYSE A/D and S&P Cumulative A/D hit, new record level highs. Usually, these breadth indicators “signal/indicate” new highs are ahead for the S&P 500. In Finom Group’s weekly Research Report we discussed these bullish technical achievements.
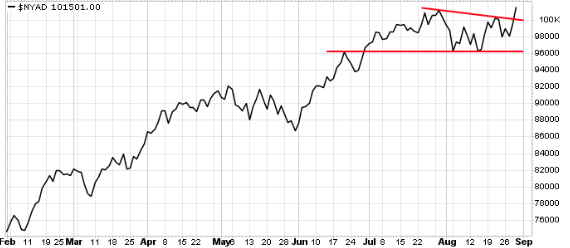
“Last week, the cumulative advance-decline (A-D) line for both the NYSE and the S&P 500 made a new all-time high. The A-D line sums the net number of stocks moving up on the day added to yesterday’s total. The idea is that when the A-D line is rising, more stocks are moving higher and breadth is considered healthy. In other words, it’s a bullish sign for stocks. The not so great news is that the gains for stocks haven’t always occurred right away. The S&P 500 went nowhere for several months in 2016. That was also the case in 1993 and 1996, for example. Nonetheless, the breakout to a new high in the A-D line while the S&P 500 is still below it’s own ATH looks bullish. But there’s more, take a look at the following chart of the S&P 500 and moving averages within their respective clusters and during consolidation periods:”
Bespoke Investment Group agreed with us in a recent tweet they issued, concerning the S&P 500 Cumulative A/D line.
Despite the economic data suggesting near term headwinds for the economy, a recession is unlikely within the next 6 months, absent further trade war escalations. The market technicals suggest the economic fears/woes are being overblown in the media and historical statistics suggest that the bullish market technicals are more accurate than the media’s hyperbole about the weakening economy. August was rough for the markets, and resulted with a greater than 1.5% loss to the S&P 500. With the latest set of economic data and tariffs, September hasn’t gotten off to a positive start. But September’s drawdown may be a net positive for the market in September also, at least based on the 200-DMA.
According to the latest study performed by LPL Financial’s Ryan Detrick, September can be a rough month, but how stocks are doing heading into it could greatly influence the month’s performance.
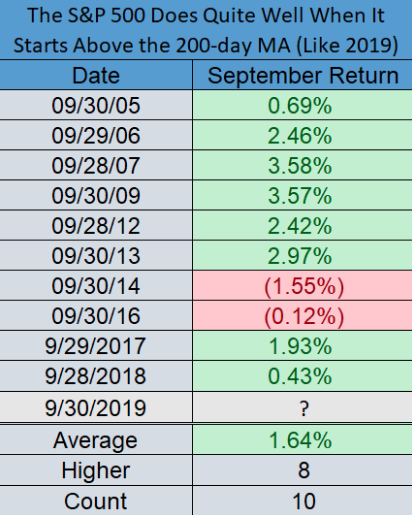
As shown in the table above, for the past 10 occasions that September began above the 200-DMA (like 2019), the S&P 500 was higher 8 times for the month.
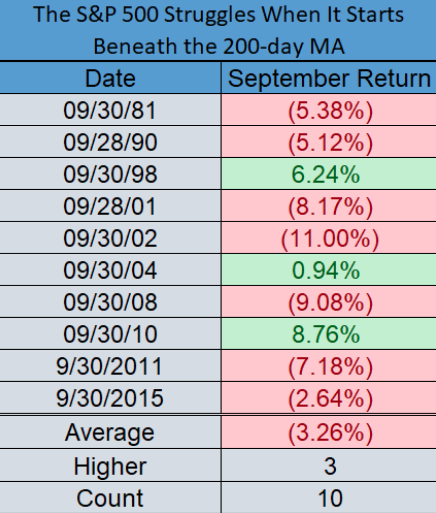
According to the table above, for the past 10 times the benchmark index started September beneath the 200-DMA, it was higher only 3 times in September. It appears it is all about where you begin as it pertains to the probabilities for the month of September.
There’s actually a good deal of optimism portrayed by the analysts and strategist community regarding S&P 500 expectations for September, at least. With a growing fear of the economy and risk assets, BofAML’s strategist says buy stocks!
“When investors are this bearish, historically, it’s been a great time to buy risky assets like stocks and commodities,” BofAML global investment strategist Jared Woodard said on “Closing Bell. ”
Woodard stressed he was looking at a one-to-three-month investment timeline, citing larger macro risks in the economy for next year.
But with investors already in bearish positions and favorable policy coming from the Federal Reserve, which cut interest rates in July for the first time in a decade and is expected to issue another quarter-point cut at its September policy meeting, Woodard said he sees significant short-term upside.
Mislav Matejka, head of global and european equity strategy at J.P. Morgan aligns with Woodard’s belief near-term as well and insists that the market will indeed move higher.
“We now believe that (the) market will advance into year-end,” Mislav Matejka, head of global and european equity strategy at J.P. Morgan said in a note to clients Monday.
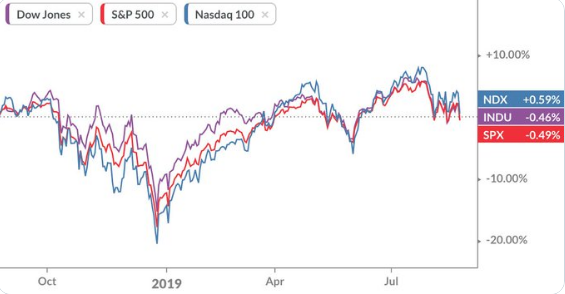
Markets had a volatile month in August, largely driven by the U.S.-China trade war. The Dow Jones industrial Average had its worst day of the year on Aug. 14 when the bond market’s main yield curve inverted, as investors poured into safe haven bonds while global economic uncertainty reigned. The confluence of low interest rates at home and abroad and a tariff war with China caused a pullback in August, but Mislav said technicals have improved and U.S. stocks will go up.
Mislav´s 5 reasons to remain bullish:
- Fed is easing, but without HY spreads or jobless claims spiking, both of which typically deteriorate into a recession. Crucially, if initial Fed cuts are not followed by a recession, the next 3, 6 and 12 months equity returns were historically very strong–
- Global activity momentum is likely to look better into year end,with signs of manufacturing trough. Labour markets in key regions remainstrong, with rising wages. Jobless claims continue to bevery well behaved. A US recession has never started while the unemployment rate was falling. M1 has turned higher in all the main regionsand Capex/depreciation ratios are very low. We maintain a rather non-consensus view that China is healthier now than it was in ‘15-’16 episode, as the FX reserves are stable, Chinese house prices are rising and corporate overcapacity problems, as well as leverage, have reduced
- Q2 results were better than consensus projections. Beats are seen in all regions, with US at +6% and Europe at +2%. Consensus now projects lower EPS growth rate in 2H than what was delivered in 1H –this might end up too conservative.As many as 50% of corporates raising guidance for the year. In contrast to consensus, we believe profit margins could surprise positively into next year, as productivity is up
- Equity P/Eslook undemanding, with MXWO at 15.0x fwd. P/E, outright below the long-term average
- Discretionary investor positioning remains defensive, with no inflows,which we think is a good contrarian indicator.
“We’re in the midst of a “sea change” and an equities “force-in is well underway”. That’s the latest suggestion from Nomura’s Charlie McElligott last Friday and as the markets rounded out a strong 2.5% gain on the week. McElligott tends to favor analysis surrounding positioning or gamma exposure to the S&P 500.
McElligott writes, in a Friday note, adding that “with cleaner Dealer positioning and some lumpy strikes at 2950, 3000, 3025 and 3050 strikes, it’s increasingly ‘Gamma Gravity’ time”.
“Why we’re approaching 2,950 and why 3,000/3,050 are very much in play” on the S&P into next month’s mid-month expiry.”
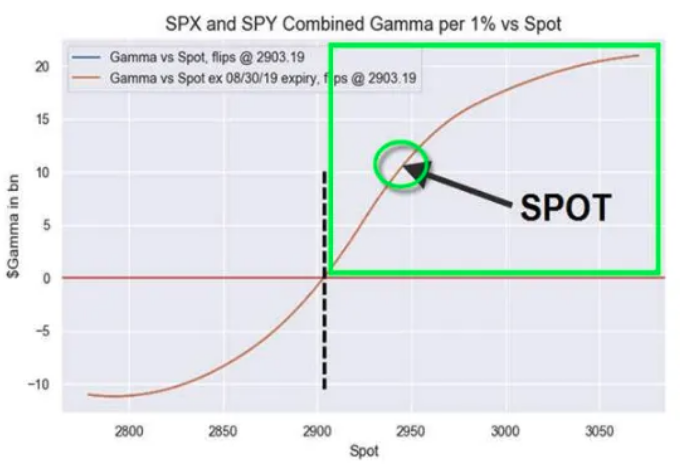
An updated dealer gamma positioning chart shows we’re squarely in the benign long gamma zone, which McElligott reminds us acts as a “shock-absorber” that should, all else equal, “help us ‘get sticky’ into the big upside strikes”. All else equal is code for “NO EXOGENOUS SHOCKS TO THE MARKET”! This would include FOMC hiccups and Trump flare ups on trade!
“Current ‘gravity’ has pulled-us near the 2,950 strike in a vapor-trail, where we see $3.4B of $Gamma”, he details, adding that the “upside strikes which are very much ‘in-play’ from here into September 21st expiry [are] $3.9B at the 3000, $1.5B at the 3025 and $2.5B at 3050.
There is a potentially massive ‘source of funds’ into any capitulatory grab-back-into risk assets on this further sentiment stabilization, particularly with the +++ ‘buy’ flows noted above for US equities into mid-September.”
And so here we are after losing nearly 300 points on the Dow and 20 points on the S&P 500 Tuesday, bouncing back Wednesday and with Hurricane Dorian pounding the Atlantic coast with rains. It’s better than Dorian making landfall, don’t get us wrong, but we’ll certainly find some weather related shortcomings in the near-term economic data as well. Again, the macro and geopolitical creeping into the fundamentals. Speaking of the geopolitical…
The global equity markets are rebounding from Tuesday’s losses on more geopolitical headlines. Hong Kong leader Carrie Lam announced the withdrawal of a controversial extradition bill that has plunged the city into its worst political crisis in decades, a source with direct knowledge of the matter told Reuters.
Lam made the announcement in an internal meeting with pro- establishment lawmakers and Hong Kong delegates of China’s National People’s Congress. She is expected to make a public announcement later on Wednesday.

A senior government source also confirmed the impending announcement to Reuters of the withdrawal. With the announcement, the Hang Seng Index rose nearly 4% on the trading session, or just under 1,000 points. That risk-on sentiment has spill into Europe and U.S. equity futures. Some of this may have been laying underneath the surface of the U.S. equity markets Tuesday.
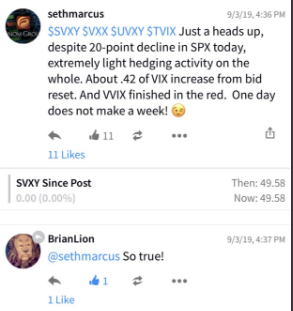
It wasn’t easy to see, but despite the sharp moves lower in the major averages on Tuesday, there was little hedging activity in the VIX complex. In fact, VVIX finished in the red and the VIX itself was up only .63 points and still finished the day under 20. Did institutional investors with boots on the ground in Hong Kong know that the Lam was to remove the controversial bill? It wasn’t until late in the trading day that we were able to recognize the lack of hedging and contemplate the issue.
But there were other indications that something was afoot with regards to risk during the latter hours of Trading on Tuesday. Oil rebounded significantly and after breaking below $53 in the morning hours. Crude rallied more than a $1 to close near the highs of the trading session, post the release of the ISM data. Yields followed the trajectory of Crude as the two trading very much in lock stock Tuesday afternoon. (Chart of TNX and Crude Oil Tuesday)
Hindsight is 20/20, but it’s clear that with all the major averages also finishing strongly into the closing bell, the big boys knew there was a headline a’coming! And we’ll leave our readers on a positive note with the yield curve, 2s/10s, un-inverting once again.