
Divergence! A one-word sentence used appropriately to describe last week’s trading action where the Dow was significantly lower than its peer indices. The Dow Jones Industrial Average rose 119.19 points to 24,580.89 on Friday. Friday’s close marked the first gain for the index in nine sessions, snapping its longest losing streak since March 2017.
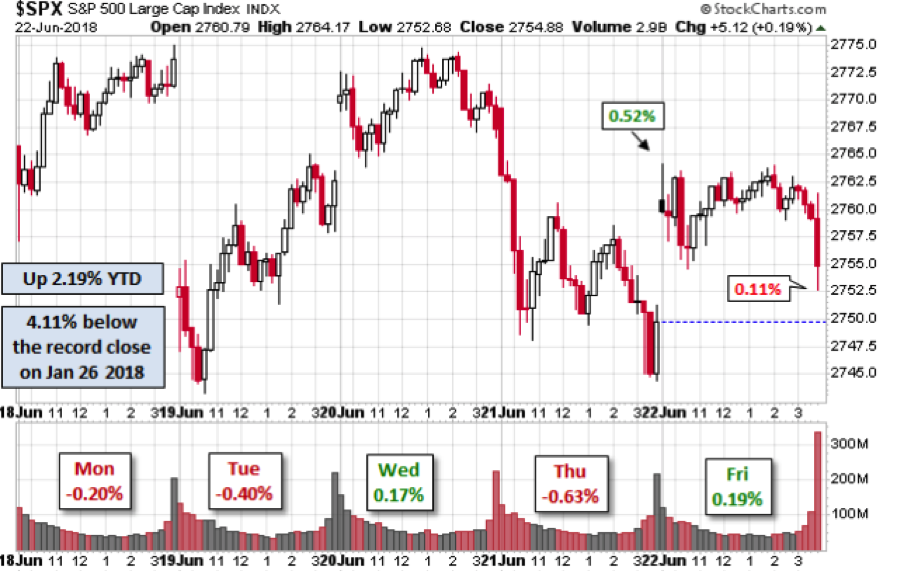
Looking more closely at the market’s broadest index above, we see that the S&P 500 is up 2.19% for the year and 4.11% off of its record close. Next week will likely prove a very important week for the S&P 500 and its peer indices. At present, the S&P is technically sound and above support levels.
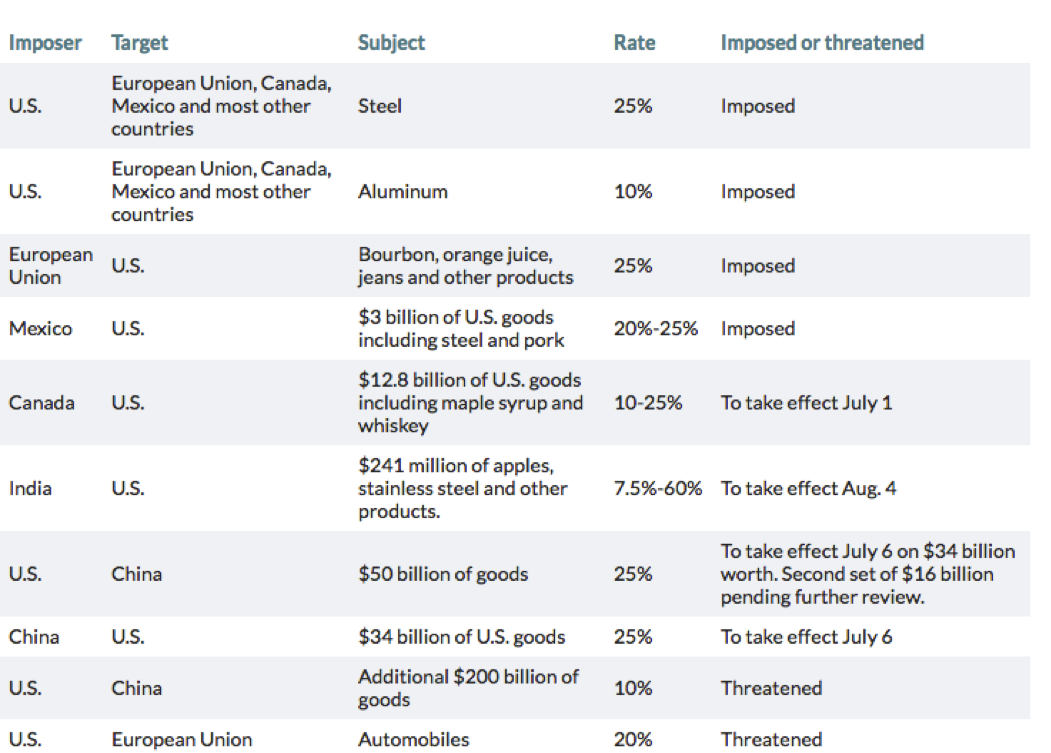
It wasn’t too long ago that the threat of a trade war seemed rather distant and unlikely. But as weeks and months have passed since the initial comments made by the U.S. administration on the subject of tariffs and trade deficits, the unthinkable has evolved to the possible. In the past, we could have dismissed the rhetoric from the U.S. administration as nothing more than negotiating fervor and exuberant tactics, but since implementing some of the threatened tariffs on allies; we can no longer dismiss such rhetoric on trade. As an update on what has been threatened and what has been implemented with regards to trade, the following table serves as representation of where we are and where we may be going in this ongoing trade dispute.
If the past is an indication of the future, for which we certainly hope it is not, the present threatened tariffs have the potential to delve the global economy into economic strife. With that in mind, economists at Bank of America Merrill Lynch modeled an all-out battle, assuming a global 10% tariff on all goods and services. (Trump has threatened a 10% rate for the $200 billion Chinese goods tariffs.)
Running it through FRB/US, the Fed’s macroeconomic model, the scenario isn’t good but doesn’t appear catastrophic. GDP growth would be shaved by as much as 0.4 percentage point in the first year and as much as 0.6 percentage points in the second. Core inflation would rise slightly, as the spike in import prices would be arbitraged by a rising dollar. The Fed would probably slow its pace of interest rate hikes as the trade skirmish continued. Here’s what Barclays had to offer on the matter late last week:
“An across-the-board tariff of 10% on all US imports and exports would lower 2018 EPS for S&P 500 companies by ~11% and, thus, completely offset the positive fiscal stimulus from tax reform.
Furthermore, the impact on exporters which would be directly affected, would be 5%, while that on US companies that import finished goods or inputs would be higher, at roughly 6%. Barclays finds that the impact of tariffs varies substantially across sectors, with industrials being particularly vulnerable, and although technology companies have a large amount of foreign revenue, they would not be directly impacted because this revenue is attributed to their foreign subsidiaries. The impact on the energy sector is large but that is mostly because of exposure to trade within NAFTA.”
What’s somewhat remarkable is that in the face of these already implemented tariffs and threatened tariffs; the market has proven quite resilient. Of course, that could change with a tweet and on a dime, but nonetheless it has been remarkable. While there remains far more negative analysis and commentary on the current trade spat, there’s little being offered with regards to a positive outcome that includes the elimination of global tariffs or cooler heads prevailing. There’s good reason for lesser positive sentiment on the subject matter though and that is because of the harsh stance taken by the United States that seems to defy the understanding of trade deficits, but plows forward defiantly and at the expense of some U.S. allies.
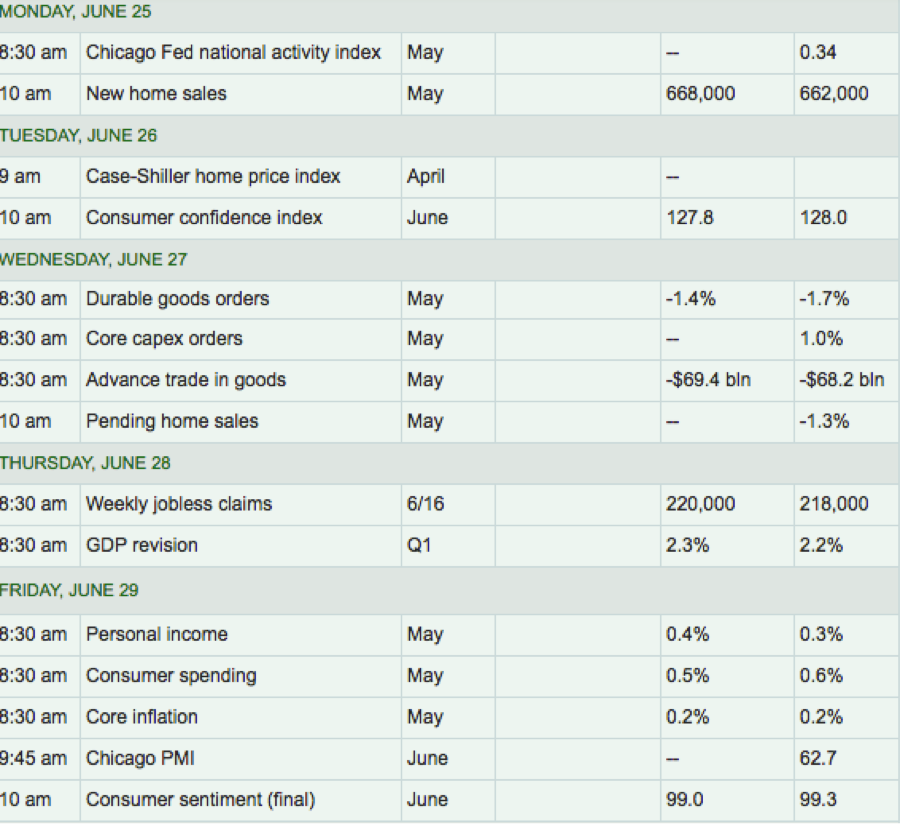
If all one was to consider was the current state of the U.S. economy in their investing and trading activities, the outlook would look robust and with multi-year high consumer sentiment and overall GDP. The economy is likely to grow close to a 4% annual pace in the second quarter after a 2.2% gain in the first three months of 2018. That would put the U.S. in good position this year to meet or beat 3% growth in gross domestic product. The last time the U.S. achieved such a growth rate was 11 years ago. Indeed, the economy has never gone this long before without reaching 3% GDP. Nonetheless, we’ll get a second look at Q2 2018 GDP this coming week. As indicated in the table below, provided by MarketWatch, most of this coming week’s economic data centers on the housing market.
Now that we know what to expect in the way of economic data, let’s get back to the markets. In spite of the relative S&P 500 outperformance against China’s market last week and in the face of rising trade tensions that seemingly ended the week with President Trump threatening to impose 20% auto tariffs on European cars, investors did adjust their risk profile. What’s a little “scary” right now is the great divergence in certain sectors. Remember, all 3 major indexes fell last week, it’s just that the Dow was the headline while the SPX and NASDQ didn’t fall enough to scare-up media interests. Look at this chart below:
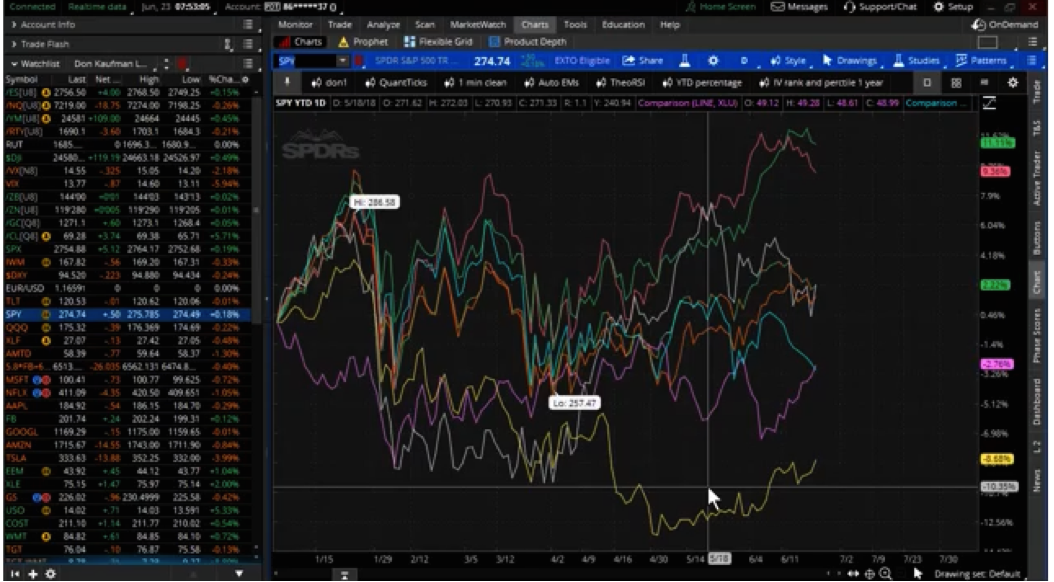
What you’re looking at is what looks like random lines across the Spiders (SPY) chart. But this is in fact some of the largest sectors of the index including the tech sector, materials, consumer discretionary, consumer staples, utilities etc. And what you see in the chart is a lot of market divergence. Correlations have completely broken apart. For those of you who favor trading short volatility, this is a good thing. The less correlation, the less volatility in the marketplace. But underlying this unique characteristic may be an awaiting market surge in volatility that drives sector re-correlation. Markets can adjust to anomalies rather quickly.
The underperformer in the chart is the XLP or Consumer Staples sector. The second worst performer is the XLU or Utilities sector. For the most part, these are considered your safety sectors and tend to perform better when investors are found with heightened levels of concern in the markets, fear if you will. They tend to be strong dividend payers as well. What has us a little concerned presently and when we review last week’s market sector performances is that these two sectors rose last week while the XLK, one of the top sector performers declined. The XLK or tech sector is that top pink squiggly line and just above that is XLY or consumer discretionary sector. The bottom squiggly line is the XLP followed by the purple squiggly line, which is the XLU. The divergence between these sectors is some 20%, which is huge and creates a liquidity concern, given concentrated interest in the sectors.
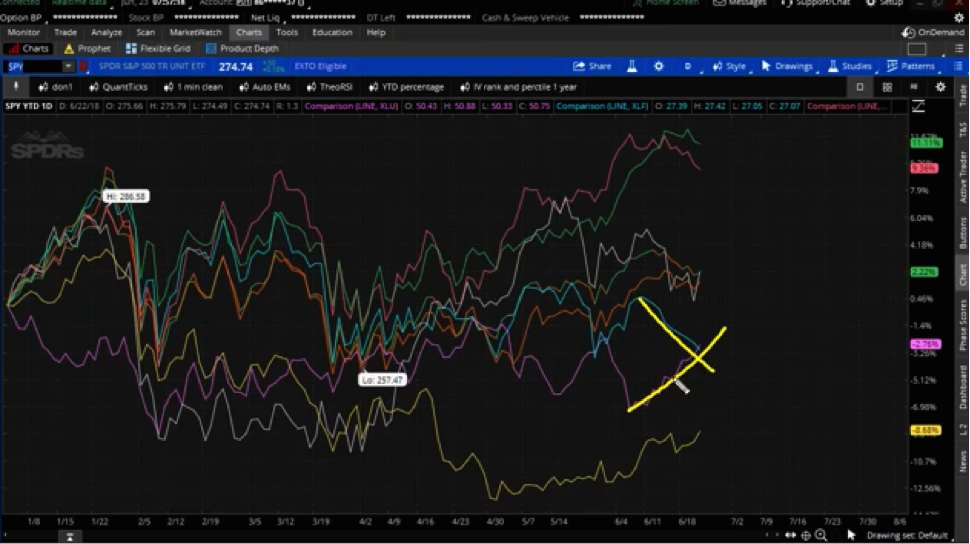
In the chart above, the utilities are converging with the XLF or financial sector. This is happening even with the positive news surrounding the recent results from the Fed’s bank stress tests. More to the point, it’s pretty clear that investors were harvesting safety last week and we think it is largely due to the chronology of events regarding trade. One more chart from finviz.com.
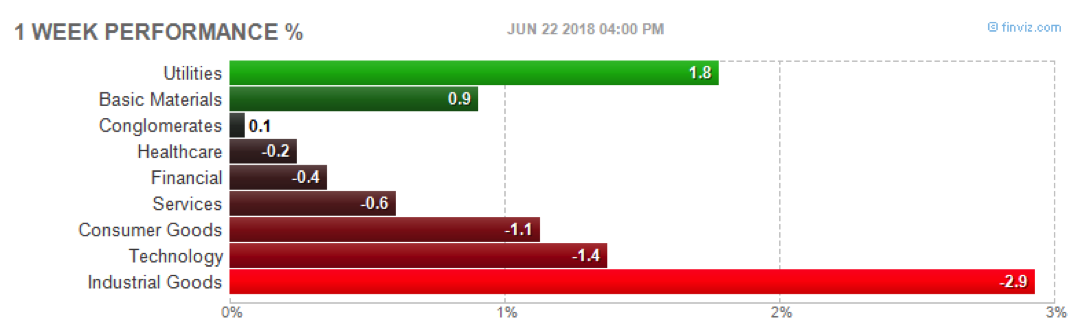
Certainly we can chalk up last week’s Utilities and Consumer Staples sector outperformances to oversold and underappreciated conditions, but this bull market hasn’t found that to be the case for the last 18 months. So if we take that notion off the table we are still left with the heightened level of concern over tariffs. Additionally, industrial goods being the biggest underperformer last week suggests that trade tariff implementation could severely hurt the sector as money rotated from that sector into utilities. It really is telling, the causation of money flows out of the likes of Boeing and Caterpillar and into the likes of Verizon and XLU.
With regards to last week’s trading activity, the coming week could make or break the market ahead of earnings. We’ve heard of no ongoing negotiations between the U.S. and allies or the U.S. and China recently. Without any beneficial news on trade this coming week, the market may begin to price in worse, not the worst but worse, case scenarios. Again, the market has been incredibly resilient to date so there is also the possibility that it does not. As such, suggesting the worst-case scenario doesn’t seem fitting, but a worse case does. The expected move in the S&P 500 for the coming week is nearly $36 after an expected move of only $31 in the previous week.
Now let’s take a look at those Q2 earnings forecasts. Our first earnings forecast comes from Thomson Reuters and is identified in the chart below.

Second quarter earnings are expected to increase 20.6% from Q2 2017. Excluding the energy sector, the earnings growth estimate declines to 17.0 percent. Sales are expected to grow 7.9% for the quarter and signaling the strength of the consumer.
In terms of estimate revisions for companies in the S&P 500, analysts have slightly increased earnings estimates in aggregate for Q2 2018 to date. On a per-share basis, estimated earnings for the second quarter have increased by 0.6% since March 31. In a typical quarter, analysts usually reduce earnings estimates.
And there you have it folks. Play it safe out there, this coming week. We’re only half way through the year and mid-term elections are still yet to come. The better you manage your portfolio today will prove incrementally beneficial over time.
**(Full version of this report was released this weekend and is available to subscribers.)


