
U.S. options skew on the S&P 500 has been rising recently, and a recent close of 136.6 is actually higher than at any point during last December’s stock meltdown. A refresher on what skew measures:
- Imagine a $100 stock that has put and call options that expire in 1 year with strike prices of $50 (for the put) and $150 (for the call).
- Even though both options are exactly $50 away from the current price and expire on the same day, they won’t trade for the same price. The call might go for $1 but the put would cost $2.
- The $50 put option is more expensive because it has value to stockholders who want to hedge an existing position. Even writing the $150 call is not as valuable if, for example, the stock goes to $20.
- The CBOE SKEW Index essentially measures the difference in S&P 500 put and call prices by looking at their implied volatilities and focusing on “tail risk” hedges such as in this example.
Here is a 1-year chart of the CBOE SKEW Index:

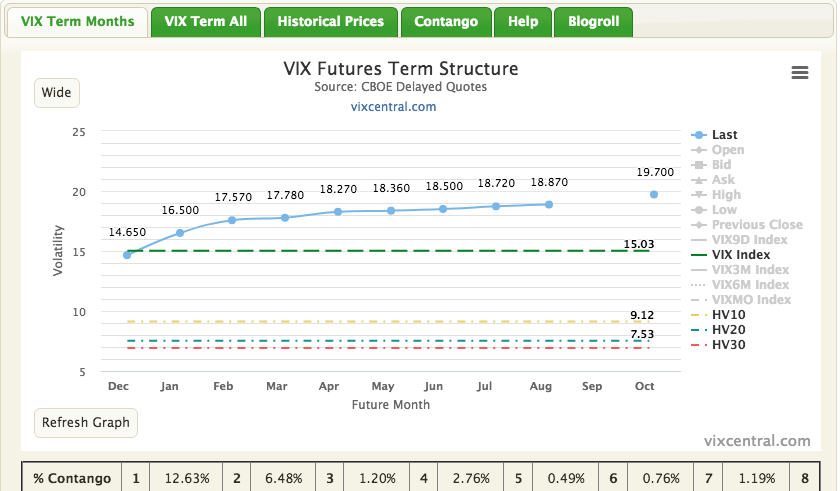
So, a high SKEW as we have now is a worrisome sign. It says traders are bidding up the price of “disaster insurance” (AKA puts) on the S&P 500 even though markets are quiet and the VIX Index at 15 is well below it’s long run average of 20.
At the same time, a historical look at the SKEW Index (1990 – present) shows a more nuanced picture:
- Yes, the current reading is high relative to historical norms. The average for the SKEW Index since 1990 is 119.5 with a standard deviation of 7.8.
That means the current 136.6 reading is solidly into 2-standard deviation territory, which starts at 135.1. - But, as the chart of 50 and 200 day rolling average SKEW shows, this measure has changed over time. There is a notable break around 2014.
From 1990 to 2013, daily SKEW averaged 117 with a standard deviation of 5.5.
Since the start of 2014, however, SKEW has averaged 129 with a standard deviation of 8.1. In other words, the entire post-2014 experience is 2 standard deviations away from the 1990 – 2013 history.
Here is the long-run rolling average SKEW chart:

The bottom line here is that while the current SKEW reading of 136.6 is unusually high across the entire dataset, it is pretty normal for the last 6 years. And let’s not forget that the S&P 500 is up 87% over that period…
As for what’s different since 2014 that might be driving SKEW structurally higher, a few observations:
- The SKEW Index was born of the 1987 stock market crash, as the CBOE discovered that this event had permanently changed options traders’ pricing of tail-risk protection. Pre-October 1987 put/call pricing was fairly even, but after Black Monday traders priced out the money puts more aggressively than calls.
During the SKEW Index’s first quarter of operation (Q1 1990) it averaged 126. - Subsequent market turmoil over the years did not see the SKEW Index reach those levels.
From 2000 – 2002, when the S&P fell by 37%, the SKEW Index averaged 114.
In the 4 months after the 9-11 attacks, it averaged 119.
Even in the depths of the Financial Crisis, SKEW only briefly reached 126 (on October 28th 2008). The average for Q4 2008 was 117, lower than the Q1 1990 average of 126 mentioned above.
Our working hypothesis is, therefore, that market crashes have a delayed effect on how options markets price tail risk. In the aftermath of 1987 – all the way into 1990 – SKEW was very high, which is why the CBOE created the index in the first place. It took a sustained bull market from 1991 all the way to 1999 to bring it down, and even the 2000 – 2002 experience did not change the appetite for tail risk insurance. The 2008 Financial Crisis did not have an immediate effect on SKEW, but starting in 2014 traders began to worry that stocks were due for a fall.
And that’s the world we’ve been living in since, one that worried about the next “Big One”. No doubt that day will come at some point – it always does. But the SKEW Index is unlikely to predict it. We’ve had a “high SKEW” regime for 6 years, and nothing horrible has happened yet.
In a recent article by Bloomberg reporter Luka Kawa, he discussed the fascinating escalation in the SKEW Index:
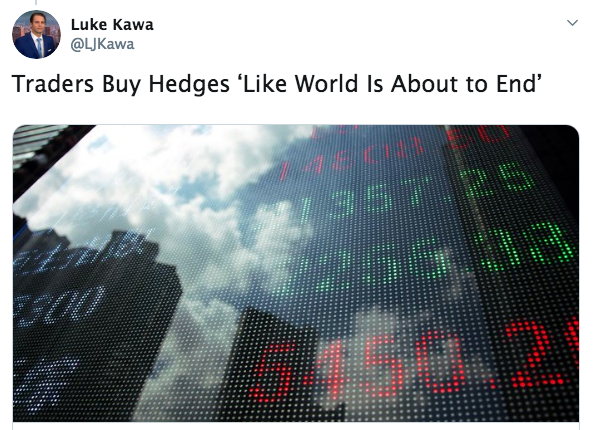
Faced with a loaded event calendar that will bring central-bank decisions, trade deadlines (Dec. 15), a U.K. election and an impeachment vote, traders are piling into protection “like the world is about to end,” said IPS Strategic Capital head trader Patrick Hennessy on Twitter.
The divergent behavior is reminiscent of trends ahead of the Brexit referendum and U.S. elections in 2016, Hennessy said, when there was a chasm between the S&P 500’s low realized volatility and high demand for puts relative to calls.
Like then, traders are now bidding up tail protection and Skew, the gap between the implied volatility of S&P 500 puts versus calls.
The jump in implied and realized correlations shows that investors are again treating this like a macro-driven market — one in which stocks will tend to move together. And with the aforementioned plethora of potential catalysts on deck, it’s little wonder.
And this hedging activity could also be the fuel for a fresh record in equities in short order. The flip side is that if this macro minefield is successfully navigated, an unwind could power risk assets ever higher.
“Downside protection in S&P is extremely rich, while upside sees little to no interest,” said Charlie McElligott, equity derivatives strategist at Nomura Securities. “The market is now once again beginning to price in ‘tail’ scenarios.”
This build-up of hedges makes sense, according to the strategist, given his assessment of relatively elevated equities positioning. But even so, this opens up the possibility that stocks can jump higher in the event of a hedge “puke,” as McElligott puts it, or on clarity that tariffs scheduled to go into effect this weekend will be delayed, with the potential for previous levies to be rolled back.


