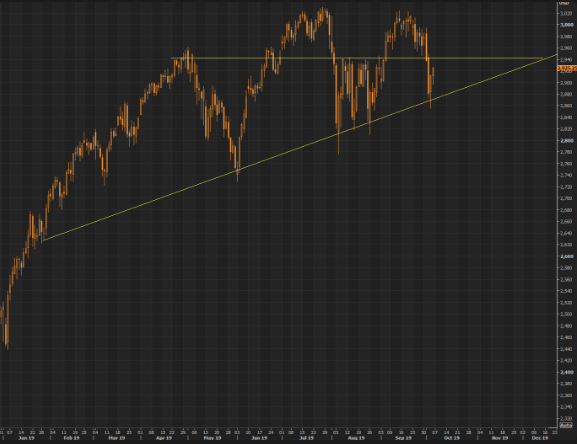
Welcome to this week’s State of the Markets. Please click the following link to review the SOTM video. In this week’s episode we discuss the craziness that comes with October markets. While the economic data is supportive of trend-growth, it has shown signs of weakening in the ISM data series. The 4th quarter has a reasonable setup for the markets which continue to top around S&P 3,000 and drop from that point and until support is tested. Our dialogue this week aims to rationalize the numerous headlines while recognizing the impact on financial markets. Please review the supporting graphics and bullet points that accompany our State of the Markets video!
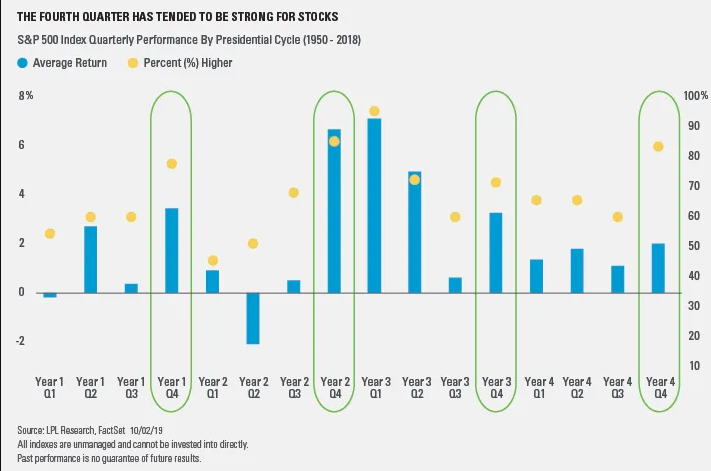
- This might be a rough start, but the fourth quarter is the most bullish quarter of the year. Since 1950*, the S&P 500 has gained 3.9% on average, and has closed higher 78.3% of the time. (LPL Financial)
- The S&P 500’s 14% drop in last year’s fourth quarter was unusual, but it could point to a better end to 2019. Since WWII, the fourth quarter has been down two years in a row only twice — once during the financial crisis, and once during massively high inflation in the late 1970s.
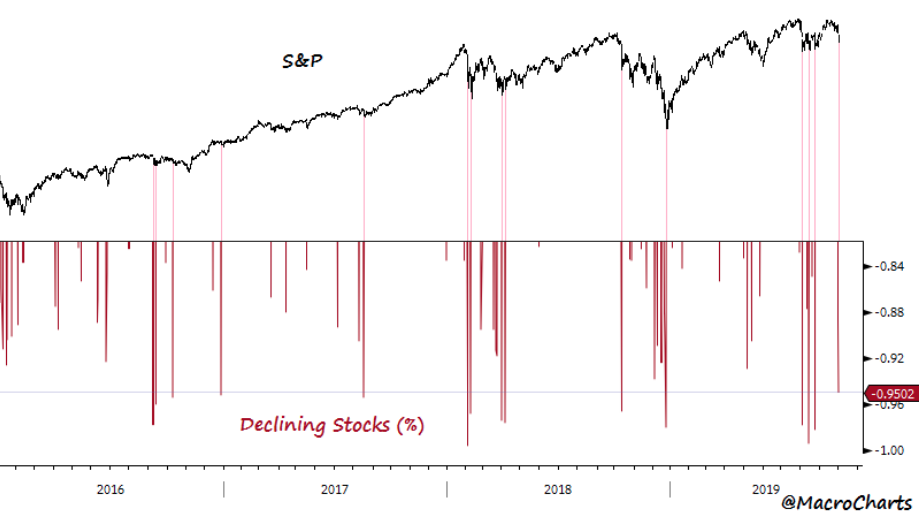
- 95% of S&P Stocks fell on Wednesday. Extreme negative Breadth rarely marks THE final low, but is often seen *near* Major bottoms. Look for *extreme* two-way volatility including vicious 1-2 day spike rallies as the market tests this new range or forms a base.
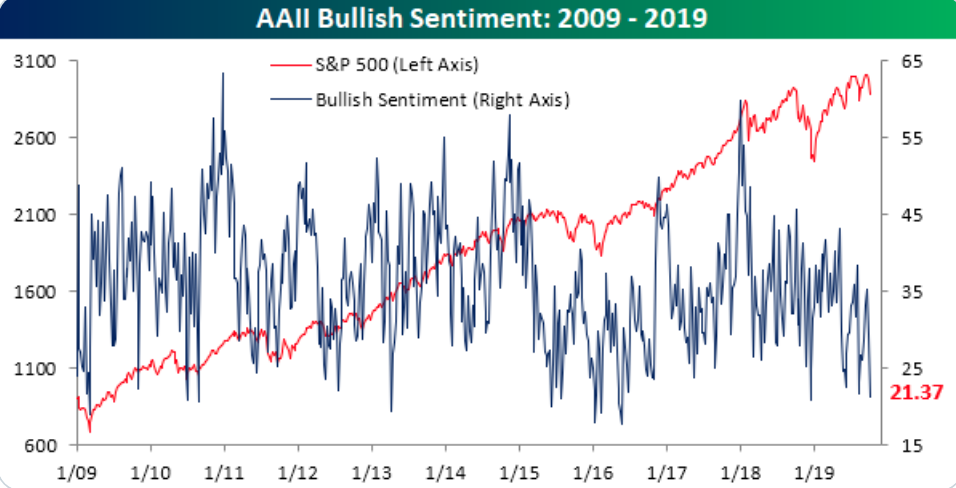
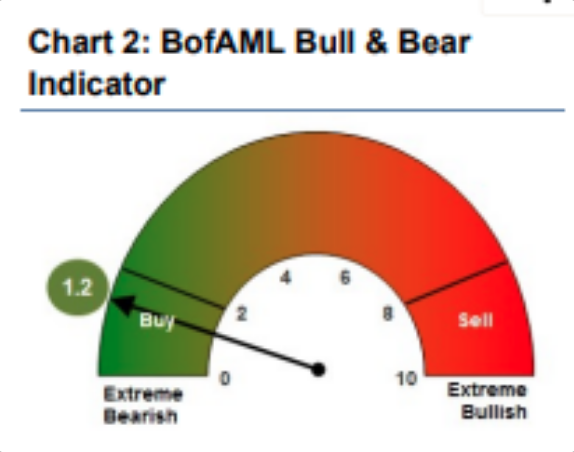
- There’s only been one week in the last three years where bullish sentiment was as low as it is now.
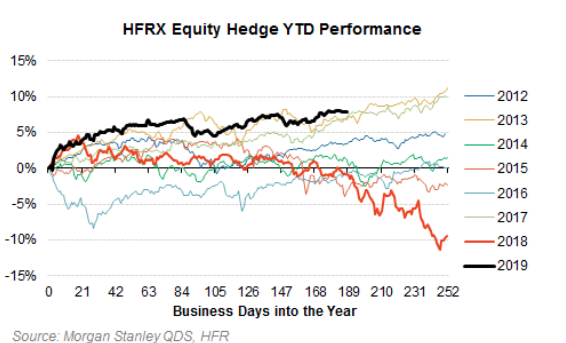
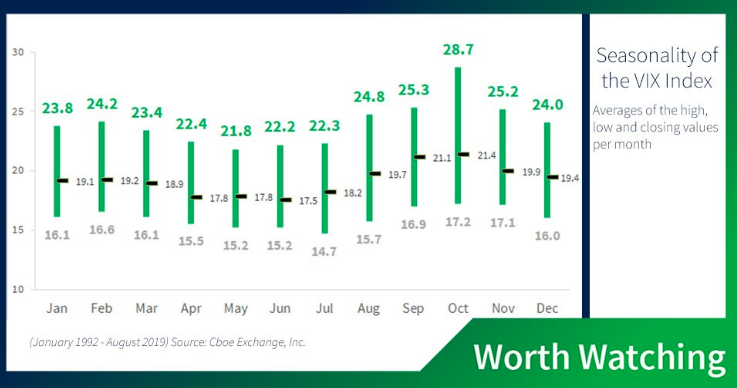
- Historically, October has had the highest average highs, lows and closing values for the VIX Index since 1992. What will the upcoming month bring?
- Bullish sentiment, expectations that stock prices will rise over the next six months, plunged 8.0 percentage points to 21.4%. Optimism was last lower on December 12, 2018 (20.9%). Bullish sentiment is below its historical average of 38.0% for the 32nd time this year and the 20th time in 21 weeks.
- Neutral sentiment, expectations that stock prices will stay essentially unchanged over the next six months, rose 1.8 percentage points to 39.2%. Neutral sentiment was last at this level on May 22, 2019. This was the fifth consecutive weekly increase. The rise keeps neutral sentiment above its historical average of 31.5% for the 19th time in 20 weeks.
- The U.S. housing market continues to expand. New home sales (signed contracts) and building permits are both running at cycle highs. Both are leading indicators of activity.
- Consumers look pretty good. Solid household balance sheets. Real income growth (strong wage growth and low inflation). Low rates are boosting refinancing applications. Decent consumption growth looks like the base case for the next couple of quarters.
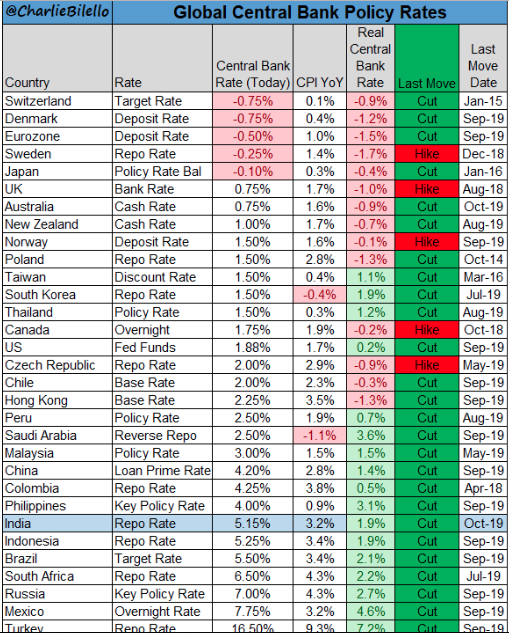
- The Fed is getting some help. Global central banks have been easing. By our count, we’ve seen about 30% of central banks globally have eased over the last month. Money growth in Europe has ticked up. Interesting. Things aren’t great in the economy. Hard to say they are collapsing either.

- In the past 8 years, in September, the ADP report averaged being above the BLS report by 55,125. If the average keeps up, there will be about 85,000 private sector jobs created. The consensus is for 140,000 jobs created.
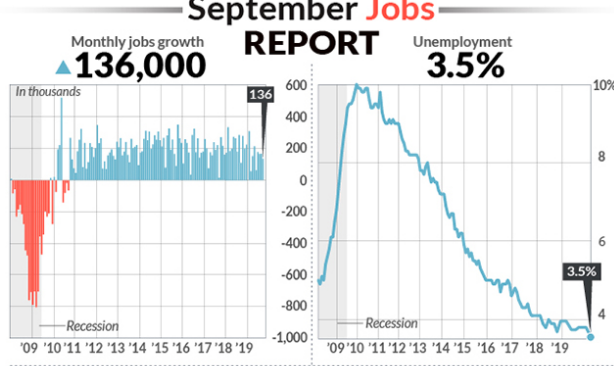
- Non-farm payroll average: * Q1: 174k * Q2: 152k * Q3: 157k * Year-to-date: 161k * 2018: 233k
- Probability for a 25 bps rate cut rose from 40% to above 90% after ISM data was released this week. Probability has fallen since NFP data released on Friday.

- LEUTHOLD GROUP: “.. although the #ISM has now been below 50 for the last two months, cyclical stocks are still acting more like the recent weakness in economic reports is probably just another ‘slowdown’ rather than implying that a recession seems imminent.”
- GOLDMAN on this week’s ISM’s: “Taken together, we lowered our September nonfarm payrolls forecast by 15k to +150k. We also lowered our Q3 GDP tracking estimate by one tenth to +1.9%”
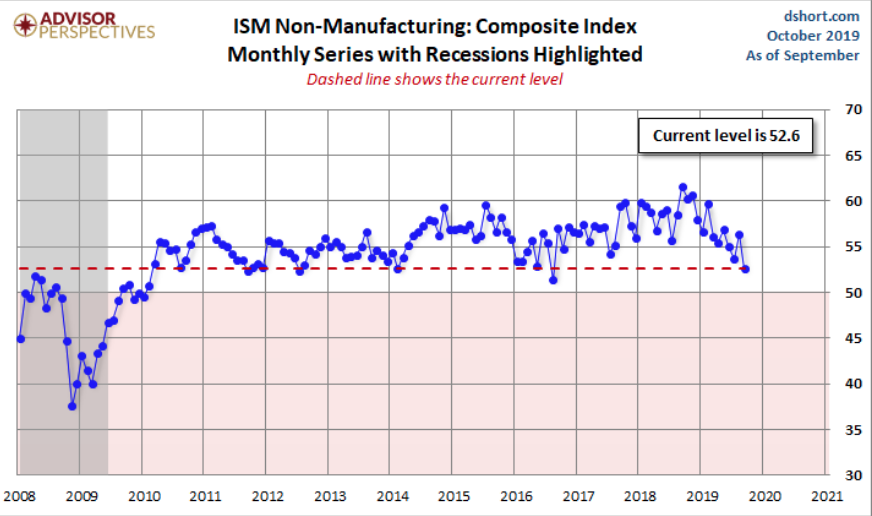
- The Institute for Supply Management’s said its non-manufacturing index fell to 52.6% last month from 56.4% in August
- The employment gauge dropped to a five-year low of 50.4% — barely above the cutoff point that separates net hiring from net layoffs.
- Altogether, 13 of the 17 industries tracked by ISM said their businesses were expanding. Just 3 of the 18 manufacturing industries in the firms’s survey indicated business was still expanding.
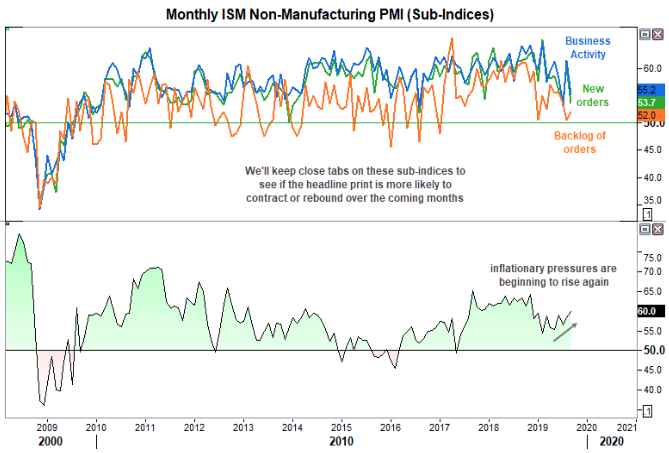
- It’s not all bad. And, unlike the manufacturing sector, there are some good numbers within the sub sectors.
- Prices are their highest in 10 months at 60 (inflationary)
- Only imports declined, and new orders and business production remain expansive.
- Backlog of orders sits just above its 1-year average at 54.
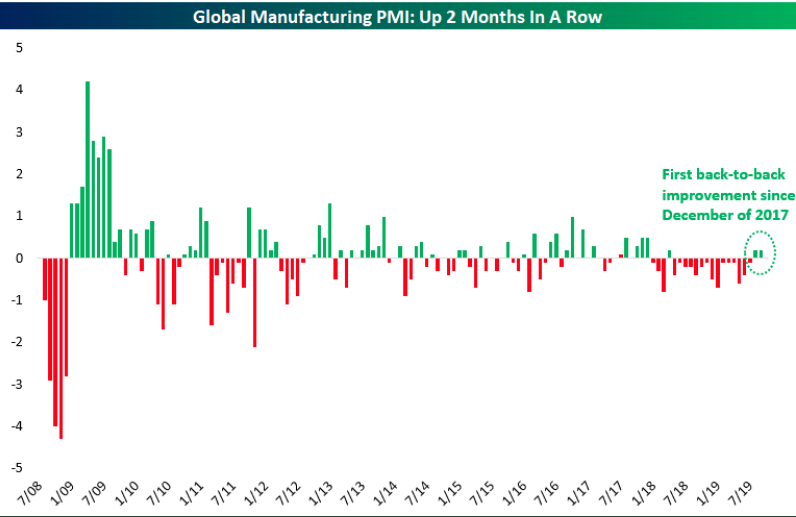
- ISM Manufacturing has been front and center all week, but Markit’s Global Manufacturing PMI has now posted back-to-back MoM gains following a 15-month streak of declines.
- The Markit PMI actually has about twice the sample size as the ISM PMI. The ISM report has a small sample size which means you shouldn’t change your macro view based on one reading. It was probably too optimistic in 2018 and now it’s more pessimistic than the Markit report and the average of the regional Fed readings.
- The ISM reading is an average of its 5 components which are new orders, production, deliveries, inventories, and employment. Markit gives a higher weighting to production and new orders and a smaller weight to inventories and deliveries. Since the ISM inventories index fell 3 points to 46.9, it definitely played a role in its relative weakness.
- The Markit PMI was worse than the ISM PMI earlier in the year. The latest readings are a role reversal. As much has been made about the ISM report, it’s important not to overreact. We knew there was a manufacturing slowdown before this report came out. This PMI was simply below expectations. It could be because the PMI is slightly too negative just like it was too positive in 2018. If it was slightly higher, the trend wouldn’t change. However, stocks wouldn’t have fallen if it was a couple points higher. The weakness in the PMIs highlight the importance of the trade negotiations with China next week.
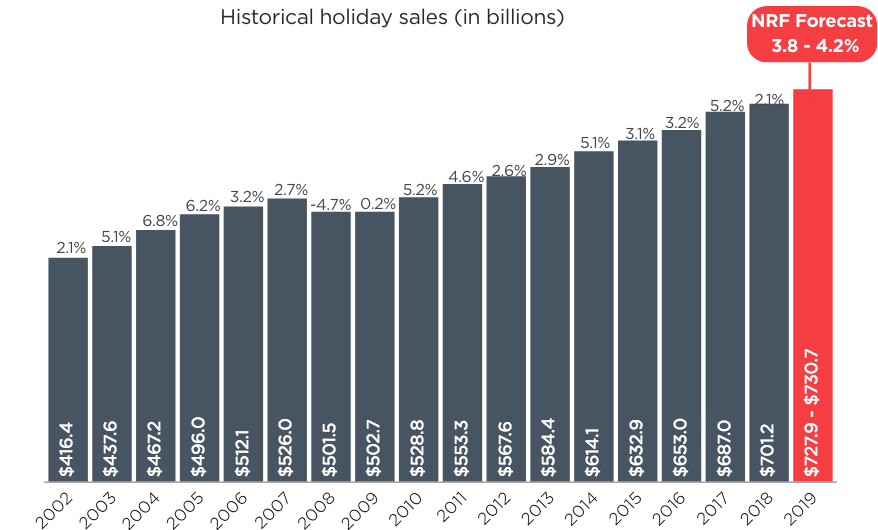
- The National Retail Federation today said it expects holiday retail sales during November and December to increase between 3.8 percent and 4.2 percent over 2018 to a total of between $727.9 billion and $730.7 billion. The numbers, which exclude automobile dealers, gasoline stations and restaurants, compare with an average holiday sales increase of 3.7 percent over the previous five years.
- NRF expects online and other non-store sales, which are included in the total, to increase between 11 percent and 14 percent to between $162.6 billion and $166.9 billion, up from $146.5 billion last year.
- Holiday sales during 2018 totaled $701.2 billion, an unusually small increase of 2.1 percent over the year before amid a government shutdown, stock market volatility, tariffs and other issues.
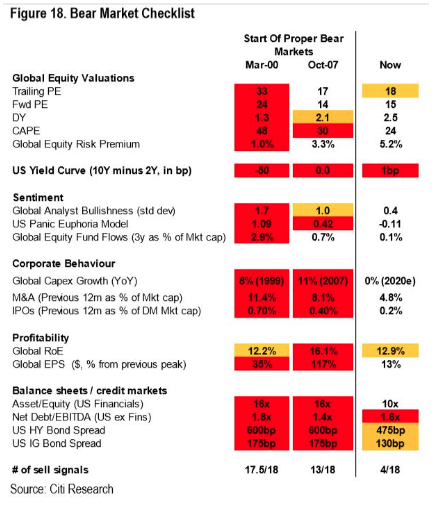
- Citi Research: only 4 of 18 factors in their “Bear Market Checklist” are flashing red. Robert Buckland (Citi’s strategist):
- “It is too early to call the end of this 10 year global bull market… Our market targets suggest that US equities will continue to lead the way.
- FUNDSTRAT: “ISM bottom likely in. .. While equities sold off sharply, .. the bond market had seen this for the past 1.5 years. Bottom line: We still see a 2H rally. Equity markets are understandably glum. But the bond market has suggested the worst may be behind us.”
Richard Clarida, Vice Chairman of the Federal Reserve
- Says economy is in good shape
- economic growth is solid
- Consumer is in a good place
- Focus of the fed is to keep US econbomy in good place
- Fed is not a pre-set course
- Fed will act as appropriate
- The probability of a recession is not high if the Federal Reserve can set the right interest-rate policy, Fed Vice Chairman Richard Clarida said Thursday.
- The risk of a recession remains low “with appropriate monetary policy,” Clarida said during a question-and-answer session sponsored by the Wall Street Journal
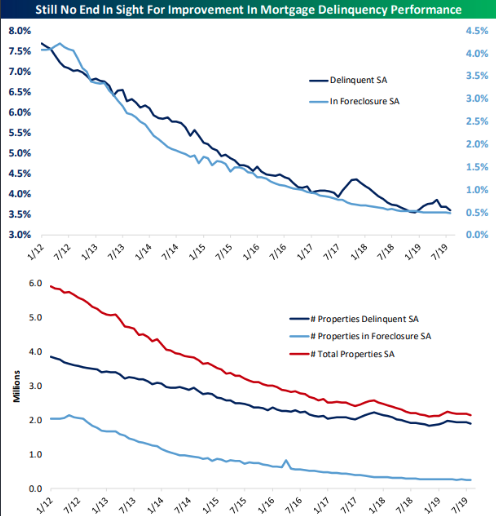
- Delinquency and foreclosure rates have both continued to fall.
- Goldman’s’ “current activity indicator” shows US economic growth of 1.3% for September, BUT .. .. if you took only SURVEY data, it would show 0.4%. If you took only hard data? 2.5% “That’s an unusually large gap,” says chief economist Jan Hatzius.