Please click our link to the latest Finom Group YouTube video and subscribe to our channel for future video updates!
“There are decades where nothing happens; and there are weeks where decades happen.” – Vladimir Ilyich Lenin
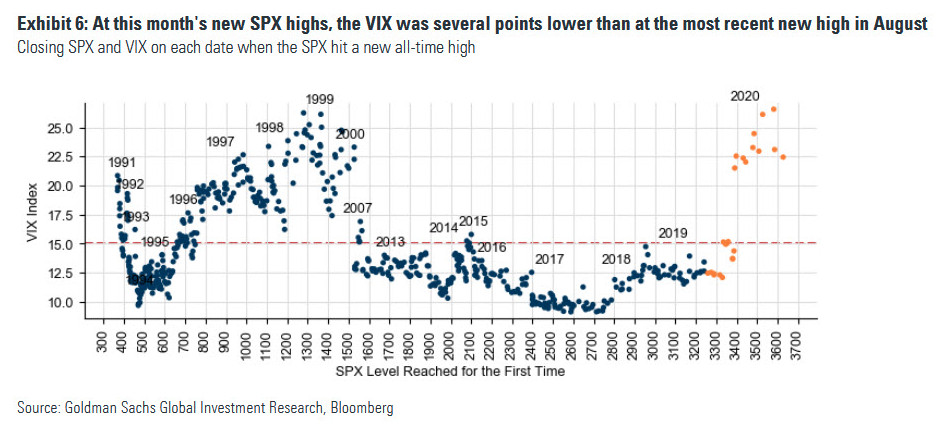
- SPX has made 584 new all-time highs since 1990
- SPX has made 24 new highs in 2020 alone
- The VIX average on days where SPX makes new highs is 14.64
- 75 times the VIX closed over 20 on days where SPX made a new high
- Highest VIX close on a record SPX day was 26.25 in January 1999
- VIX shouldn’t be compared across time frames for signals
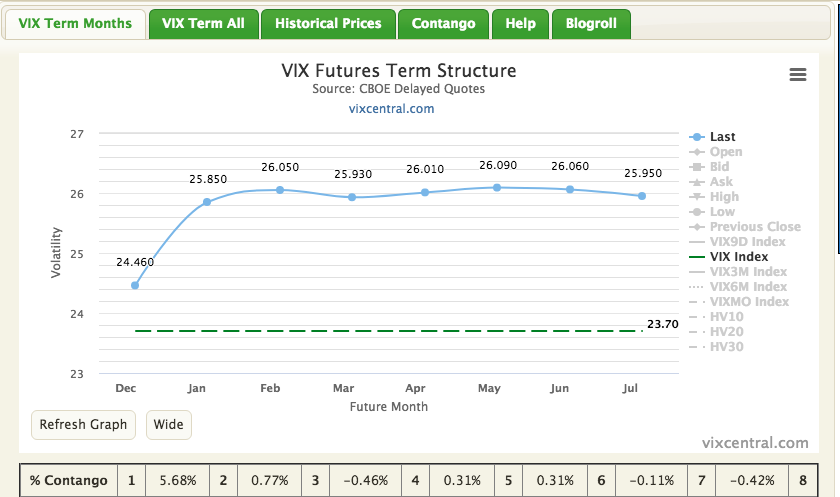
- Following Election 2020, volatility markets have reverted to their more typical contango structure versus the former backwardated, but the entire VIX curve remains elevated.
- The rate of change in 2020 has been abnormal to put it mildly and as we look at history.
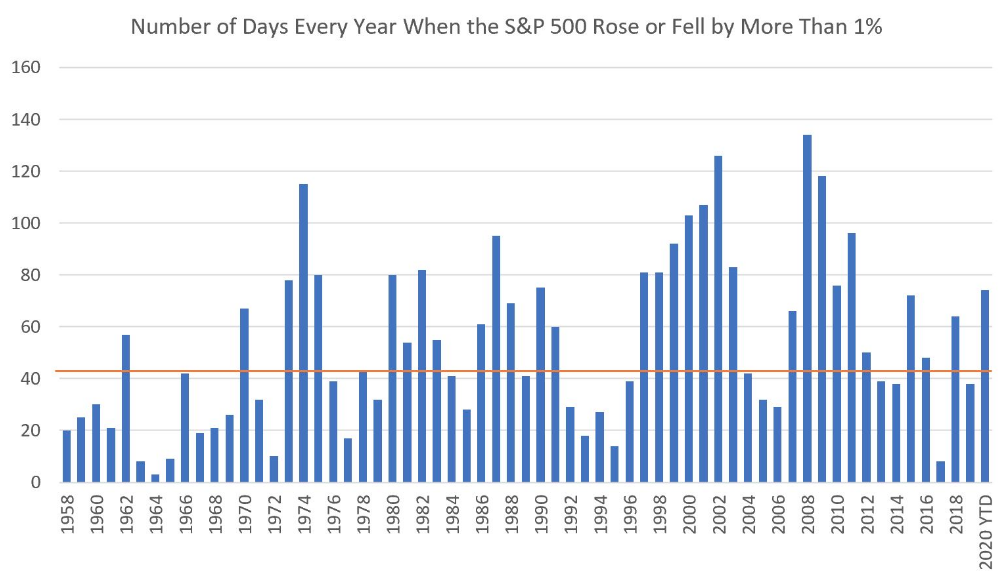
- On average (35-year history) the S&P 500 has 65 days (annually) where the close over close move is +/-1%. Thus far in 2020 there have been 103 daily moves of more than 1%.
- On 42 of those days, the broad market moved higher or lower by at least 2%.
- It’s no wonder the average VIX Index closing level YTD is still in the 30s at 30.30.
- The record for S&P 500 1% daily moves in a year came in 2008 at 135. (chart below from July 2020)
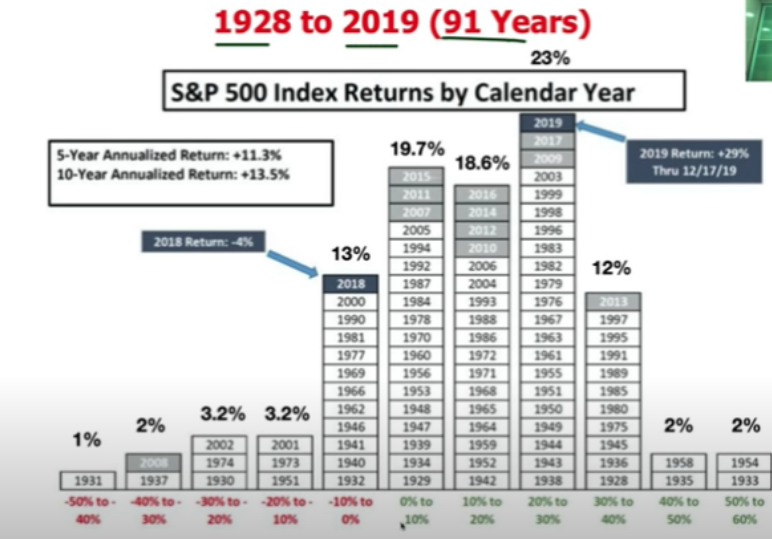
- 77% of the time SPX is up on the year.
- 23% of the time the market is up 20-30% on the year.
- Market is down 22% of all years. I’m bullish & statistically I’m right to be so. Market history is not hidden and represents tight correlation to human behavior (Adam Khoo)
- “Most people will do more selling than buying over the course of their investing experience, yet the discipline of doing this “well” is woefully under-addressed by the industry.”
- This doesn’t make a lot of sense given that there are fewer and fewer shares to own with each passing year.
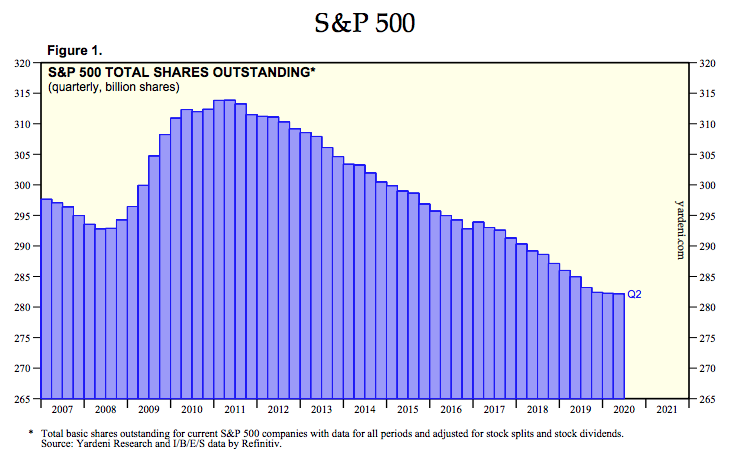
- We are likely to see shares available for SPX fall again in Q3 2020
- If we consider the post-pandemic, 2021 period, I would be of the opinion there is a bullish backdrop that will further curtail shares available going forward
Many investors avoid technical analysis; they think it is a difficult discipline. In reality, it’s not terribly difficult and becomes easier with time, just like anything else. Having said that, here is a very, very simple and true recognition of ALL THE TECHNICAL ANALYSIS YOU’LL EVER NEED TO KNOW AND LIKELY USE!***
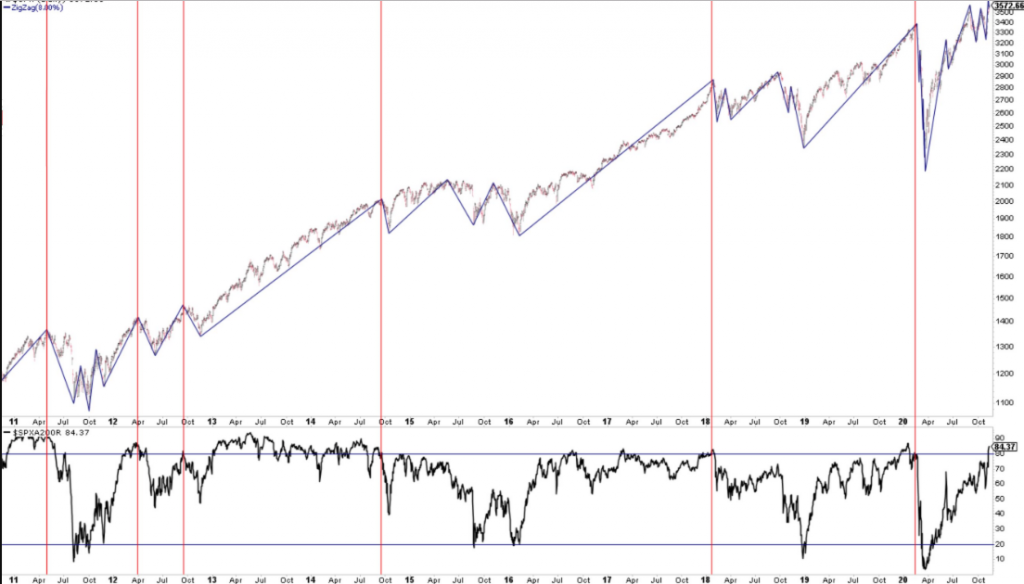
Uptrend = higher highs, higher lows above rising moving averages. Downtrend = Lower highs, lower lows, below declining moving averages. Determine your time frame & identify the trend.
- With market breadth as firm as it has been in recent weeks, investors should keep in mind that these are usually the type of breadth readings that produce drawdowns.
- The chart below indicates the percentage of stocks trading above the 200-DMA gets to greater than 80% (bottom panel), as it is today. (Top panel SPX)
- While strong breadth readings are a good long-term bullish signal they are often where a goodly amount of investors lock-in profits as well, resulting in near-term drawdowns
- As many 8%+ drops (equal to that in October) take place under the current strong breadth conditions as when breadth is weak. How steep of a drawdown will be produced is always a guessing game and not worth considering given the macro-market outlook for 2021
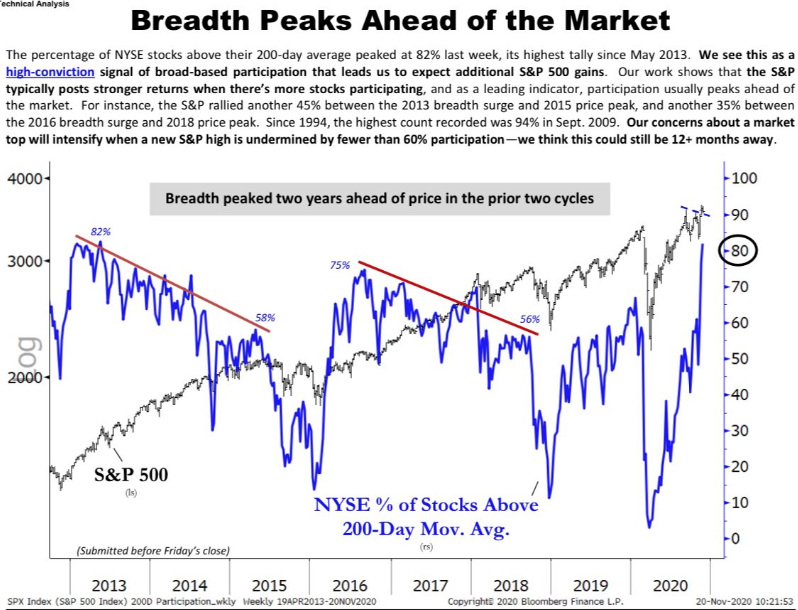
- Breadth leads price!
- What is more important is maintaining appropriate market expectations and having a designated game plan for when markets consolidate, as we saw in September and periodically in October.
- Technical commentary and chart above from Ari Wald of Oppenheimer.***

- Overall, Thanksgiving week has tended to be bullish. In the past 50 years, the S&P 500 Index has gained, on average, 0.59% during the week, with 70% of the returns positive.
- Other weeks average a gain of 0.16%, positive 56% of the time.

- The tables above break down Thanksgiving week by day. Historically, the first couple days of the week have seen their struggles. Monday of Thanksgiving week has averaged a small gain, albeit which is better than other Mondays that have averaged a loss, but over half the Thanksgiving week Mondays have been negative.
- Tuesday of next week has averaged a small loss, despite a higher percentage of the returns being positive.
- The weekly outperformance has come from the day before Thanksgiving and the day after. The Wednesday before Thanksgiving has been positive 78% of the time, averaging a gain of 0.3%.
- The day after Thanksgiving has averaged a 0.2% return over the past 50 years and has been positive 66% of the time. (Schaeffer Analytics).
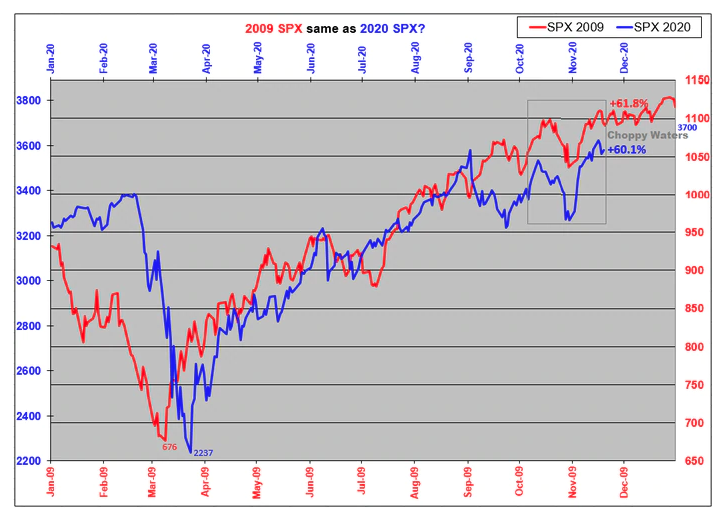
- 2009 analogue suggests choppy price action until the final trading week of the year.
- 2020 is trailing 2009 by only 1.8% to-date.


- Investors just can’t seem to make up their minds at this point between placing more emphasis on the shorter-term concerns on the impact of rising case counts or the positive long-term impacts of viable vaccines.
- One thing we are sure of is that there’s nothing wrong with some healthy consolidation to digest the big gains from earlier in the month and work off overbought conditions in the process.
- With markets at new highs, knee-jerk reactions will be more commonplace. These cooling-off periods are a welcome pause that helps to eliminate excess.
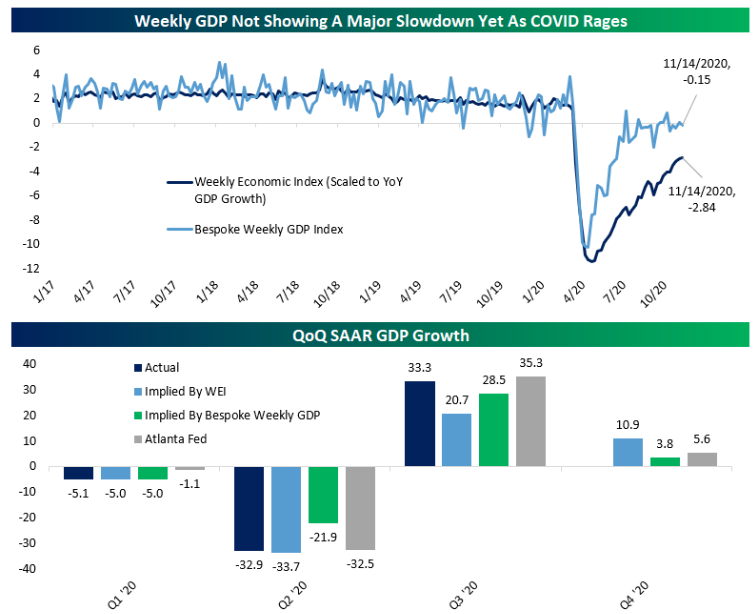
- Above is the Bespoke Investment Group (BIG) update of weekly economic growth trackers that they produce internally as well as the New York Fed’s Weekly Economic Index which is updated on a regular basis. Over the last 5 weeks, the BIG index has reported negative YoY growth in output in 4 weeks, including a modest drop for the most recent week of data.
- For its part, the NY Weekly Economic Index has continued to rebound from the April lows and is at its highest levels since the March economic data collapse. That index still shows output down almost 3% YoY, but its ongoing rebound is suggesting a much stronger Q4 than what our index is tracking. BIG data suggests output will be up a modest 3.8% QoQ SAAR in Q4, versus more than 10% QoQ SAAR forecasted by the WEI data.
- For context, Atlanta Fed GDPNow data suggests something more in-between, with their data tracking 5.6% QoQ SAAR.
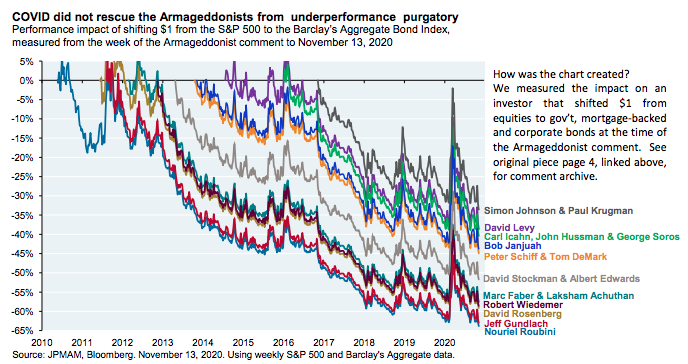
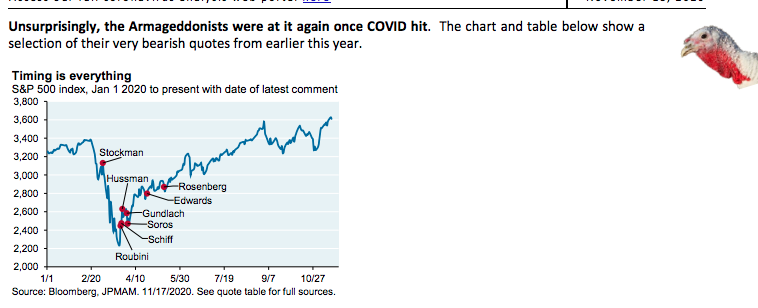
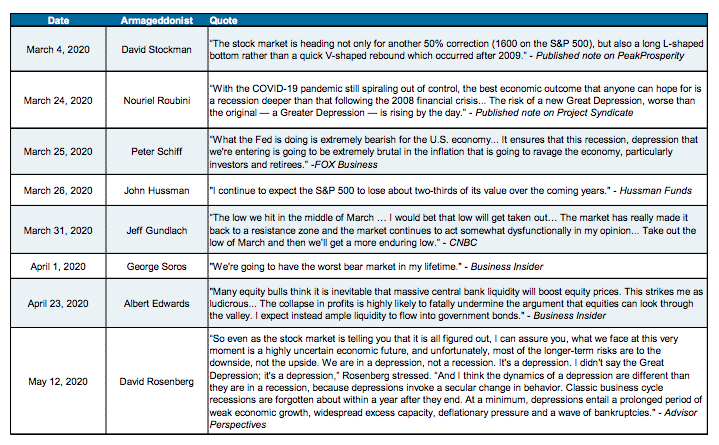
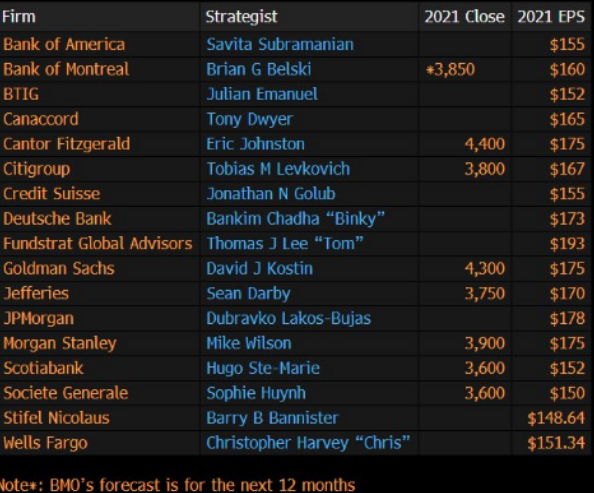
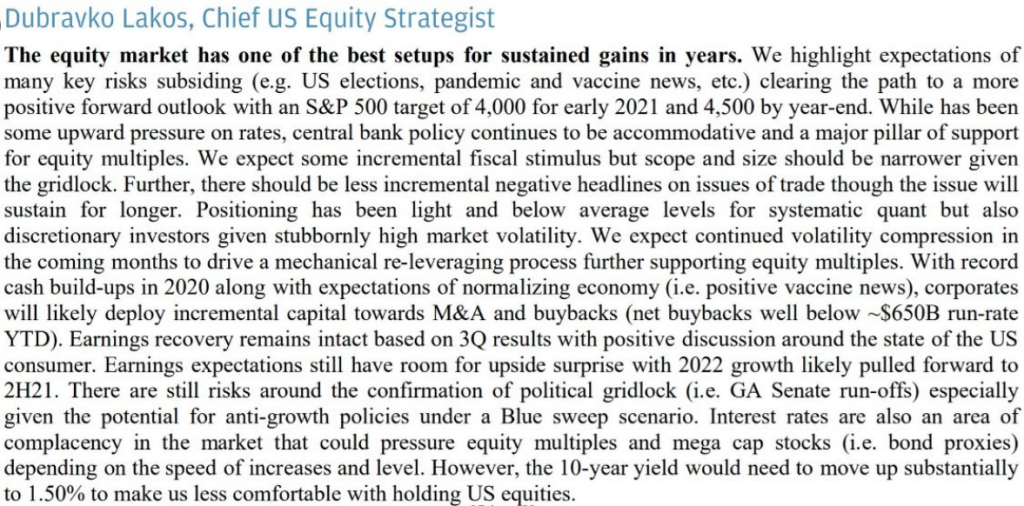
J.P. Morgan 2021 Outlook
J.P. Morgan’s Michael Cembalest has been tracking calls since 2009