

Research Report Excerpt #1
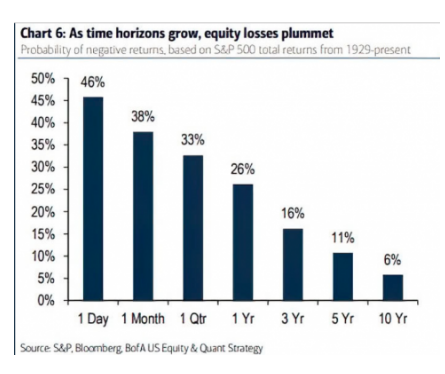
In order for drawdowns to not become realized losses, sometimes we also have to elongate our time frame. You’ll find that to be the case when markets come under pressure, as they have in 2022. This is obviously not a new concept, but a concept that many traders and investors haven’t had to accept and put into practice since the market bottom in March 2020. As the chart identifies, the longer our time frame, the more likely we enable realized profits and simultaneously lessen the probability of taking a loss. Don’t get me wrong, sometimes it is healthy to take small losses and raise some cash. Every trader and investor is different and holding different time horizons and risk tolerance. No trader or investor, however, will find it beneficial to limit their time frames.
Research Report Excerpt #2
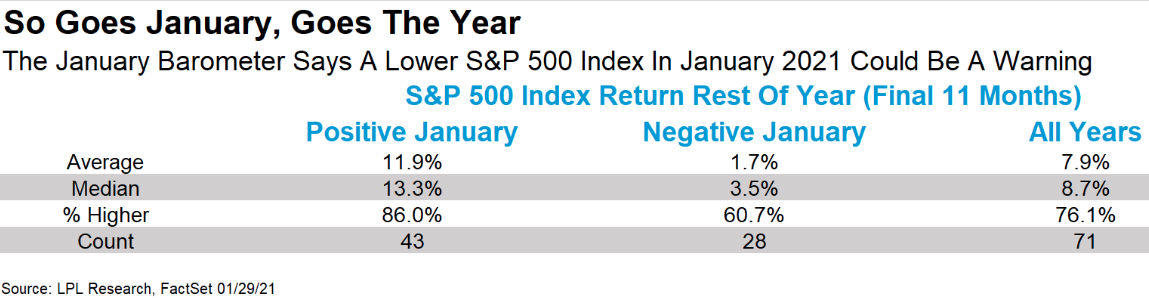
When the S&P 500 breaks the December low in Q1 as it has this year, returns the rest of the year can be subpar. Since 1950, the average S&P 500 return is just 1.7% and the positivity rate is 60.7 percent. While the S&P 500 delivers a muted, positive return more often than not, having this information handy helps to level-set investor/trader expectations for the remainder of the year. The pessimist sees a below average annualized return. The optimist sees the S&P 500 down ~8% from its all-time high with the probability of rallying some 10% to achieve the historic average return over the next 11 months. The realist may see it yet another way, which will be discussed using our next historical study of consequence.
Research Report Excerpt #3
The S&P 500 produced a negative return from November 19, 2021 through January 19, 2022. Previous Bearish TOY signals are noted in the table above.
The table below identifies (red row) the average S&P 500 returns when a Bearish TOY signal fires. When a bullish signal is in play, odds heavily favor solid gains over the following 12 months, but when there’s a bearish signal, odds favor a down year with a relatively big loss.
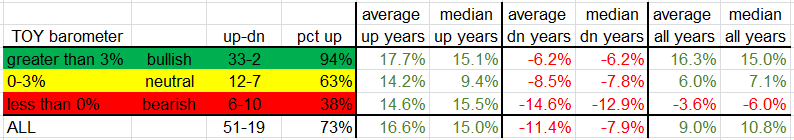
The pessimist sees the potential for more losses ahead in 2022, and we shouldn’t deny this signal’s historic value. Having said that, the optimist sees that almost 40% of the time a Bearish Toy signal fires, the market has delivered a positive result. The realist cuts things down the middle and sees the downside as being rather limited, given the year-to-date losses already, and elongates his time horizons. Whichsoever camp you fall into know this; there is opportunity for bulls and bears alike, but the greater discipline suggests deeper value is the friend of the long-term bull and savvy investor.
Research Report Excerpt #4
At the end of the day this past Friday, the Options Total Put/Call Ratio soared to the highest level since the Pandemic crash of 2020 (1.26). This may prove peak fear for the time being, as we have also witnessed the VIX spike up to 29.50+ on Friday. There’s a common saying that the bottom of a severe correction isn’t satisfied until the VIX hits 30. This doesn’t tend to be true, especially during a regime where the VIX has yet to drop back down to its mode of ~13.
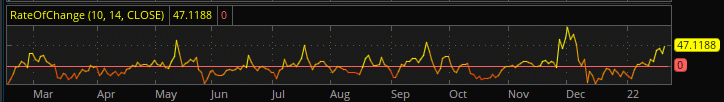
The other VIX or fear-factor I’m watching for so far as sentiment and interim bottoms are concerned is the VIX 10-day ROC (Rate of Change). Historically, this is an extremely reliable interim bottom indicator. As noted above, 30 and above is often a peak fear and S&P 500 bottoming indicator. When the VIX’s 10-day ROC achieves 50 or better, it is also a signal of peak fear or an interim bottom for the S&P 500.
Research Report Excerpt #5
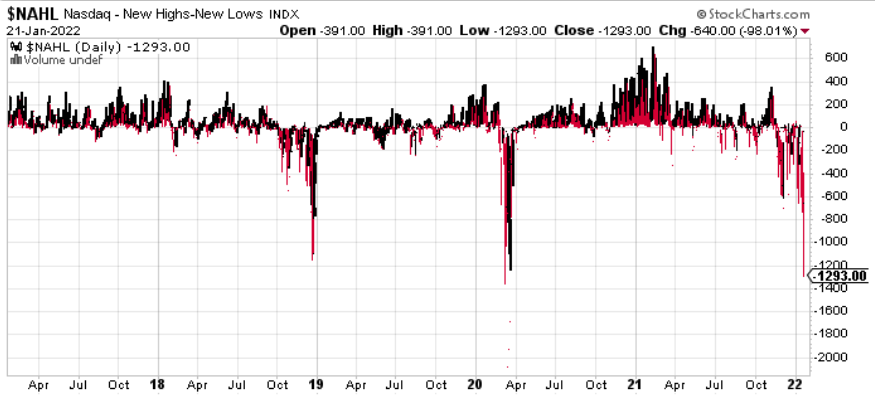
With the Nasdaq down 14.5% from its highs and 12% year-to-date, we have not seen this breadth indicator this low since the pandemic; before that the technical bear market of Q4 2018, which proved a tremendous buying opportunity. Indeed, 2018 was a Fed tightening regime and it also found such corrective price action after a nearly 3-year, 43% Nasdaq bull market. Just saying, sometimes price and sentiment find a way of resetting around Fed rate-hike regimes. Nonetheless, this is a deeply oversold breadth indicator presently. Yes, it has the potential to become more oversold, but the Nasdaq moves very rapidly and doesn’t offer much time for game planning.
Research Report Excerpt #6
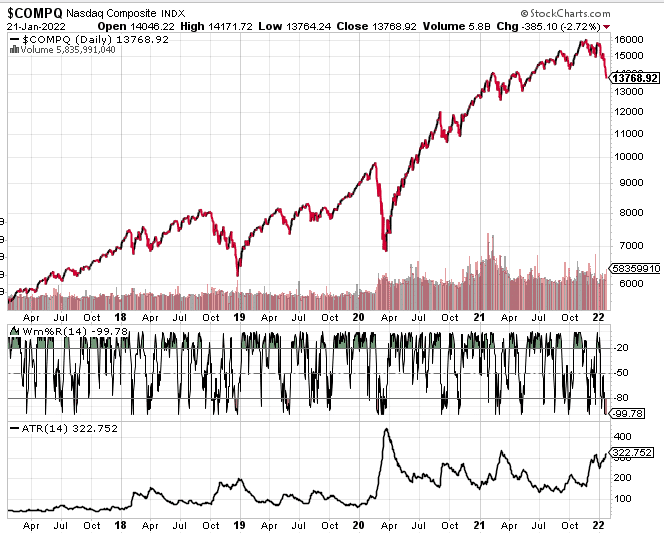
Williams %R, also known as the Williams Percent Range, is a type of momentum indicator that moves between 0 and -100 and measures overbought and oversold levels. How do we use the ATR and Williams %R in conjunction to deliver some kind of signal in a downtrend? Typically, when both indicators/metrics are hitting their extreme levels (ATR to the upside and Williams %R to the downside), a near-term bottom is afoot.
Research Report Excerpt #7
The Conference Board Leading Economic Index for theU.S. increased by 0.8% in December to 120.8 (2016 = 100), following a 0.7% increase in November and a 0.7% increase in October. That’s right the LEI accelerated in December folks!
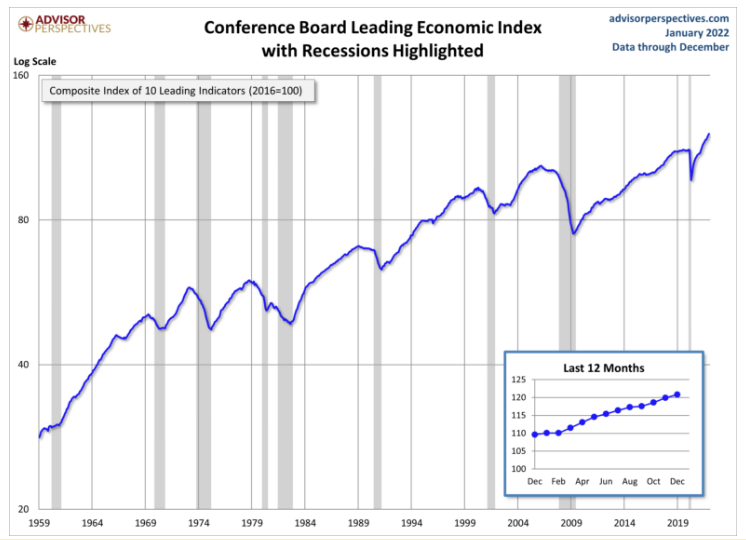
“The U.S. LEI ended 2021 on a rising trajectory, suggesting the economy will continue to expand well into the spring,”said Ataman Ozyildirim, Senior Director of Economic Research at The Conference Board. “For the first quarter, headwinds from the Omicron variant, labor shortages, and inflationary pressures—as well as the Federal Reserve’s expected interest rate hikes—may moderate economic growth. The Conference Board forecasts GDP growth for Q1 2022 to slow to a relatively healthy 2.2% (annualized). Still, for all of 2022, we forecast the US economy will expand by a robust 3.5%—well above the pre-pandemic trend growth.”
Research Report Excerpt #8

For those of you who may be thinking the situation between Russia and the Ukraine could further create market volatility and downside, please take a gander at the table above. It remedies this concern. Both the U.S. and NATO have communicated that they are not considering the deployment of their forces to Ukraine to repel a Russian invasion. Sanctions are the likely response. Russia has taken pains in recent years to minimize any impact from financial and trade sanctions. Yes indeed, we have a lot to consider this early in the year, and that is why the data comes handy. Facts prove to offset worries. We can’t do anything about Russia/Ukraine, what we can do is study, seek out the data to eliminate some unwarranted worry.
Research Report Excerpt #9
Around 50% of S&P 500 stocks are now trading at their 20-day lows (roughly 1-trading month). Each time this happened over the past 5 years, the index was higher within 20 days. (n = 16)
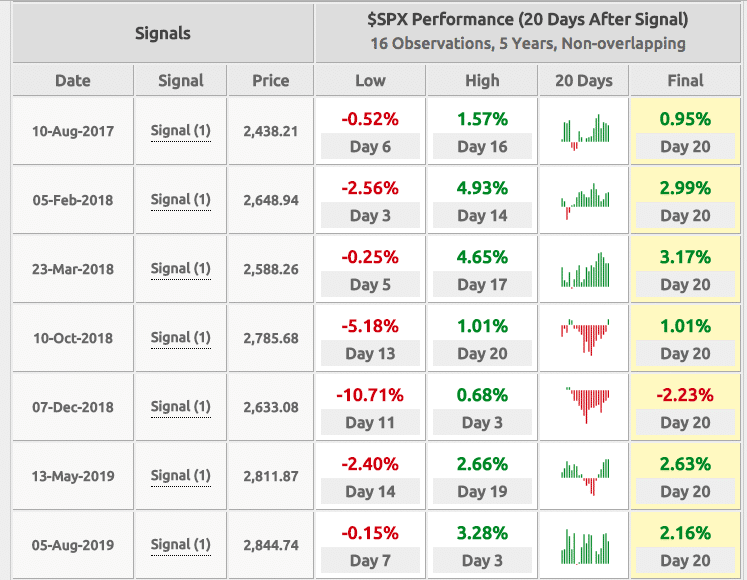

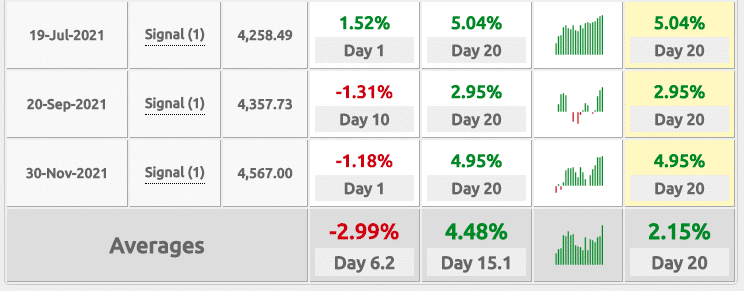
As shown in the study above, some of the lows didn’t actually materialize for another 2 trading weeks or so. Nonetheless, at the end of the 20-day period, the average final return was 2.15% and the positivity rate was 88 percent. While this study offers some positives going out roughly 1 month for the S&P 500…


