
Defining What We Mean By Liquidity
“Liquidity” is a word that is used to mean different things in different contexts. There is accounting liquidity, and market liquidity, and systemic macro liquidity. But they have one thing in common: cash is king.
Take a simple example. You want to buy a new car that costs $30k. If you have $30k cash in your house, you can walk down to the dealer and make a deal right there. If that $30k is in a checking or savings account, you may have to get a bank check before you get your car. If that $30k is in stocks, you will have to sell them first, and you don’t get to choose your price, so you may have to wait, or take less than $30k. Each of these things is progressively more illiquid, because they take longer to turn into cash and subsequently a new car.
But what if your money is tied up in your one-of-a-kind collection of potato chips shaped like famous people’s heads, which you value at $30k? Needless to say, the barter possibilities with the auto dealer are doubtful.
So you have to hop on eBay (NASDAQ:EBAY) and auction them off, which will take time, and the market for novelty potato chips may not be as, um, liquid, as you thought it was, so you may have to wait a long time, or take less than $30k.
The point here is that cash is king and assets can be converted to cash easily at acceptable prices when there is a lot of systemic liquidity – cash in readily available places. The potato chip example is what happens when market liquidity dries up, like it did in 2007-8. The mortgage-backed assets that everyone thought were worth something turned out about as valuable as those potato chips, and no one wanted to exchange cash for them.
This brings us to…
Systemic Liquidity Risk: These Potato Chips Are Worthless!
Suppose you really want that new car, but also don’t want to sell those potato chips, which you believe will only increase in value with time. So you take out a loan to finance the car, thinking if something goes wrong, you can always sell the chips.
This is called the wealth effect. You look at what you think the value of your potato chips is, and think you have $30k to consume, when in actuality, you just have some potato chips. So now you are in debt to a bank, and making monthly payments.
But then the economy sours, and you are no longer able to make those monthly payments. When you go to sell the chips, you find that people have begun to prefer cash and cash-equivalent government bills to riskier assets and aren’t willing to part with it. The auction goes poorly, and you are forced to default on the loan, losing the car and declaring bankruptcy.
The bank gets the car, but its value doesn’t nearly cover the outstanding loan amount. Also, it turns out that there were quite a few people besides you who were goaded into new purchases by the wealth effect, who also just defaulted on their car loans. The bank, which valued these loans as pretty good risks, then packaged them and sold them to buyers, just blew a huge hole in its balance sheet.
But it’s not just the bank. All those buyers, many of whom are other banks chasing yield, also had to reprice those assets, and now they have a huge hole in their balance sheets. Credit freezes up – even though there’s plenty of cash in the system – because of some improperly valued potato chips. This is the unusual situation where systemic liquidity does not translate into market liquidity.
So having enough liquidity is important for price stability and it keeps credit flowing during normal times. But when everything is headed downhill, the central bank has to step in and use its full suite of tools to restore order. Most notably, this is the Fed Funds rate and federal debt purchased by the Fed, i.e., quantitative easing. In 2009, they also bought a lot of worthless potato chips at inflated prices.
But the trend over the last 20 years, pretty much everywhere, is that even when restoring order, the increased liquidity in the system is not going to investment that improves GDP growth, but into asset-price inflation, while goods and services price inflation remains muted. The old economic “truism” that Savings = Investment no longer holds, unless you count $1.25 trillion in new federal debt in 2018 as an “investment.”
Fifty years of supply-side thinking have made everyone forget that demand exists. Without demand, the beneficiaries of increased systemic liquidity have no reason to invest in new capacity, and all of a sudden a 5-year Treasury bond 14 bps below Fed Funds sounds pretty good.
Liquidity: You’re Soaking In It
The thing that I underestimated coming into 2019 is how much the sea of liquidity we have been soaking in over the past decade has affected sentiment. The only news that seems to interest investors these days is central bank liquidity, and how much they can fill up on.
As is typical at the end of cycles, sentiment has become divorced from fundamentals. In the past, it has usually been investors chasing growth, like in 1999, or yield, like in 2006. Now everyone chases any signs of liquidity in the system, whether they understand what that means or not. Demand for US Treasuries remains very high despite all-time record supply, because many investors see an interest rate just above inflation as the best use of their capital. No amount of added liquidity is going to change that.
The surge in buybacks is clear evidence that companies don’t believe investing in new capacity with all this liquidity is a very good bet. They have generated record amounts of cash, and are returning all of it to investors. Some companies are even taking out debt at historically low rates to do buybacks, essentially raiding their own balance sheets.
In 2018, the S&P 500 companies returned over 99% of GAAP earnings to shareholders. To put this in context, all US companies spent an additional $251 billion in nominal dollars over 2017 on all fixed investment in all of 2018. Instead of adding to that, just the S&P 500 companies chose to return $1.26 trillion to shareholders, a $324 billion increase over 2017, the previous record year. This should tell you everything you need to know about how corporate leadership view organic earnings growth prospects.
This is a version of the Liquidity Trap that Keynes originally described. In his telling, when interest rates hit the lower bound, investors prefer cash to bonds and stop buying, driving rates back up when the central bank is trying to keep them low.
In this version, let’s call it LT2.0, the system is awash with liquidity, but the growth in the system doesn’t seem as attractive as a 6-month bill at 2.45% yield, or a 3-year bond at 2.26%, or the 10-year Bund at 0.07%, or buying your own shares. So the central bank loses the ability to juice the real economy with cuts to the lower bound, and only inflates asset prices.
Just How Awash Are We?L
Pretty awash, but not like we were going under. Yet.
There are two primary measurements of liquidity: the M1 and M2. M1 is currency and checking accounts, whereas M2 includes savings accounts, money market funds and small short-timed deposits like short-maturity CDs. We’re only going to be talking about M2, the broader measure.
All money supply measurements come from Fed Table H.6 “Money Stock and Debt Measures.”
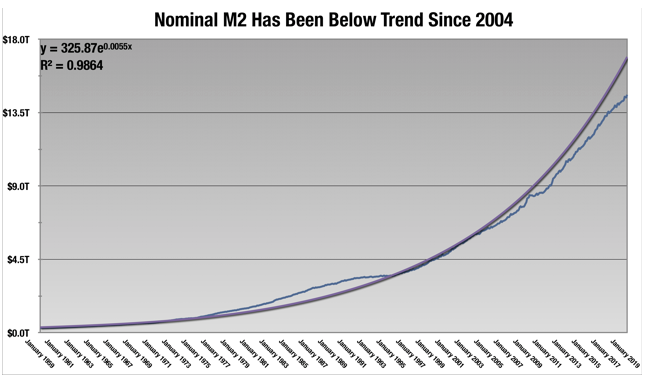
First let’s look how the money supply has grown in nominal dollars
As we should expect, the money supply grows exponentially, but we have been well below trend since 2004, with the inflection happening in the early 1980s after a bulge in the late 70s. What we are seeing is the effect of inflation, or the lack thereof, on the nominal money supply and vice-versa.
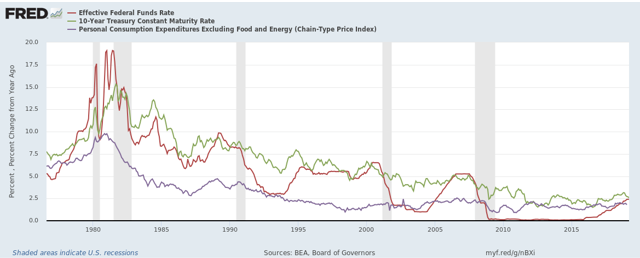
Since the peaks in the 70s, inflation has remained tamed. At first, the policies of the Volker Fed broke the back of inflation and brought it back to more reasonable levels in the 3-5% range. But after the 90s recession, inflation began dropping into its current range of 1.5-2.5% without any significant Fed policy driving it. Since then, inflation has remained historically low, and the Fed has not had big inflationary cues to raise the Fed Funds rate. As investors became convinced that the new low-inflation regime was not going anywhere, long term rates, as represented by the 10-year Treasury, have been dropping steadily over this long period.
So let’s get rid of inflation and look at real M2, using a 2012 chained-price deflator.
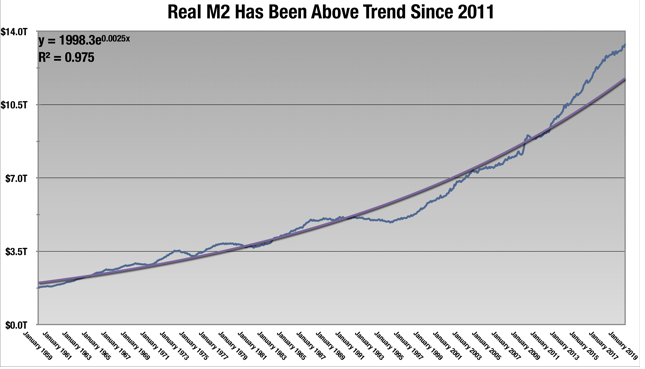
So this changes the picture radically. Even subtracting inflation, M2 grows exponentially. But now we see that real M2 has been well above trend since 2011, with the inflection happening at the financial crisis, and the Fed’s dramatic actions in its wake to reflate the economy.
In the past, nominal M2 growth over time has more or less been the same as nominal GDP growth (real GDP growth plus inflation). But since the recession, they have become divorced by Fed actions.
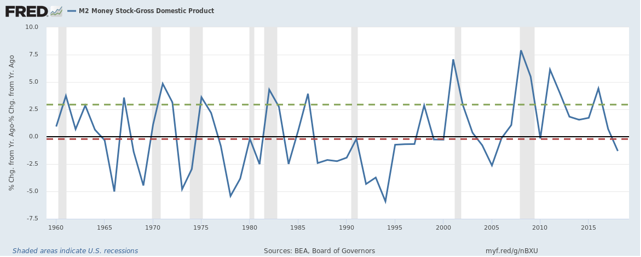
The blue line is the annual spread between nominal M2 growth and nominal GDP growth. In the pre-2008 period, the average YoY change was -0.21% (red line), basically zero. But since 2008, the average has been 2.94% (green line). This is the effect of the Fed actions. They have inflated the money supply, but not the economy nearly as much. Both real GDP growth and inflation remain muted.
While the low Fed Funds rate had a lot to do with this, there are diminishing returns to rate cuts as you approach the lower bound, so the Fed began quantitative easing, or buying US government debt at scale, as well as worthless mortgage-backed securities at inflated prices. The Fed has always kept some US debt on the balance sheet, both for the same reasons all banks do, but also to fill small holes in Treasury market liquidity as they arise at auction. Leading up to the recession, they held about half a trillion dollars in US debt, which had very little effect on the money supply.
But someone had the bright idea that if they bought small amounts of debt to fill small holes in liquidity, if needed, they could buy large amounts of debt to fill large holes in liquidity. So if we look at the M2 and subtract the liquidity the Fed has added with its balance sheet, we can see the huge gap that opened up. We’ll call this new measure M2-FED. To be clear, this is nominal M2 minus the sum of Fed holdings of US Treasuries, federal agency debt and mortgage-backed securities (from Fed Table H.4.1), then deflated with the 2012 chained-price index.
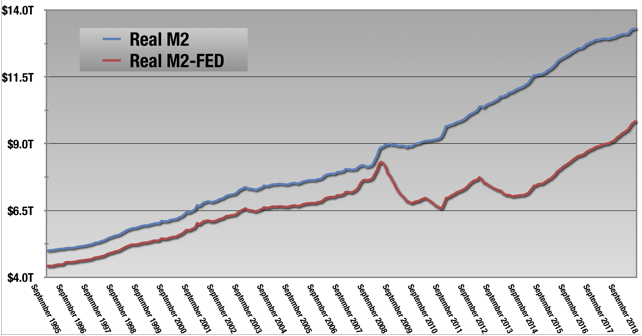
The red line approximates what would have happened to M2 had the Fed not stepped in and you see it is not pretty. We can clearly see the effects of the sequester (AKA, The Dumbest Bill Ever) on the reduction of M2-FED in 2013-2014, which forced the Fed to step in with more QE to keep M2 growing. Since 2015, the M2-FED has been growing at a very nice clip, but the balance sheet remains, and they will begin backdoor QE4 this fall. In the media, you have likely heard this referred to as “printing money,” or “monetizing the debt.” Both are accurate characterizations.
To be clear, monetizing the debt is a good thing in crisis times, but not so much at the end of the cycle.
So to sum up:
- Over time, nominal M2 grows exponentially. Its growth historically has mirrored the growth of nominal GDP.
- Since the last recession, real M2 has inflected above the historical trend. This is the result of Fed actions, particularly quantitative easing, and the lack of inflation that has typically accompanied increases in the money supply.
- While the Fed has been successful in inflating the money supply, they have been less successful at juicing nominal GDP growth. On average, there is a 3% per year spread in the growth rates since the crisis.
- Without Fed actions, the money supply would have been a hugely disastrous situation in the early recovery years.
- Instead of juicing nominal GDP growth, the Fed-sponsored M2 growth has gone to asset price inflation.
M2 and the S&P: A Love Story
Let’s dig a little deeper on asset price inflation. I will be using the S&P 500 as a proxy, but you could use the Case-Shiller home price index, or any other asset price index, and the results are similar. Since the S&P is nominal, we will be using nominal M2.
Stats 101 caveat! Correlation does not equal causation. You have been warned.
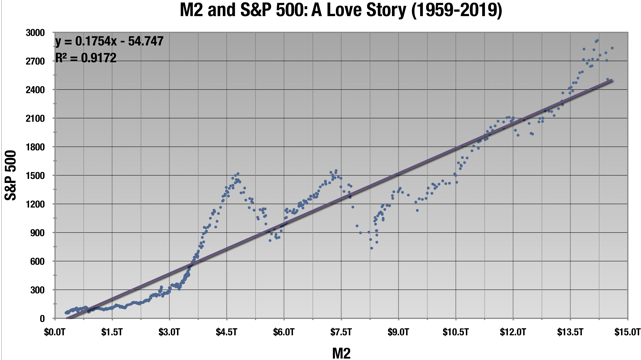
Starting with the historical data going back to 1959, we can see that in this long period, M2 and the S&P are highly linearly correlated.
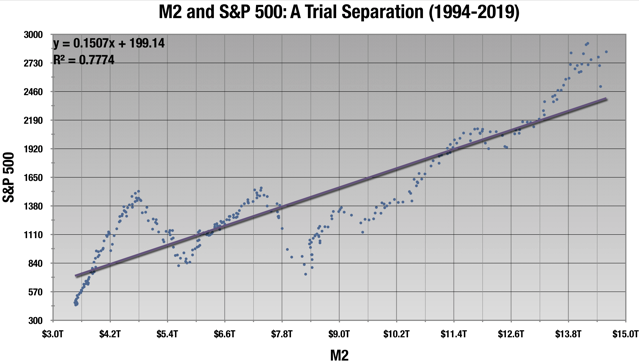
But since 1994, in the period of low interest rates and low inflation, the two have become much less correlated, as the relatively low Fed Funds has produced more exogenous factors affecting the S&P.
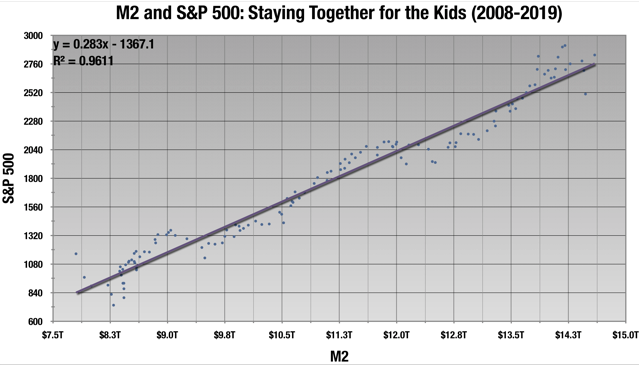
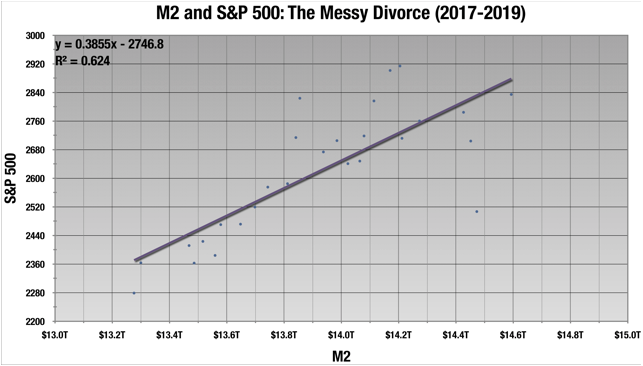
But to get back to where we started all this, since the crisis the S&P has become even more tightly correlated to the money supply than ever before. As we saw above, much of the growth in the M2 in this period is Fed-sponsored QE, made possible by the US deficit, so all four are correlated.
But since 2017, the promise and then reality of late-cycle stimulus from the federal budget left the two unmoored from each other.
I’m not a shrink, but I play one on Seeking Alpha. Seriously, I do spend a lot of time thinking and reading about market psychology, because I believe this is the most underappreciated aspect of analysis.
The experience of the post-crisis era (“Staying Together for the Kids”) has created an expectation that asset price growth will be even more closely tied to liquidity growth than ever. Much of this growth in liquidity came courtesy of the federal deficit and the Fed, not nominal GDP growth, but this has not seemed to matter to investors. When this broke in 2017 due to the expectation of late-cycle federal stimulus, it was to the upside and no one spent too much time worrying about it.
But then December happened. The 1-year effects of the stimulus were fading, and Fed-sponsored money supply inflation was fading, both via Fed Funds increases and balance sheet “normalization.” Even though M2 continued to rise through December at a fast clip, the Fed saw credit tightening and spreads collapsing – systemic liquidity was not translating to market liquidity. Thus, the double-pivot to radically reshape expectations.
But the Fed’s actions and signaling of possible future easing did not have the intended effect on the money supply which was down significantly in January and February (QT continues through the fall), recovering in March, but still below previous growth trajectories.
Market participants have begun to anticipate easing from the Fed, and sooner rather than later – sometime around 6 months, if the yield curve is to be believed.
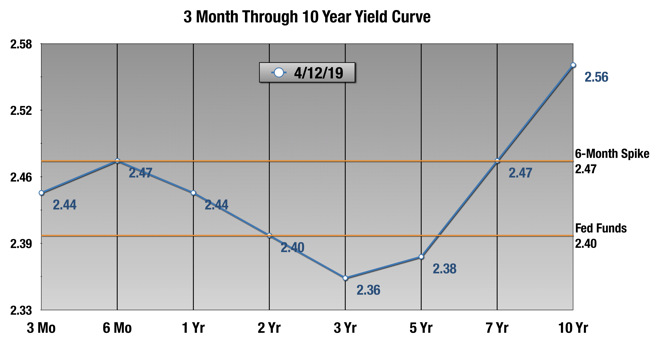
The 6-month bill is flat or inverted all the way to the 7-year bond. The 3- and 5-year maturities have been below Fed Funds for some time now, going as low as 2.16% just a couple of weeks ago. This tells us bond investors are anticipating that rates will start falling in the 6-12 month window, probably closer to 6 months at this point. Maybe in the fall when the Fed starts buying Treasuries again.
So we are back to 2017 again, hoping to return to that post-crisis ultra-tight correlation of liquidity and asset prices. But instead of market participants anticipating added liquidity from federal stimulus, they are anticipating added liquidity from the Fed. Since the Christmas Eve bottom, the relationship between M2 and the S&P has been shattered.
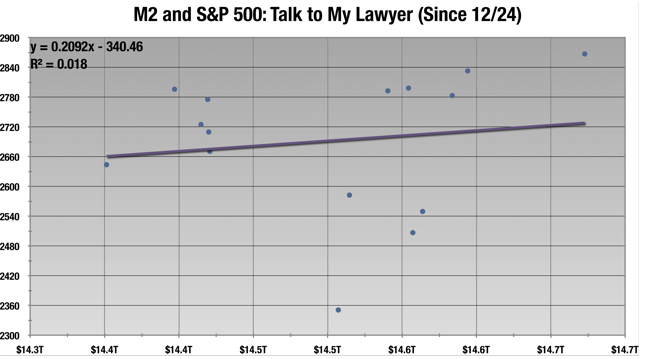
Small sample size, but it’s all over the map here. Again, so long as it’s to the upside, no one’s going to worry too much.
So, to sum up:
- Historically, nominal money supply and the S&P 500 are tightly linearly correlated.
- In the period of 1994 to the present, the relationship between the two became strained as permalow interest rates and inflation have added more exogenous factors.
- But the post-crisis period is characterized by an even tighter relationship between the money supply and the S&P than in the historical data. Much of the money supply growth in this period was sponsored by the federal deficit and the Fed’s balance sheet, not nominal GDP growth, as had previously been the case. The Fed’s actions have been much more successful in inflating the money supply and asset prices than nominal GDP.
- Since 2017, the money supply and S&P have become divorced from each other, especially recently. End-of-cycle psychology has taken hold, but instead of chasing growth like in 1999, or yield, like in 2007, based on the experience on the last 10 years, investors are chasing liquidity from the federal budget and the Fed.
Why You Should Care
There are two possible outcomes from this delicate balance that should worry you. The LT2.0 situation and systemic liquidity risk, both described above. Let’s dig down on these concepts.
We are living in a house of cards that has taken decades and three cycles to build. The muting of inflation post-1990 has led the Fed to keep Fed Funds unusually low, and when recessions have come, they have had progressively less and less ammo in their bandoliers to combat it. This is one of the reasons I believe the Fed should switch from inflation targeting to nominal GDP targeting.
| Year of Recession | Peak Fed Funds of Cycle |
| 1970 | 9.20% |
| 1974 | 12.92% |
| 1981 | 19.10% |
| 1990 | 9.84% |
| 2001 | 6.51% |
| 2007 | 5.25% |
| Current | 2.40% |
As we have seen, rate cuts have diminishing returns to the real economy near the lower bound. In 2007, the Fed had 525 bps to zero, and that was obviously not enough. If 240 winds up being the peak of this cycle, there will be little the Fed can do with interest rates and we will need more QE. A lot more.
Meanwhile, with a trillion dollar structural deficit that is only growing, there is very little hope for fiscal stimulus to fill a liquidity hole.
Japan is the first country where this happened, so let’s look at them and see where this can end up:
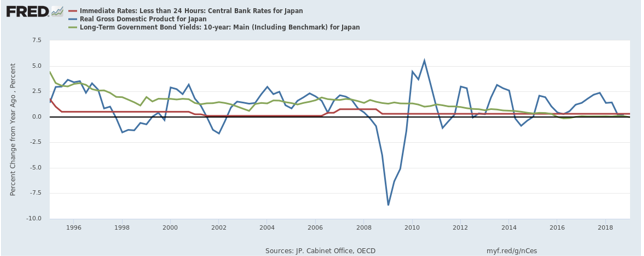
At the end of 2018:
- Overnight rate: 0.30%
- Real YoY GDP growth: 0.25%, with a 20-year CAGR of 0.8%
- 10-year government bond: 0.068%
Not pretty. This is all in a period where the overnight rate was close to zero almost the entire time.
Let’s look at Germany, where this also seems to be happening:
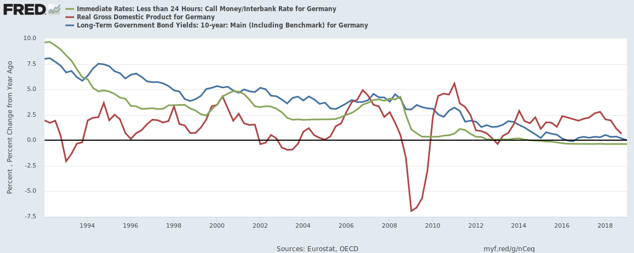
At the end of 2018:
- Overnight rate: -0.36% (negative since 2015)
- Real YoY GDP growth: 0.64% with a 1.4% 20-year CAGR
- 10-year government bond: 0.19%
This can all be ours if we’re not careful. The US numbers at the end of 2018:
- Fed Funds: 2.4%
- Real YoY GDP growth: 2.97% with a 20-year CAGR of 2.14%
- 10-year Treasury: 2.69%
Much better than the other two countries, but still well below historical norms on all accounts.
The most under-appreciated aspect of all this is working-age population growth, which is highly correlated to GDP growth in advanced economies. The 10-year CAGRs:
| Japan | Germany | United States |
| -0.90% | -0.11% | 0.49% |
That US number doesn’t look so bad by comparison, until I tell you that the 50-year US CAGR is 1.20%, over double the 10-year. Working age population growth has been decelerating rapidly for a number of demographic reasons, and restricting the immigration of working-age people will not help this.
So we are obviously not there yet, but the next recession could easily tip us into LT2.0.
But what may tip us into recession? This is where the danger of systemic liquidity risk comes in, and gets us back to market psychology. The experience of the last financial crisis is instructive here.
There were large numbers of empty subdivisions all over the country in places no one wanted to live in. Like our novelty potato chip example, these were only worth something so long as people thought they were worth something.
The “value” of these houses never changed – they were the same houses in the same places in 2008 as they were before. What was different was that everyone woke up one day and realized that, while the day before they thought they owned shares of a tranche of low-risk paying US mortgages, today they owned some worthless potato chips.
We are already in a pretax earnings recession in 2018, and without the growth in durables inventories that no one seems interested in buying, real GDP growth was very weak in H2 2018 – 0.59% annualized. The Atlanta Fed just upped their 2019 Q1 GDPNow estimate to 2.3% from a low of 0.3% at the beginning of March, largely on the back of, gulp, investment in inventories. Good God.
Meanwhile, GDPNow estimates of personal consumption expenditures growth plunged from 1.6% annualized (already well below the 2.8% annual growth of the past 2 years) to 0.7%. No one wants this stuff.
So will companies wake up one day and realize these inventories are just so many potato chips? What day is that? I would definitely like to know.
But inventories are just but one risk from assets that may be currently vastly overvalued by their owners:
- Student loans: $1.5 trillion.
- Credit card debt: $1 trillion.
- Auto loans: $1.25 trillion.
- US Equities: The ratio of the Wilshire 5000 to GDP is near the all-time highs of the dot-com bubble. Same for the S&P 500.
- US Mortgages: Again. The ratio of the Case-Shiller home price index to GDP is approaching the pre-crisis high.
This is just what I could come up with off the top of my head. Ask yourself: how many people were focusing on the systemic risk emanating from the US mortgage market in 2007? Very few. There may be risks hiding in plain sight that we do not even see. The “unknown unknowns” are the most troubling.
Summing UpP
- Over time, nominal M2 grows exponentially. Its growth historically has mirrored the growth of nominal GDP.
- Since the last recession, real M2 has inflected above the historical trend. This is the result of Fed actions, particularly quantitative easing, and the lack of inflation that has typically accompanied increases in the nominal money supply.
- While the Fed has been successful in inflating the money supply, they have been less successful at juicing nominal GDP growth. On average, there is a 3% per year spread in the growth rates since the crisis.
- Without Fed actions, the money supply would have been a disaster in the early recovery years.
- Instead of juicing nominal GDP growth, the Fed-sponsored M2 growth has gone to asset price inflation.
- Historically, nominal money supply and asset prices as represented by the S&P 500 are tightly linearly correlated.
- In the period of 1994 to the present, the relationship between the two became strained as permalow interest rates and inflation have added more exogenous factors.
- But the post-crisis period is characterized by an even tighter relationship between the money supply and the S&P than in the historical data. Much of the money supply growth in this period was sponsored by the federal deficit and the Fed’s balance sheet, not nominal GDP growth, as had previously been the case. The Fed’s actions have been much more successful in inflating the money supply and asset prices than nominal GDP.
- Since 2017, the money supply and S&P have become divorced from each other, especially recently. End-of-cycle psychology has taken hold, but instead of chasing growth like in 1999, or yield, like in 2007, investors are chasing liquidity from the federal budget and the Fed.
- The major risks here are LT2.0 and systemic liquidity risk.
- With the Fed Funds at 2.4%, the Fed will have very little ammo to combat the next recession.
- With trillion dollar structural deficits as far the eye can see, the hope for fiscal stimulus to fill liquidity holes is slim.
- The experience of Japan is instructive: low population growth, low economic growth, low inflation, low interest rates. This is not a recipe for a dynamic economy.
- There are many asset classes that may be overvalued by their owners.
So where does that leave us? So long as everyone believes that the Fed will continue to provide liquidity absent nominal GDP growth, and that this will inflate asset prices, not nominal GDP, assets will be the thing to own.M
But one day, everyone may wake up and realize they own a bag of potato chips. Again, I would like to know what day that is.
Remember, Wile E. Coyote stays aloft, until he looks down.
Article written by Trading Places Research and Published by Seeking Alpha.


