
Welcome to another trading week!! In appreciation of all of our Basic Membership level participants and daily readers of finomgroup.com content, we offer the following excerpts from our Weekly Research Report. Our weekly Report is extremely detailed and has proven to help guide investors and traders during all types of market conditions with thoughtful insights and analysis, graphs, studies, and historical data/analogues. We encourage our readers to upgrade to our Contributor Membership level ($7.99 monthly, cancel any time) to receive our Weekly Research Report and State of the Market Videos and take advantage of this ongoing promotional event today! Have a great trading week, be in touch, and take a look at some of the materials in this weekend’s published Research Report!
Research Report Excerpts #1
With the S&P 500 chart from October 31st potentially pointing to further deterioration, the market made a complete pivot starting this past Monday. This day proved to highlight the relevance of understanding the historic data as well.
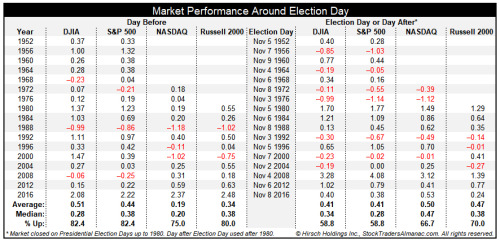
- Looking back at the last seventeen presidential elections since 1952, the day before Election Day has a clear bullish bias. DJIA and S&P 500 have declined just 3 times and average gains of 0.51% and 0.44% respectively.
- NASDAQ and Russell 2000 are slightly weaker, but still bullish.
- Election Day (or the day after prior to 1980) leans bullish, but with a greater frequency of losses. Incumbent party victories are shaded in light grey.
Research Report Excerpts #2
So let’s take a look at the up-to-date S&P 500 technical overview.
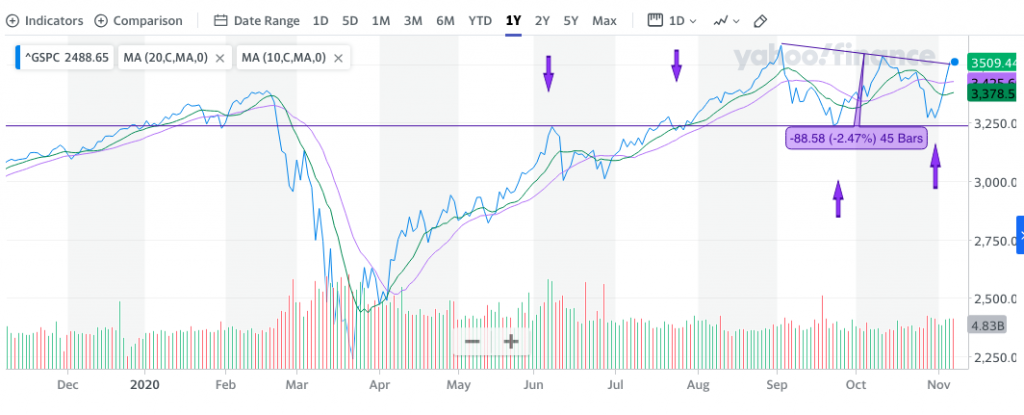
What we can identify from the technical representations above is the following key points:
- The S&P 500 had an extremely swift upside move.
- The S&P 500 did not make a series of lower lows.
- Support held at the former base of the head-n-shoulders pattern (3,230-3,240).
- Closed the week above the 10 and 20-DMA, with the 20-DMA crossing above the 10-DMA and indicating a rapid and broad market advance.
- Closed the week slightly above the downward sloping trend line.
With this past week’s price action, the S&P 500 is up 7.32% so far in November. This is the best start (after 4 days) to the month of November ever. 2020 continues to provide investors with records and unprecedented occurrences. SO REMAIN FLEXIBLE FOLKS!!
Research Report Excerpts #3
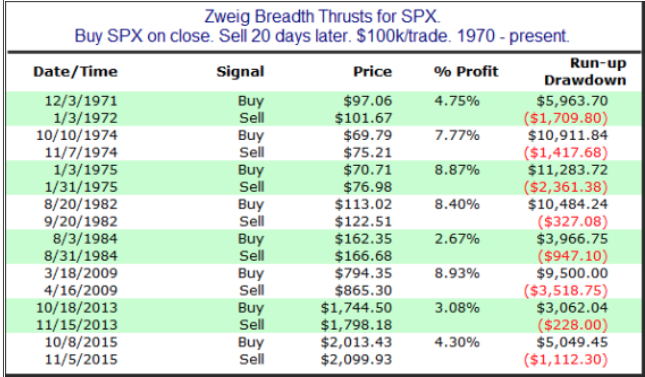
Moreover, maybe it is no coincidence that a Zweig Breadth Thrust is near occurring after the election. No matter the election outcome, upturns in money flows to the stock market have come with elections, historically.
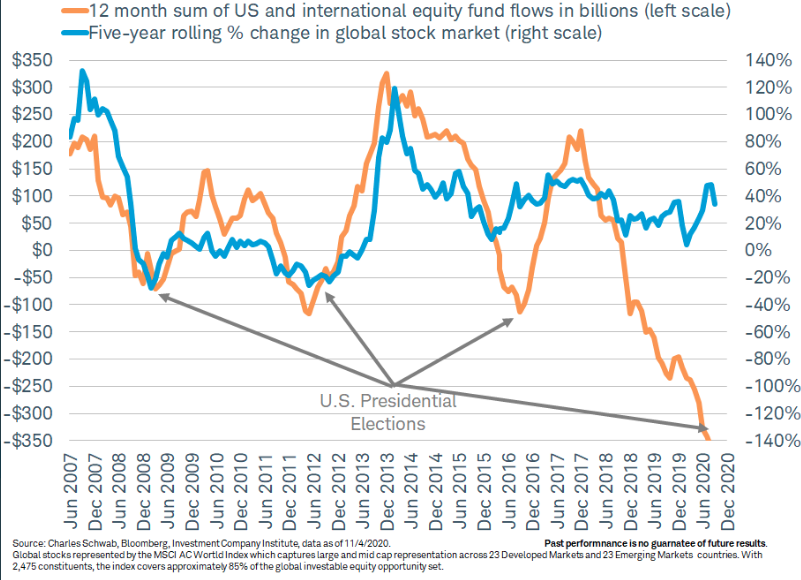
The chart doesn’t lie, for each of the last several election cycles, we’ve seen inflows of capital for equities. Let’s not forget about the vaccine. The market may be beginning to anticipate the *tsunami* of Phase III read outs for vaccinesand therapeutics that we are going to see over the next 6 weeks. Many of these are likely to be positive developments.
Research Report Excerpts #4
Not only did the breadth indicator recently test a significant washout level at 5%, but it rallied to above 80% in one trading week, in keeping with our Zweig Breadth Thrust potential. As it pertains to the Advance/Decline line for the NYSE (chart below), we can see that this is near its former highs. Breadth “tends” to lead price, especially when in an uptrend. Macro-events and or exogenous events can offset breadth signals of course.
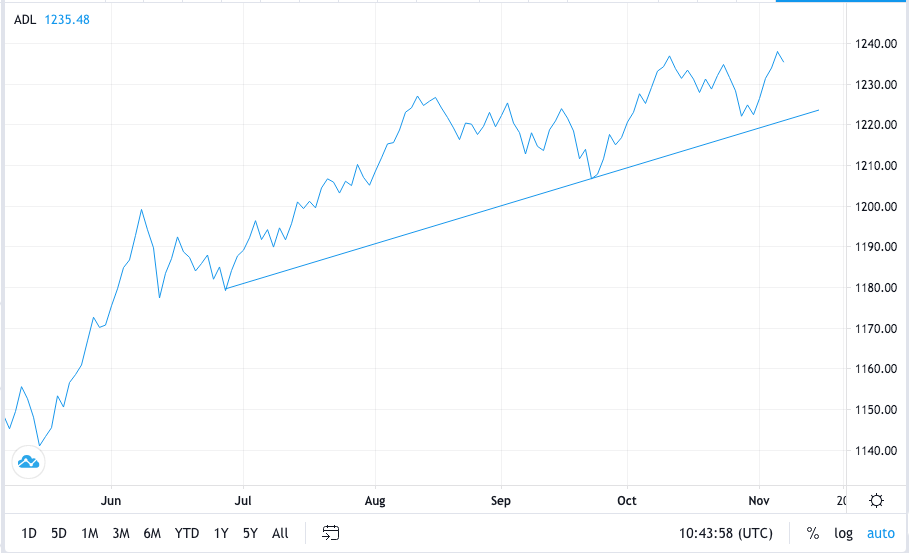
While the S&P 500 showed signs of broadening strength this past week, the Nasdaq proved that much more technically aggressive or positive.
Research Report Excerpts #5
At the same time, the total for those receiving benefits showed a sharp decline, falling by 1.15 million to 21.5 million. For the same period in 2019, 1.44 million people were getting benefits, reflecting just how deep the jobless problem remains in the pandemic era.
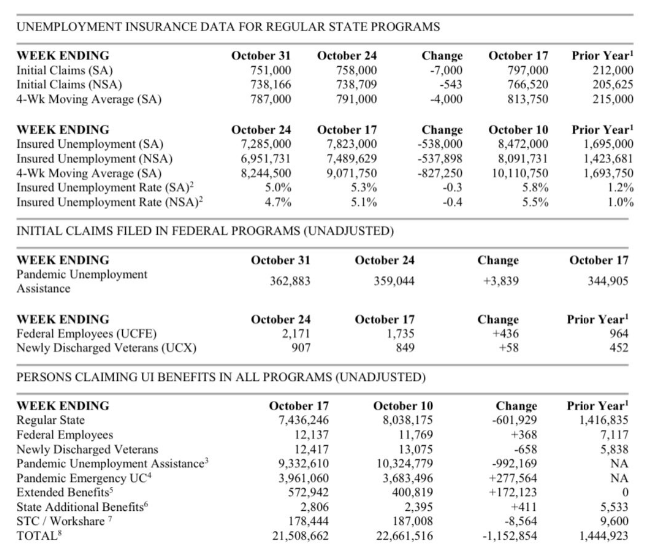
The good news remains, jobless claims continue to trend lower, however slowly. The bad news is that we gained jobsthis month, but the chart shows worrying evidence of more people falling into long term and permanent jobloss/unemployment.
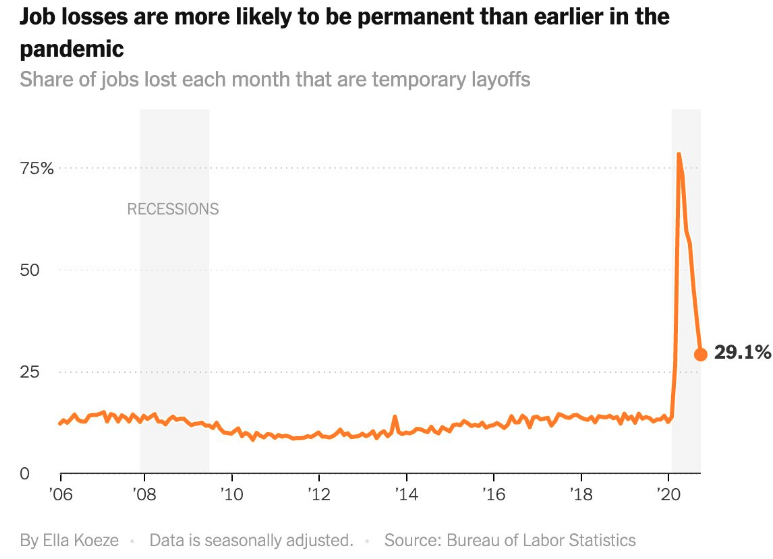
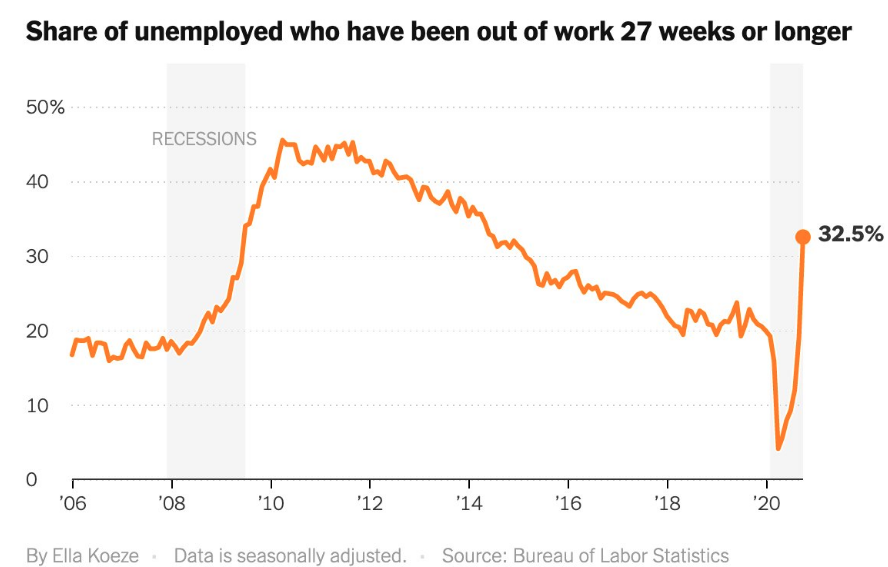
What the chart above depicts or assumes is that as the share of jobs lost each month graph is declining to represent temporary layoffs declining, permanent jobs lost is increasing. This does seemingly fit with the chart analysis of permanent job loss below:
Research Report Excerpts #6
We continue to see the consumer hold up well in the current economic environment, which remains with a higher Personal Savings Rate, partly fueled by transfer payments from the former Cares Act.
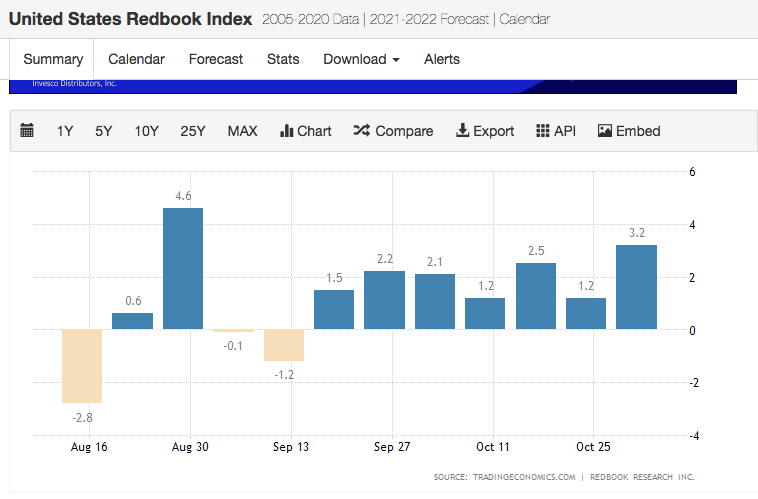
Nonetheless, we have seen Redbook weekly retail sales trend higher for 7 consecutive weeks.
Research Report Excerpts #7
As the earnings’ beat rate continues its torrid pace and the positive quarterly revisions march on, it should be perfectly acceptable to witness stock prices declining while earnings move higher as it declares a longer-term and more profitable opportunity for savvy investors. The current consensus analysts estimates for 2020 EPS and 2021 continue to ratchet higher and to their highest forecast since the recession.
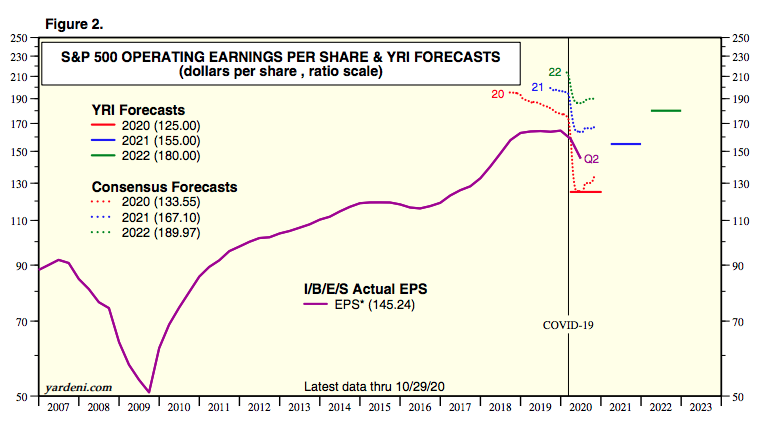
As shown in the chart above, FY2020 consensus analysts estimates call for EPS of $133.55 versus the prior week at $132.13.
Research Report Excerpts #8
As it pertains to valuations, given this seems to be the hesitation for many investors to increase equity market exposure during the infancy stage of an economic recovery cycle still plagued by relatively high valuations and a spike in the infection rate, I present the following chart:
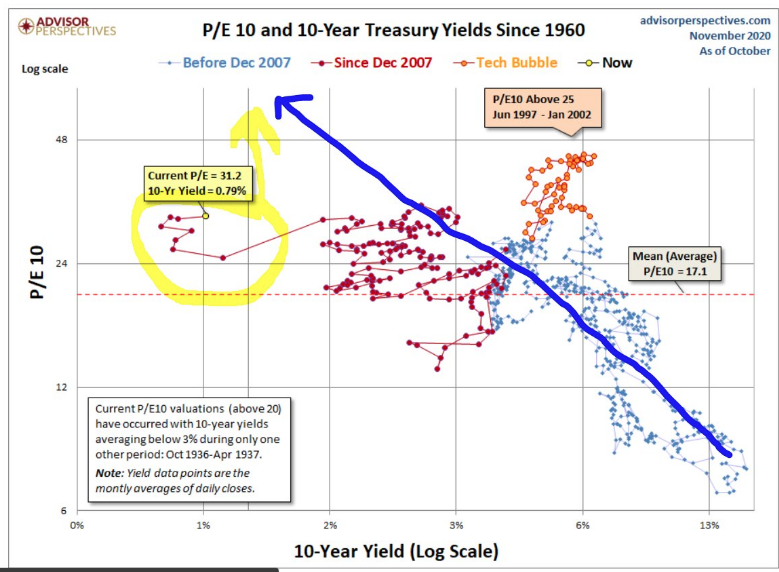
What the chart outlines is the trend of the S&P 500 Price-to-Earnings (PE) multiple across the path of a decline 10-Year yield. As the yield for the safe-haven Treasury has fallen over time, the S&P 500 PE has risen. With a 10-year yield below 1%, therefore, it should be unsurprising that the S&P 500’s PE is above its 5 and 10-year average PE. Some might say this is to be expected and on-trend!
Research Report Excerpts #9
I wrote about the Zweig Breadth thrust in Finom Group’s January 13, 2019 Research Report, which articulated the statistical findings for Zweig Breadth Thrusts so as our subscribers could better understand the powers of such a breadth thrust.
- Since 1962, there have only been 11 Zweig breadth thrusts. (not including the January 2019 occurrence)
- The forward results are impressive when this occurs. Since 1970, the S&P 500 has continued to rally every time over the next 20 days by a median of about 6% (table from Quantifiable Edges).
- To get a Zweig Breadth Thrust signal, that ratio needed to go from below 0.40 to above 0.615 in 10 trading days or less. (2 trading weeks)
- There remains the potential for a breadth thrust in the coming week.
- If it moves from the current .54 to above .615 by Thursday this coming week, a Zweig Breadth Thrust will occur.
- Finom Group will provide the alert to subscribers should a Zweig Breadth Thrust occur.
Thank you for joining us for another trading week and reviewing our weekly “Must Knows”! To receive and review our weekly, full-scale Research Report each Sunday and our State of the Markets weekly video analysis every Thursday, subscribe to our Contributor Membership level at just $7.99 monthly (Cancel any time)! With these two weekly deliveries, you’ll have all the unbiased and fact-driven market and economic data analysis at your fingertips. Don’t make capital allocation decisions based on headlines that brush the surface of what is and isn’t affecting markets. Let our deep-dive analytics supply you with bottom-up and top-down analytics. You won’t be disappointed. Upgrade today!!


