Fed Funds Rate History
The charts below show the targeted fed funds rate changes since 1971. The Federal Open Market Committee (FOMC) didn’t announce its target interest rate after meetings until October 1979. The Fed adjusted the rate through its open market operations. Banks were forced to guess what the rates would be as a result. The Fed tried to fight inflation without managing the expectations of inflation.
The Fed began targeting the money supply to fight inflation in 1979. The fed funds rate fluctuated a great deal between 1979 and 1982 as a result. Then in 1982, the Fed returned to targeting the fed funds rate.
The FOMC formally announced its policy changes for the first time in February 1994. Its announcements since then have made clear what it wants the interest rate to be. This policy manages expectations of inflation and minimizes disruptions caused by surprises from the Fed.
These are the target fed funds rates, along with the events that triggered the changes in cases where they did so. The Fed typically announces a range for its benchmark rate. The tables below show the high end of the range, while the low end is a quarter-point lower.
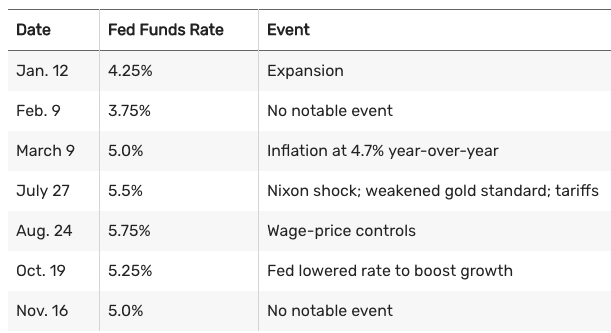
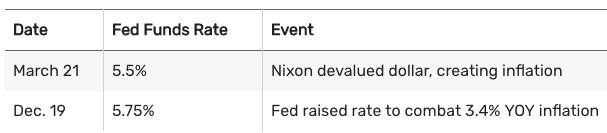
Fed Chair Arthur Burns (January 1970-March 1978)
The GDP was 3.3% in 1971, the unemployment rate was 6.0%, and inflation was 4.4%.
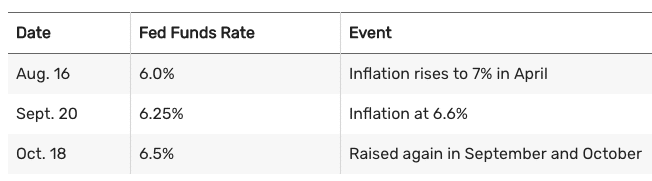
Fed Chair William Miller (March 1978-August 1979)
The GDP was 5.5% in 1978, unemployment was 6.0%, and inflation was 7.6%.
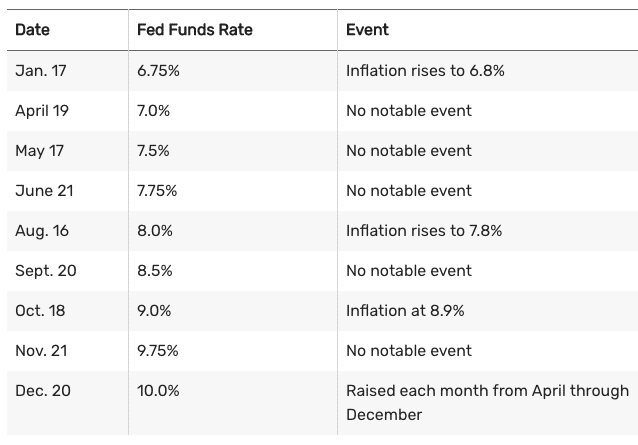
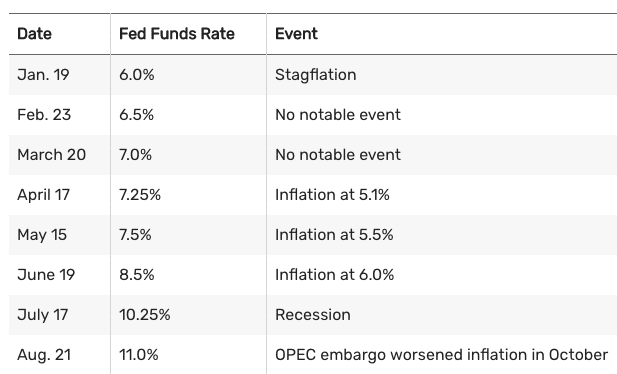
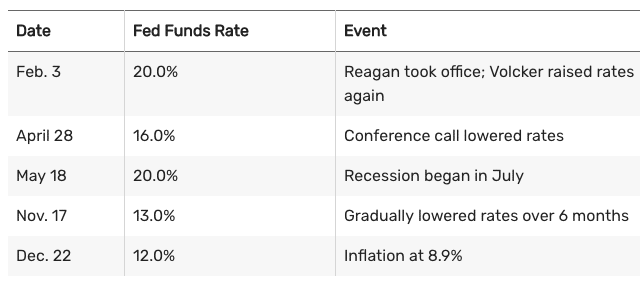
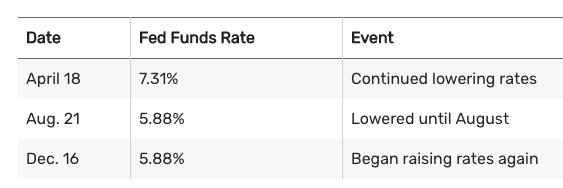
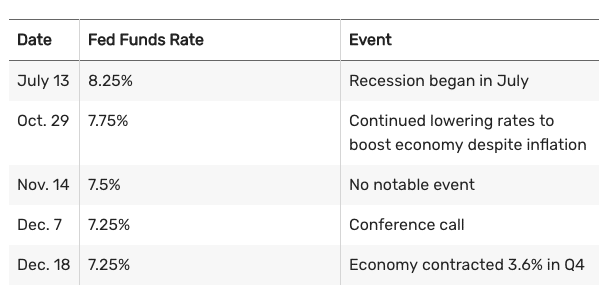
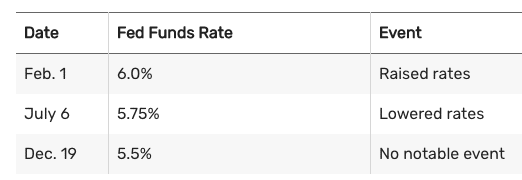
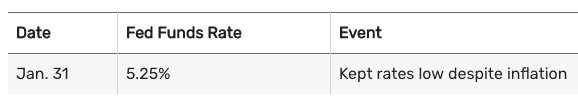
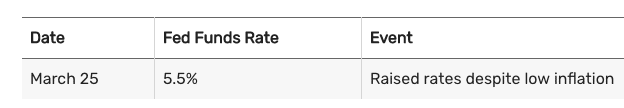
Fed Chair Paul Volcker (August 1979-August 1987)
The GDP was 3.2% in 1979, unemployment was 6.0%, and inflation was 11.3%.
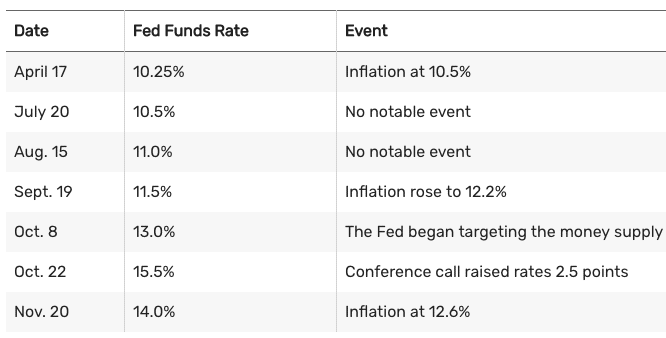
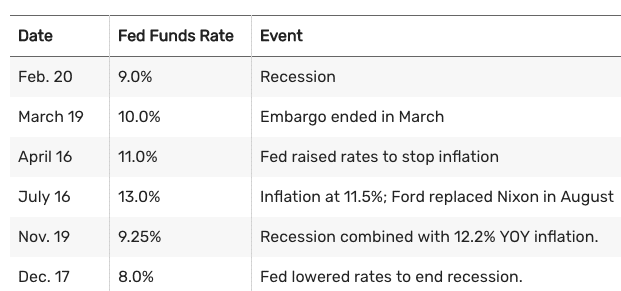
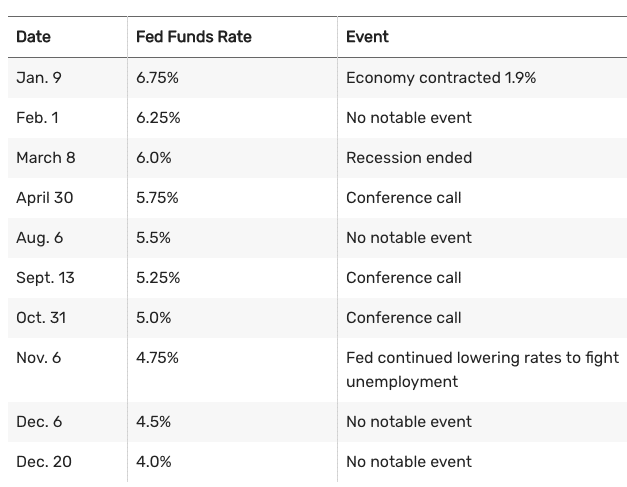
The GDP was -0.3% in 1980, unemployment was 7.2%, and inflation was 13.5%.
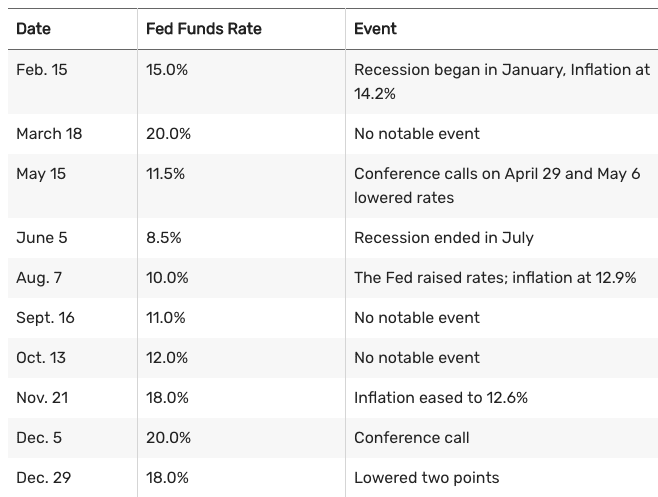
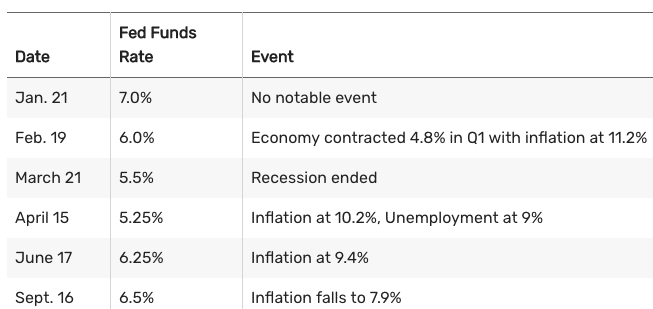
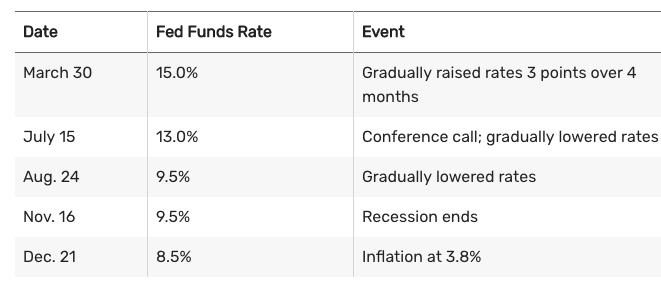
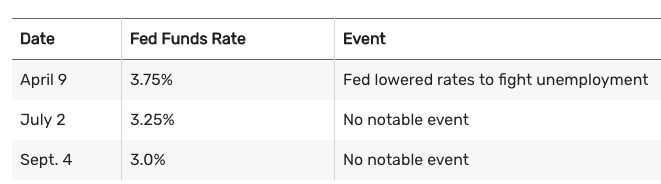
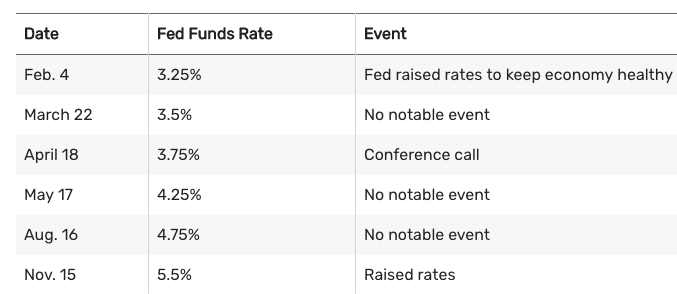
The GDP was 2.5% in 1981, unemployment was 8.5%, and inflation was 10.3%.
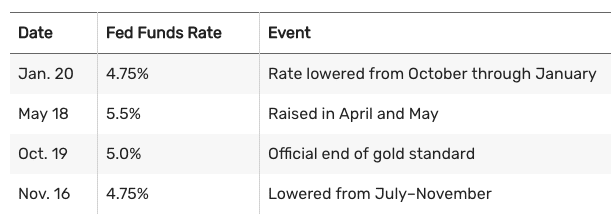
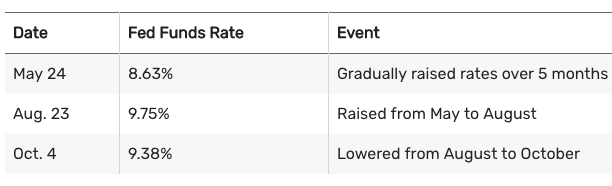
The GDP was -1.8% in 1982, unemployment was 10.8%, and inflation was 6.2%. Data from 1982–2007 is from the Federal Reserve Bank of St. Louis’ discontinued target fed funds rate series.
The GDP was 4.6% in 1983, unemployment was 8.3%, and inflation was 3.2%.
The GDP was 7.2% in 1984, unemployment was 7.3%, and inflation was 4.3%.
The GDP was 4.2% in 1985, unemployment was 7.0%, and inflation was 3.6%.

The GDP was 3.5% in 1986, unemployment was 6.6%, and inflation was 1.9%.
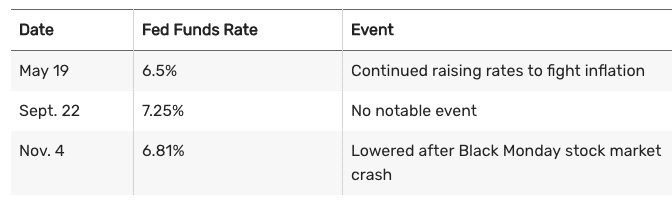
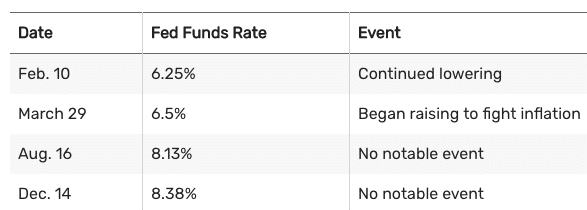
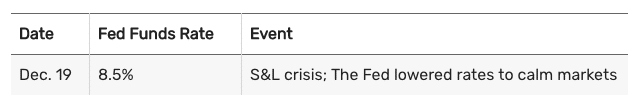
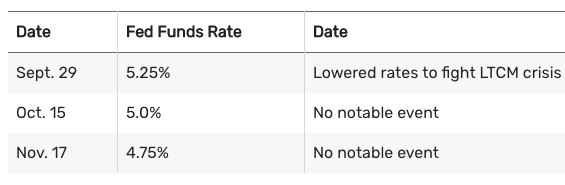
Fed Chair Alan Greenspan (August 1987-January 2006)
The GDP was 3.5% in 1987, unemployment was 5.7%, and inflation was 3.6%.
The GDP was 4.2% in 1988, unemployment was 5.3%, and inflation was 4.1%.
The GDP was 3.7% in 1989, unemployment was 5.4%, and inflation was 4.8%.
The GDP was 1.9% in 1990, unemployment was 6.3%, and inflation was 5.4%.
The GDP was -0.1% in 1991, unemployment was 7.3%, and inflation was 4.2%.
The GDP was 3.5% in 1992, unemployment was 7.4%, and inflation was 3.0%.
In 1993, the GDP was 2.8%, unemployment was 6.5%, and inflation was 3.0%. President Clinton took office in 1993. The Fed made no changes.
The GDP was 4.0% in 1994, unemployment was 5.5%, and inflation was 2.6%.
The GDP was 2.7% in 1995, unemployment was 5.6%, and inflation was 2.8%.
The GDP was 3.8% in 1996, unemployment was 5.4%, and inflation was 3.0%.
The GDP was 4.4% in 1997, unemployment was 4.7%, and inflation was 2.3%.
The GDP was 4.5% in 1998, unemployment was 4.4%, and inflation was 1.6%.
The GDP was 4.8% in 1999, unemployment was 4.0%, and inflation was 2.2%.
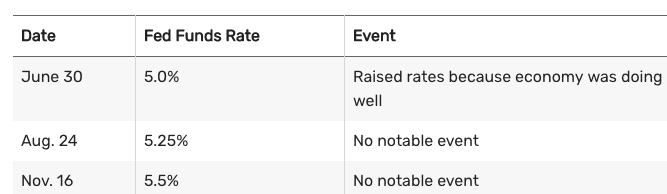
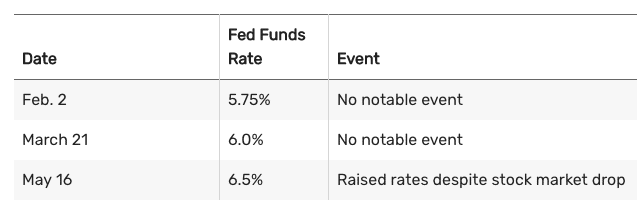
The GDP was 4.1% in 2000, unemployment was 3.9%, and inflation was 3.4%.
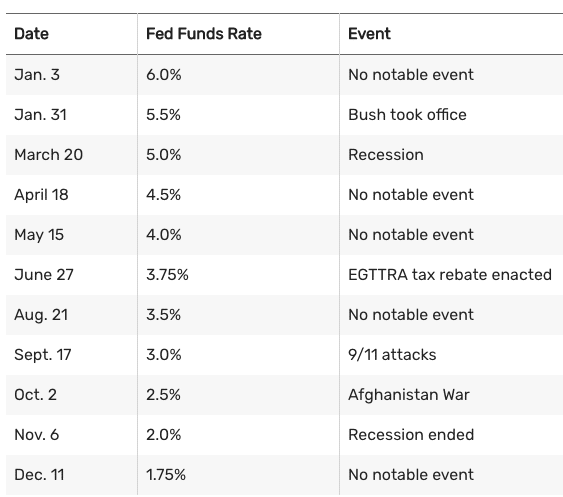
The GDP was 1.0% in 2001, unemployment was 5.7%, and inflation was 2.8%.
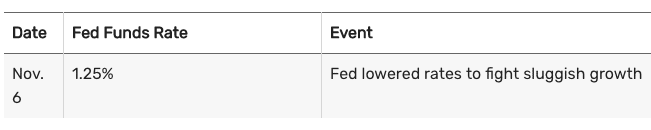
The GDP was 1.7% in 2002, unemployment was 6.0%, and inflation was 1.6%. The following tables have data taken from The Federal Reserve.
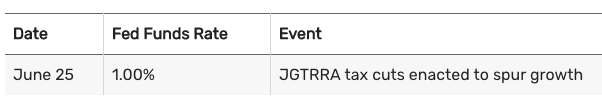
In 2003, the GDP was 2.8%, unemployment was 5.7%, and inflation was 2.3%.
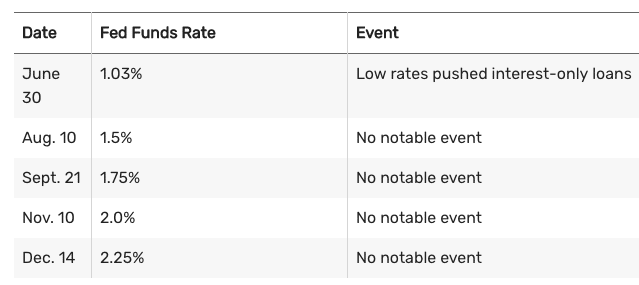
In 2004, the GDP was 3.9%, unemployment was 5.4%, and inflation was 2.7%.
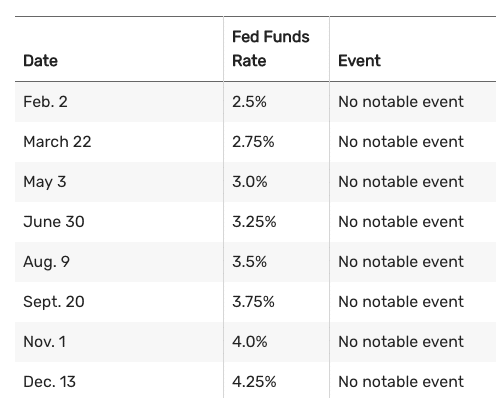
In 2005, the GDP was 3.5%, unemployment was 4.9%, and inflation was 3.4%.
Fed Chair Ben Bernanke (February 2006-January 2014)
In 2006, the GDP was 2.8%, unemployment was 4.4%, and inflation was 3.2%.

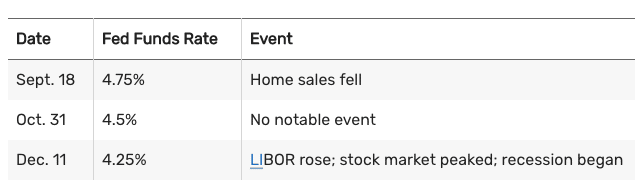
In 2007, GDP was 2.0%, unemployment was 5.0%, and inflation was 2.8%.
In 2008, The GDP was 0.1%, unemployment was 7.3%, and inflation was 3.8%. As of Dec. 16, 2008, the target funds rate became a range, represented in the tables by the upper limit.
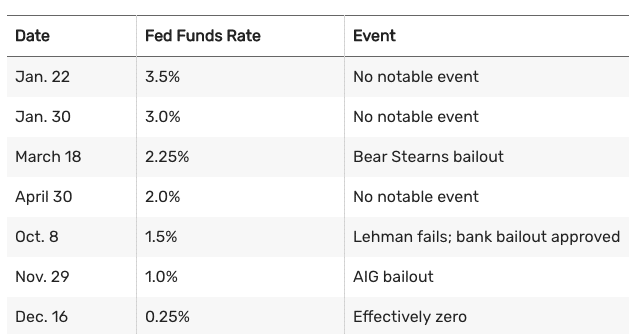
The Fed kept the rate at zero between 2008 and 2015. The recession ended in June 2009.
Fed Chair Janet Yellen (February 2014-February 2018)
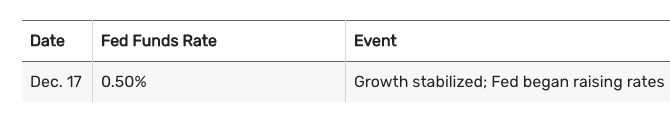
In 2015, GDP was 2.3%, unemployment was 5.0%, and inflation was 0.1%.
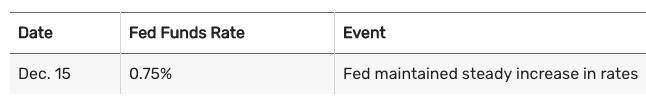
In 2016, the GDP was 1.7% in 2016, unemployment was 4.7%, and inflation was 1.3%.
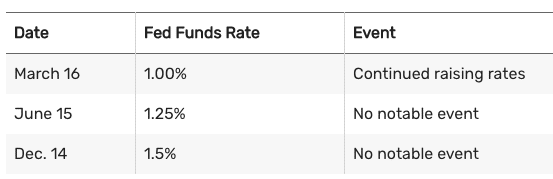
In 2017, the GDP was 2.3%, unemployment was 4.1%, and inflation was 2.1%.
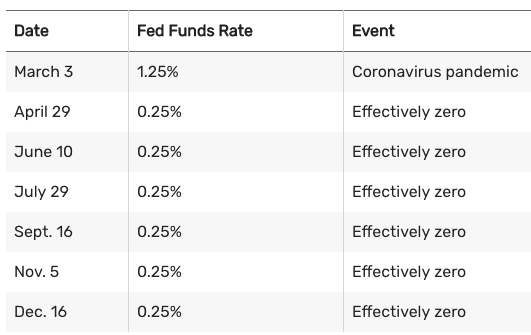
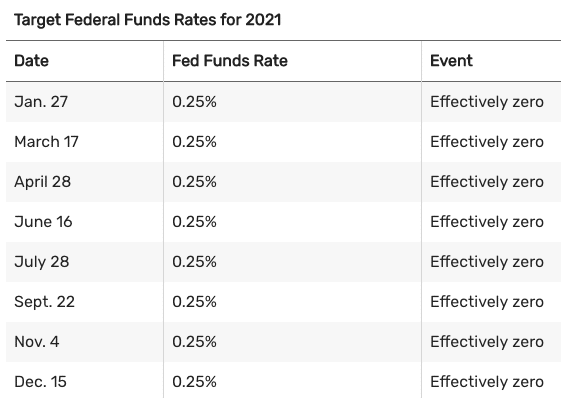
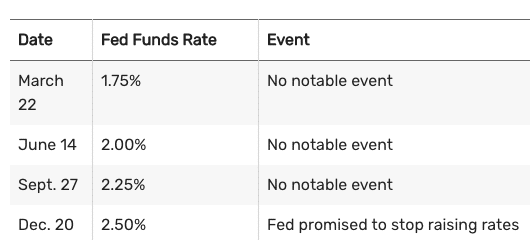
Fed Chair Jerome Powell (Since February 2018)
In 2018, the GDP was 2.9%, unemployment was 3.9%, inflation was 2.4%.
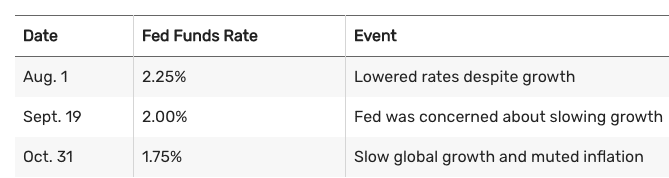
In 2019, the GDP was 2.3%, unemployment was 3.5%, and inflation was 1.9%.
In 2020, the GDP decreased 3.4%, inflation was 1.2%, and unemployment was 6.7%.