
The Dow Jones industrial average plunged 458.92 points to close at 23,644.19, with Intel as the worst performing stock in the index. Intel dropped 6.1 percent after Bloomberg reported Apple would use its own chips for Mac computers, ditching Intel. The S&P 500 dropped 2.2% to 2,581.88 and re-entered correction territory, with tech falling 2.5 percent. The index also closed below its 200-day moving average. The Nasdaq composite dropped 2.7% to 6,870.12 as Amazon declined 5.2 percent. Amazon fell after President Donald Trump tweeted on Saturday that Amazon was scamming the U.S. Postal Service, adding the service loses “billions of dollars” delivering packages for the e-commerce giant.
The tech-heavy Nasdaq has maligned the latest re-correction period in equities. The worst performers from Monday’s trade are indicated in the table below from FactSet.
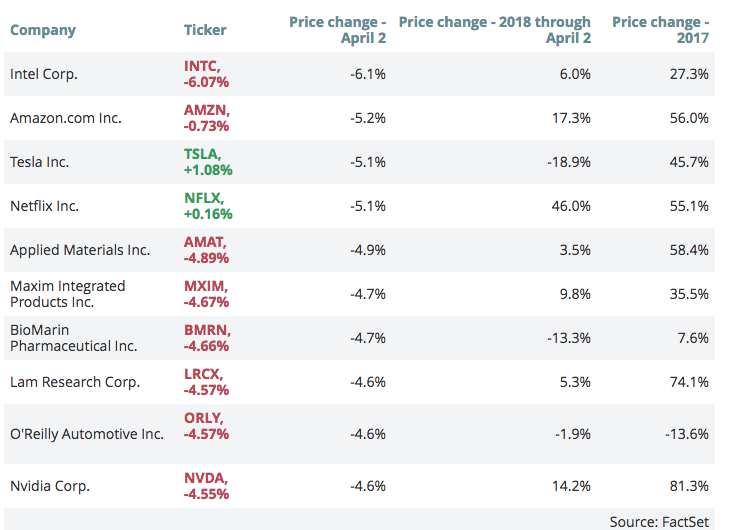
In watching the market action Monday, the first trading day of April, there was a clear vacuum effect created by S&P losing grip on the 200-day moving average. The 200-day was at 2,589. At current levels, the Dow Jones Industrial Average remains 0.9% above its 200-day moving average, while the Nasdaq Composite Index is 1.8% above its own.
Holding above the 200-day moving average had been seen as a mark in Wall Street’s favor over the last year plus. Jeffrey Saut, chief investment strategist at Raymond James, noted that the S&P 500 has closed above its 200-day moving average for 443 sessions, a streak he called “truly remarkable” and which he said, “demonstrates the power of this secular bull market.”

“We’ve broken it, and we’re sitting below it, which shows real selling, and the longer we stay below, the more probability we at least test the Feb. 9 low at 2,530-ish,” said Scott Redler, partner with T3Live.com.
The VIX was up 18% Monday. It had been as high as 25.72 Monday, before settling back under 24. Volatility has been indicative and defining of the 2018 market action. Strategists have varying views of how low the market can go and how long volatility can remain elevated before stabilizing, but they all see earnings as the next catalyst for markets. Expectations for earnings season are high with S&P 500 earnings expected to grow in the high teens. According to Thomson Reuters, earnings for the S&P 500 are expected to be up about 18.5 percent in the first quarter.
The selling pressure on the major averages has not been one of chaos or panic. It has been very much done in an orderly fashion and largely without significant volume. Additionally, the selling pressure has come with a lack of buying to offset. Much of Monday’s selling pressure increased due to the lack of corporate buybacks as we enter earnings season later this week. Corporate buybacks generally go into a state of inactivity ahead of earnings release dates.
Trade policy continued to weigh heavily in the minds of investors after China announced tariffs on about 130 U.S. goods, including a 25% penalty placed on U.S. pork and 15% on fruit. The retaliatory tariffs are of minimal consequence and amount to very little impact to U.S. producers, but they may lead to greater retaliation as is feared. Of course, this remains to be seen as most believe cooler heads will prevail through negotiations to come.
The S&P 500 Index is down almost 11% from its late January high and remains in correction territory after losing grip on its 200-day moving average for the first time since the United Kingdom’s vote for Brexit in June 2016. Fear was rampant in global equities back then and seemingly looms large at present. But that’s not necessarily being confirmed in the Equity Put/Call reading, as indicated in the chart from the CBOE below.
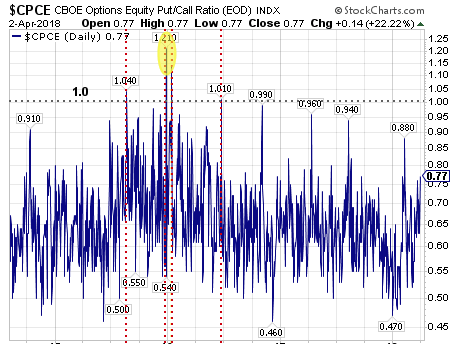
The Equity Put/Call Ratio reading after Monday’s close was .77 and far below the extreme fear level of 1.0. In the February 2016 pullback, the equity put/call ratio twice reached levels in excess of 1.0. For those unfamiliar with equity put/call ratio measures, it takes the sentiment of the individual investor by dividing put volume by call volume. P/C ratios above 1.0 signal extreme bearish sentiment from the individual investor.


