
Is it the Fed? Is it China’s bear market? Is it Italian sovereign debt? Take your pick, but it is probably none of the above or all of the above that sent U.S. equities reeling on Thursday. China’s stock market plunged deeper into bear market territory overnight on Thursday, which found European equities under pressure. The selling in Europe carried over to Wall Street on Friday and may have been exacerbated by Mario Draghi.
European Central Bank President Mario Draghi criticized plans by certain member countries to increase borrowing limits, sending Italian and Spanish yields up sharply and just ahead of European markets closing for the trading day. Relatively safer bonds, such as German bunds and U.S. Treasurys, caught a safety bid as equities in Europe and on Wall Street extended losses. U.S. yields initially rose Thursday after the Federal Reserve’s latest meeting minutes showed members were confident in the current path of interest rate hikes and wary of frothiness in financial markets.
The U.S. two-year Treasury yield hit a high of 2.907%, its highest level since June 25, 2008, before falling to 2.878% on the day. Despite the fear evoked from Draghi’s comments, investors will eventually conform to the understanding that the ECB President will do what he has to do in order to maintain stability in the debt markets within the EU.
Overnight, China’s Shanghai Index bounced back after China released its latest GDP results. Greater China markets made a strong comeback following a series of measures announced by Chinese leaders to support the struggling stock market. Following the release of GDP results, which came in at 6.5% and narrowly missing estimates of 6.6%, the People’s Bank of China, the Securities Regulatory Commission and the Banking and Insurance Regulatory Commission all issued statements expressing support for the stock market and positive economic fundamentals.
Futures are pointing to a positive open on Wall Street after another route on Thursday. The Dow finished lower by 1.2% or 327 points with the S&P 500 falling 1.4% or 40 points. The tech-heavy Nasdaq was the worst performing index on Thursday, tumbling just over 2% or 157 points. Volatility has been the name of the game since Q3 2018 earnings season has kicked-off and on Thursday the VIX rose above 21% again before settling just over 20% for the day. Regardless of the rationale for U.S. markets falling one chooses to side with, the fundamental backdrop for higher equity prices remains in tact, according to Finom Group’s chief market strategist Seth Golden.
“We’re right where we’re supposed to be at this time of year. We just had the FOMC reaffirm its rate hike outlook through 2019 and the market is simply adjusting to higher rates through the equity/bond portfolio allocation rebalancing exercise or rationale. Bonds are becoming a greater competing force for equities with each instituted rate hike, this is normal and even healthy you might say for the markets. Ultimately, bonds are still not as attractive as equities and won’t be until they get closer to 4-4.25% historically.
This is what we’ve seen throughout 2018 so far with each rate hike. But even more so than that is we’ve gone some 70+ trading sessions without even a 1% pullback. Newsletter writers had become there most bullish since early January. It was time to hit the pause button, validate the gains through corporate earnings and economic data and set the stage for the next leg higher.”
Another factor, that Goldman Sachs CEO David Solomon believes plays a roll in the market’s swift and sizable moves is the aspect of mechanical, programmed trading.
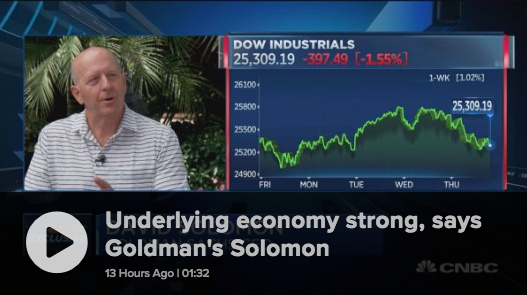
“There’s no question when you look at last week, some of the selling is the result of programmatic selling because as volatility goes up, some of these algorithms force people to sell,” Solomon told CNBC’s Wilfred Frost. “Market structure can, at times, contribute to volatility and one of the things that we’re spending a bunch of time thinking about at the firm is how changes in market structure over the course of the last 10 years will affect market activity.”
Market pullbacks, seemingly out of the blue or even heralded for fears of an economic slowdown can be difficult for many investors/traders to wade through. Having a long-term thesis and outlook on the economy can prove a benefit for navigating temporarily troubled equity markets. Speaking of the economy, Thursday release of a series of economic data points proved, once again, the economy is and has been on sound footing.
First-time jobless claims fell by 5,000 from a week ago, as the Labor Department reported just 210,000 Americans applying for initial jobless benefits in the week ending Oct. 13, in line with economist estimates, according to a poll by MarketWatch, and close to 49-year lows. Historically, as initial jobless claims go, so does the economy and the stock market follows, as shown in the following chart.
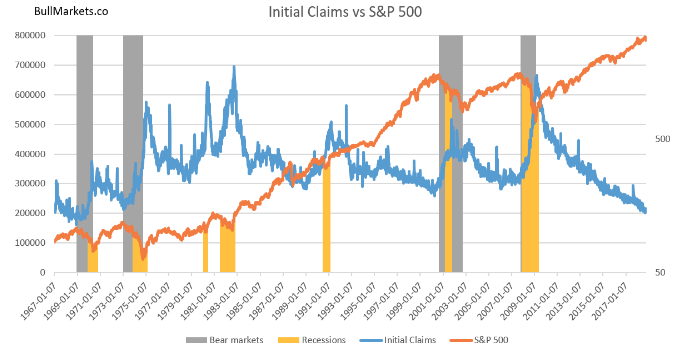
Weekly jobless claims have very much coincided with the JOLTS report showing record level job openings. It is easier than ever for the average worker to find a job in America.
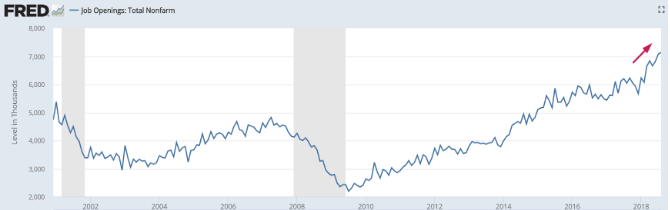
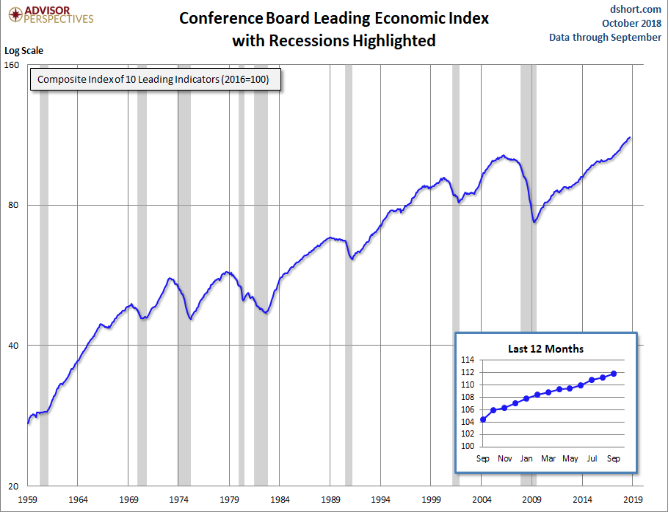
Taken together, the JOLTS report and weekly jobless claims, the data confirms the medium-long term bullish sign for the stock market and economy. And if these two pieces of economic data weren’t enough, the latest Conference Board Leading Economic Index reading proved favorable for the bulls.
LEI for September increased to 111.8 from 111.2 in August. The Coincident Economic Index (CEI) came in at 104.4, up from 104.3 the previous month.
“The Conference Board LEI for the U.S. increased again in September. Positive gains from most components, except for weekly hours in manufacturing and building permits, contributed to the recent improvement. In the six-month period ending September 2018, the leading economic index increased 2.8 percent (about a 5.6 percent annual rate), much slower than the growth of 4.1 percent (about an 8.4 percent annual rate) over the previous six months. However, the strenghts among the leading indicators remain widespread.
The Conference Board CEI for the U.S., a measure of current economic activity, edged up in September. The coincident economic index rose 1.1 percent (about a 2.1 percent annual rate) between March and September 2018, slightly slower than the growth of 1.3 percent (about a 2.6 percent annual rate) over the previous six months. However, the strengths among the coincident indicators have remained very widespread, with all components advancing over the past six months. The lagging economic index declined in September while the CEI increased. As a result, the coincident-to-lagging ratio is up slightly. Real GDP expanded at a 4.2 percent annual rate in the second quarter, after increasing 2.2 percent (annual rate) in the first quarter. [Full notes in PDF]”
“The US LEI improved further in September, suggesting the US business cycle remains on a strong growth trajectory heading into 2019. However, the LEI’s growth has slowed somewhat in recent months, suggesting the economy may be facing capacity constraints and increasingly tight labor markets,” said Ataman Ozyildirim, Director and Global Research Chair at The Conference Board. “Economic growth could exceed 3.5 percent in the second half of 2018, but, unless the momentum in housing, orders and stock prices accelerates, that pace is unlikely to be sustained in 2019.”
Investors would be wise to expect the final trading day of the week to be just as volatile as the previous weekly trading sessions. Despite all the back and forth action this week, the S&P 500 is very little changed from where it began the week, this even as the 10yr. Treasury yield has mildly retreating from multi-year highs. With that said and if you’re an investor/trader looking at the current market angst as an opportunity, here are some stocks CNBC’s Jim Cramer believes one can start nibbling.
“In a sell-off during earnings season, you can’t have a lot of guesswork. You want to be sure you’re buying companies that you absolutely know are doing well,” the “Mad Money” host said. “That’s what’s so great about sell-offs in the reporting period: you’ve got the perfect shopping list because the companies have just told you exactly how they’re doing.”

Cramer’s list is rather simple and as follows:
- United Continental
- Citigroup
- UnitedHealth Group
- PepsiCo.
Cramer isn’t the only one who thinks it’s time for investors to begin nibbling on stocks. A heavy round of technical selling combined with an earnings-related pause in corporate stock buybacks is contributing to the stock market’s October selloff, said Dubravko Lakos-Bujasanalysts at JPMorgan.
“With the largest one-way buyer returning in size to the market post earnings, we expect liquidity to improve and equities to move higher,” wrote equity strategists led by Dubravko Lakos-Bujas, in a Thursday note, referring to buybacks.
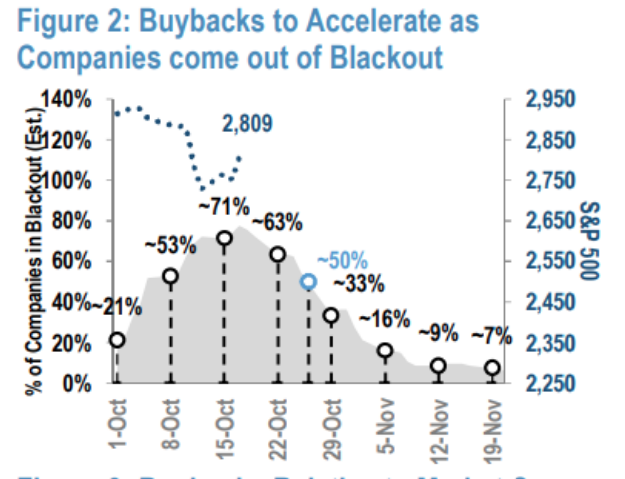
“We expected the growing gap between announced and executed buybacks to converge slowly into year-end; however, the latest selloff likely hastens the process as corporates should accelerate share repurchases post earnings. We believe companies best positioned to take advantage of the selloff are those with active buyback programs and coming out of the blackout period. As a reminder, we expected buyback activity for S&P 500 companies to be ~$800 billion this year. This estimate is likely to be conservative given better than expected earnings (25% vs. expectation of 22%), market volatility, and still elevated overseas cash of ~$1.1t – we now expect buybacks to reach $900-1,000b this year.”
Equity market pullbacks are normal and should be expected after a prolonged period of price appreciation. The fundamental economic backdrop, regardless of media-streaming fears and concerns, remains strong and with growth expected to continue through year’s-end.


