U.S. equities finished higher Thursday, as the S&P 500 extended its winning streak to a fourth straight session and with technology stocks showing improved performance. The Dow Jones Industrial Average advanced 147.07 points, or 0.6%, to end at 26,145.99, its first close above 26,000 this month. The S&P 500 rose 15.26 points, or 0.5%, to 2,904.18 and the Nasdaq Composite Index clawed back 59.48 points to finish at 8,013.71.
Equities were in favor yesterday and look to finish out the week with strong gains on Friday. Renewed investor optimism comes on the heels of The Wall Street Journal that reported Trump officials sense more flexibility among Chinese officials to negotiate and find common ground in order to thwart a trade war.
“Laban Yu, an equity analyst at Jeffries, predicted that China will accept the U.S. offer for negotiations but doesn’t expect Beijing will make any significant concessions. On the other hand, he believes Trump is under quite a bit of pressure to ease up on trade. “With poll numbers sagging, we believe Trump may settle for face saving ‘concessions’. This offer to talk before additional tariffs are implemented may reveal a weakened hand, in our view,” he said in a note.”
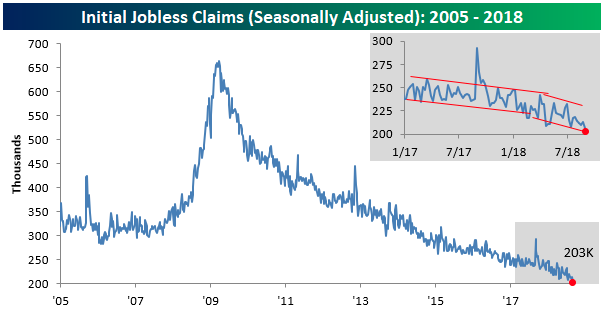
In addition to dampening fears over a trade war, the U.S. economic data continues to come in more favorably with the labor market seemingly improving each and every week through the summer months. Thursday it was reported that initial jobless claims fell slightly in the latest week, coming in at a 49-year low. This week’s report came in at 204K versus estimates for a reading of 210K and was the lowest weekly print since December 1969. According to Bespoke Investment Group, weekly claims have now been at or below 300K for a record 184 straight weeks, at or below 250K for 49 straight weeks (longest streak since January 1970), and at or below 225K for ten straight weeks (longest streak since 1969).
Additional economic data released Thursday showed that the consumer price index rose by 0.2% in August. Economists polled by MarketWatch had predicted a 0.3% gain. The increase in the cost of living over the past 12 months, however, slowed to 2.7% from a six-year high of 2.9%, the government said Thursday. It was the first drop in the yearly rate since last fall. The yearly increase in the core rate also slowed to 2.2% from 2.4 percent.
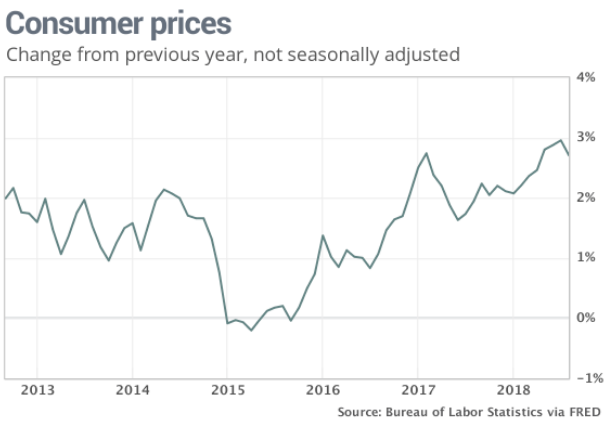
Gas and rent accounted for most of the increase in the CPI last month. The cost of airfare and used vehicles also rose. Consumers paid less for medical care, telecommunications and clothing. The increase in inflation over the past year has mostly offset rising wages. After adjusting for inflation, hourly wages rose just 0.1% in August. They are up just 0.2% in the past year.
With both PPI and CPI coming in lighter than expected for the month of August, the only gauge of consumer and business health remaining to be reported on Friday is monthly retail sales. Economists polled by MarketWatch expect retail sales to have grown by .3% in August, slowing from the previous monthly report.
The health of the consumer can be attributed to several factors in recent years and more recently due to the beneficial impact from tax reform enacted in late 2017. More importantly than tax reform is the deleveraging of household debt since the financial crisis and the newfound fiscal responsibility from households. Ellen Zentner, chief U.S. economist at Morgan Stanley believes that we ought to think about the current expansion as beginning in 2014, when households began taking on more debt, rather than in 2009 when the recession officially ended.
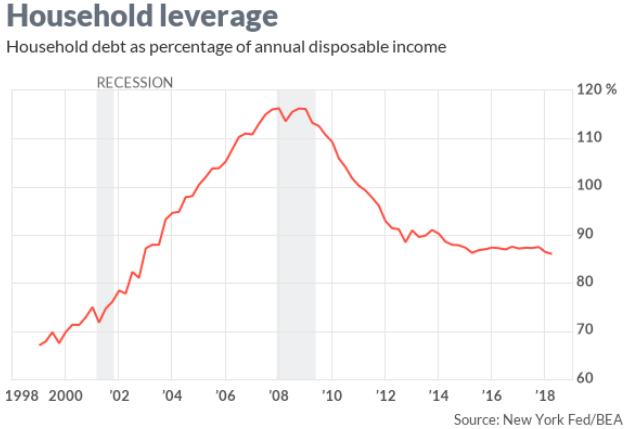
Between 2008 and 2014, households shed about $1.5 trillion in debt, bringing their balance sheets back into line. Since then, households have taken on some additional debt, but their income has grown faster. The debt-to-income ratio today is the lowest since 2002.
What investors hear all-too often is that household debt is ever climbing. While this is true, the amount of debt isn’t the main metric that investors should concern themselves with, but rather the ability for households to pay down debt. Additionally, investors need to consider how rising rates impact household debt. Zentner said the household sector is well positioned to weather higher interest rates.
At the height of the bubble, much of household debt was tied to a variable-interest rate. Many of the worst mortgages of the time had low teaser rates that ballooned into unaffordable payments just as home prices fell, shutting off the possibility of refinancing. It was the ensuing defaults that brought down the big banks. As households deleveraged after the recession, they also locked in record low interest rates.
“Only 7% of household debt is subject to variable rate,” Zentner said. About 90% of mortgage debt is fixed interest, and the effective rate for all mortgages is now just 3.8%.
The household sector has some immunity to tighter monetary policy, giving the economy a lot of resiliency as the Fed raises interest rates. In fact, Zentner said, U.S. households as a whole may actually benefit from higher rates because the extra interest they earn on their savings could exceed the extra interest they’ll pay.”
Taking a look at the S&P 500 and prior to the release of the monthly retail sales at 8:30 a.m. EST Friday, we want to review the expected weekly move for the S&P 500. Coming into the trading week, the weekly expected move was $42 with the S&P 500 starting point on Monday of 2,871.
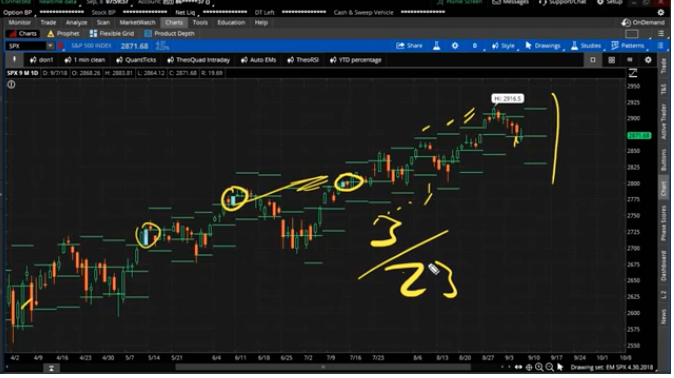
Given where the S&P 500 currently stands at 2,904, the benchmark index has moved roughly $33 week-to-date. Of the last 23 weeks, the S&P 500 has breached the weekly expected move only 3 times, up or down and as depicted in the graphic above. As such, if the S&P 500 is to stay within the weekly expected range or hit it as it did in the previous week that would insist upon the index to rise on Friday with a target of 2,913 to end the week. We’ll see how the trend of the weekly move entices investors once Wall Street is open for trading.
With equities back in favor this week and after a downtrodden week to kick-off September trading, one would think that investor sentiment had risen sharply. A quick look at the most recent AAII Investor Sentiment Survey depicts quite the opposite.
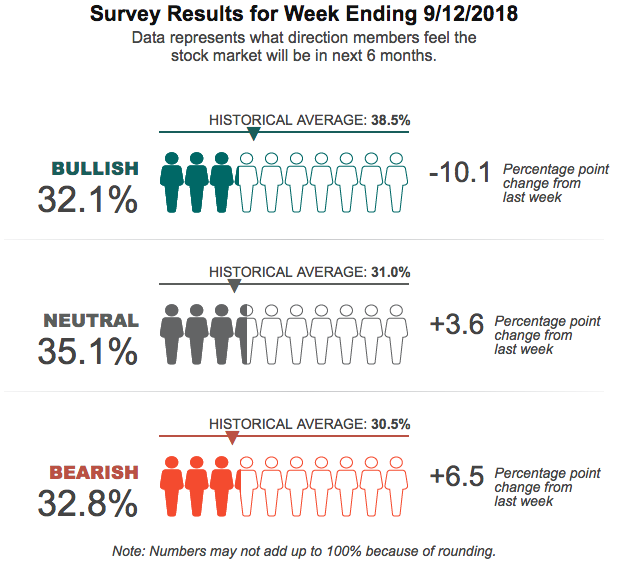
Optimism among individual investors about the direction of the market fell to its lowest level in 6 weeks, as depicted by the graphic above. The latest AAII Sentiment Survey also shows a strong rise in pessimism and a rebound in neutral sentiment.
Bullish sentiment, expectations that stock prices will rise over the next six months, plunged 10.1 percentage points to 32.1 percent. The drop ends a streak of three consecutive weeks with optimism above its historical average of 38.5 percent. Bullish sentiment was last lower on August 1, 2018 (29.1%).
Tariffs and the possibility of an escalating trade war remain front and center on the minds of many individual investors. Also influencing sentiment are Washington politics (including President Trump), economic growth, interest rates (including monetary policy), valuations and corporate profits.
Posing in contrast to the AAII survey results, which denote a more pessimistic investor sentiment, Mark Hulbert, ‘s contrarian sentiment indicator suggests near-term market struggles may persist.
“The mood on Wall Street has shifted from fear to greed. And, like clockwork, contrarian-minded investors have shifted their short-term outlook in precisely the opposite direction, from positive to negative.”
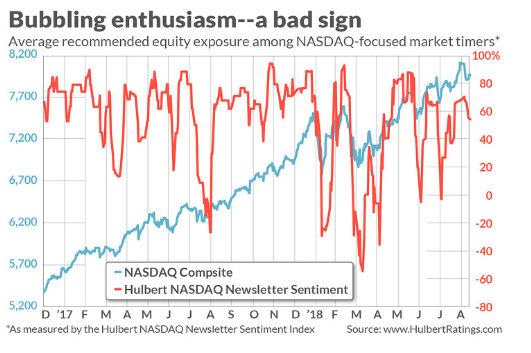
Hubert’s sentiment indicator considers the average recommended equity exposure among a subset of short-term market timers who focus on the Nasdaq market (as measured by the Hulbert Nasdaq Newsletter Sentiment Index, or HNNSI). Since the Nasdaq responds especially quickly to changes in investor mood, and because those timers are themselves quick to shift their recommended exposure levels, the HNNSI is his most sensitive barometer of investor sentiment in the equity market.
The HNNSI average currently stands at 64.9%, after retracing somewhat from 70.1 percent. On the occasion of Hubert’s early-August column on stock market sentiment, in contrast, this average stood at minus 2.7 percent. This represents a significant shift towards irrational exuberance. Additionally, it may prove of interest to note that the recent 70.1% reading is almost identical to the HNNSI level that prevailed on the day of the stock market’s late January high, when the HNNSI closed at 70.6 percent. The Nasdaq Composite fell almost 10% over the two weeks following its January high, and the S&P 500 lost roughly 12% post the January high.
As is always the case with short-term market sentiment, caveats apply. Contrarian analysis doesn’t always work, and it’s generally only a short-term “tool”. Market-timer sentiment tells us very little about the stock market’s more probable trend over the intermediate or longer terms. In other words, take it with the grain of salt folks! Focus on the economy and corporate earnings as both guide markets longer-term.


