

Research Report Excerpt #1
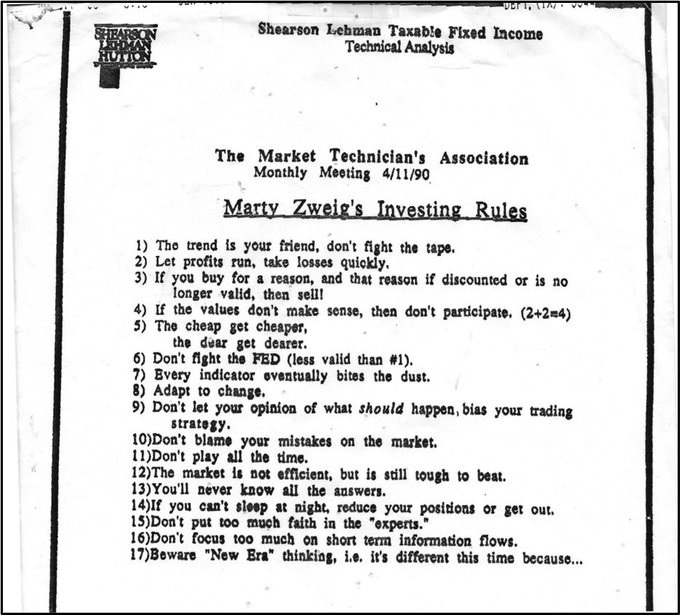
THE FED IS DRIVING THE MARKET, and it demands the market to stay put until further notice. With the aforementioned sentiment, which is hard to argue against, as it was further demonstrated most recently during the Fed chairman’s press conference this past week, it is ideal for investors to accept this as a basic truth. It’s as simple as the most popularized of Wall Street colloquialisms fashioned by one of the greatest market “quants” of all-time, Marty Zweig! (Rule #6)
Research Report Excerpt #2
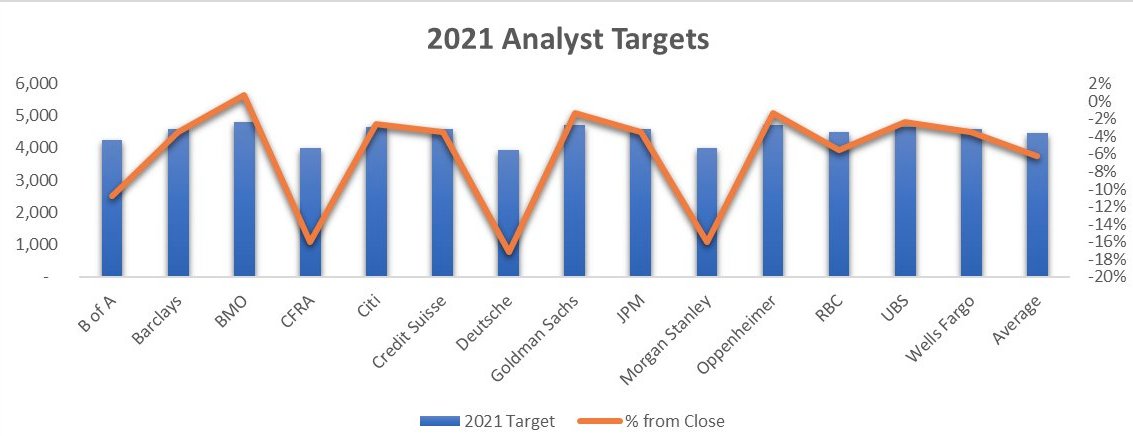
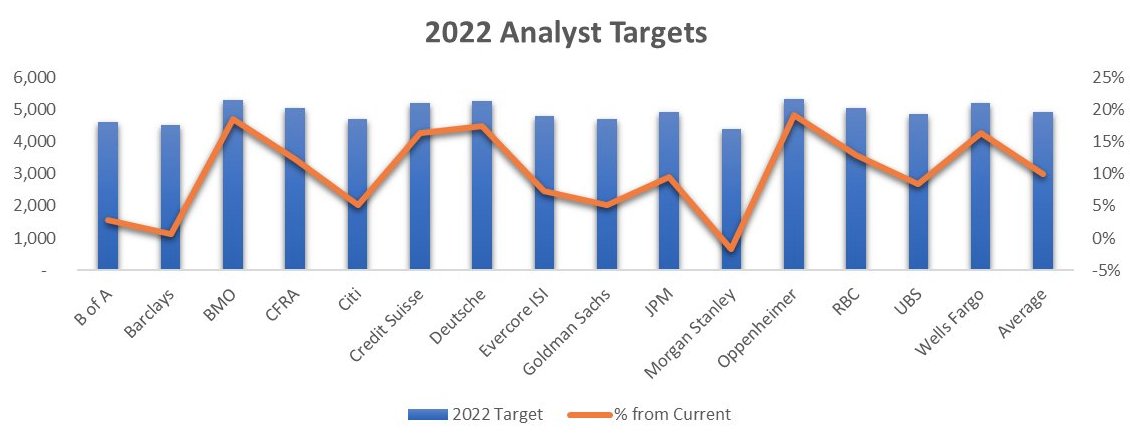
In 2021, the average analyst price target was shy of the S&P 500’s annual return by almost 8% (chart above, righ-hand bar). It’s even worse in 2022, as of the June lows. At the June lows, the average strategists’ S&P 500 price target was roughly 10% too high. Aren’t they awesome (sarcasm). Again, who could blame them for their errand price targets given this is quite literally the norm for Wall Street strategists. They normally undershoot or overshoot the S&P 500’s actual annual return. What were your expectations of them; maybe that is the better question here?
With that in mind, a handful of strategists have already communicated to clients where they expect the S&P 500 to head in 2023. Here’s a roundup:
- Capital Economics: 3,800 (as of 10/7/22)
- Morgan Stanley: 3,900*, $219 EPS (as of 10/3/22) *This is a June 2023 target.
- Citi: 3,900, $215 EPS (as of 10/3/22 via Investing.com)
- HSBC: 4,000, $225 EPS (as of 10/4/22)
- Goldman Sachs: 4,000, $234 EPS (as of 10/4/22)
- Credit Suisse: 4,050, $230 EPS (as of 10/3/22)
- UBS: 4,200, $235 EPS (as of 10/3/22)
Research Report Excerpt #3
So let’s see where the ERP is as of Friday’s close, and progress forward to consider the potential downside from here. We perform this exercise as investors for modeling purposes and capital allocation plans. The good news is that bond yields are lower than when we last calculated the ERP. The not so good news is that so are 2022 EPS estimates. Also, the last time we calculated the ERP the S&P 500 was at 3,752 and as of Friday’s close it really hasn’t moved much (3,770) since the October 21st calculation.

At a 4.16% 10-yr. Treasury yield
S&P 500 ’22 EPS model of $222 from a former $223
Earnings/Price (3,770) = ~5.8%
At 5.8%, subtract 10-yr. yield of ~4.16% to calculate the Equity Risk Premium at/= 1.64%, well below the risk-free rate, and well below the average ERP since 1977 of 2.5%
On October 21st, the ERP was 1.85%, and it is now 1.64%, a new 2022-low. Investors are literally taking more risk today than just 3 weeks ago, or they are anticipating a new ERP regime ahead.
Research Report Excerpt #4
- Here’s a possible trade to boost the portfolio performance:
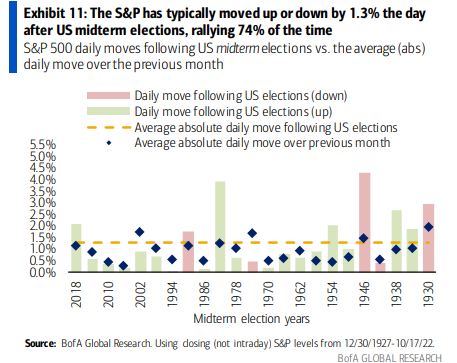
- The S&P 500 has typically moved up or down by 1.3% the day after U.S. midterm elections, rallying 74% of the time.
- Midterm elections take place November 8th this go around.
Research Report Excerpt #5
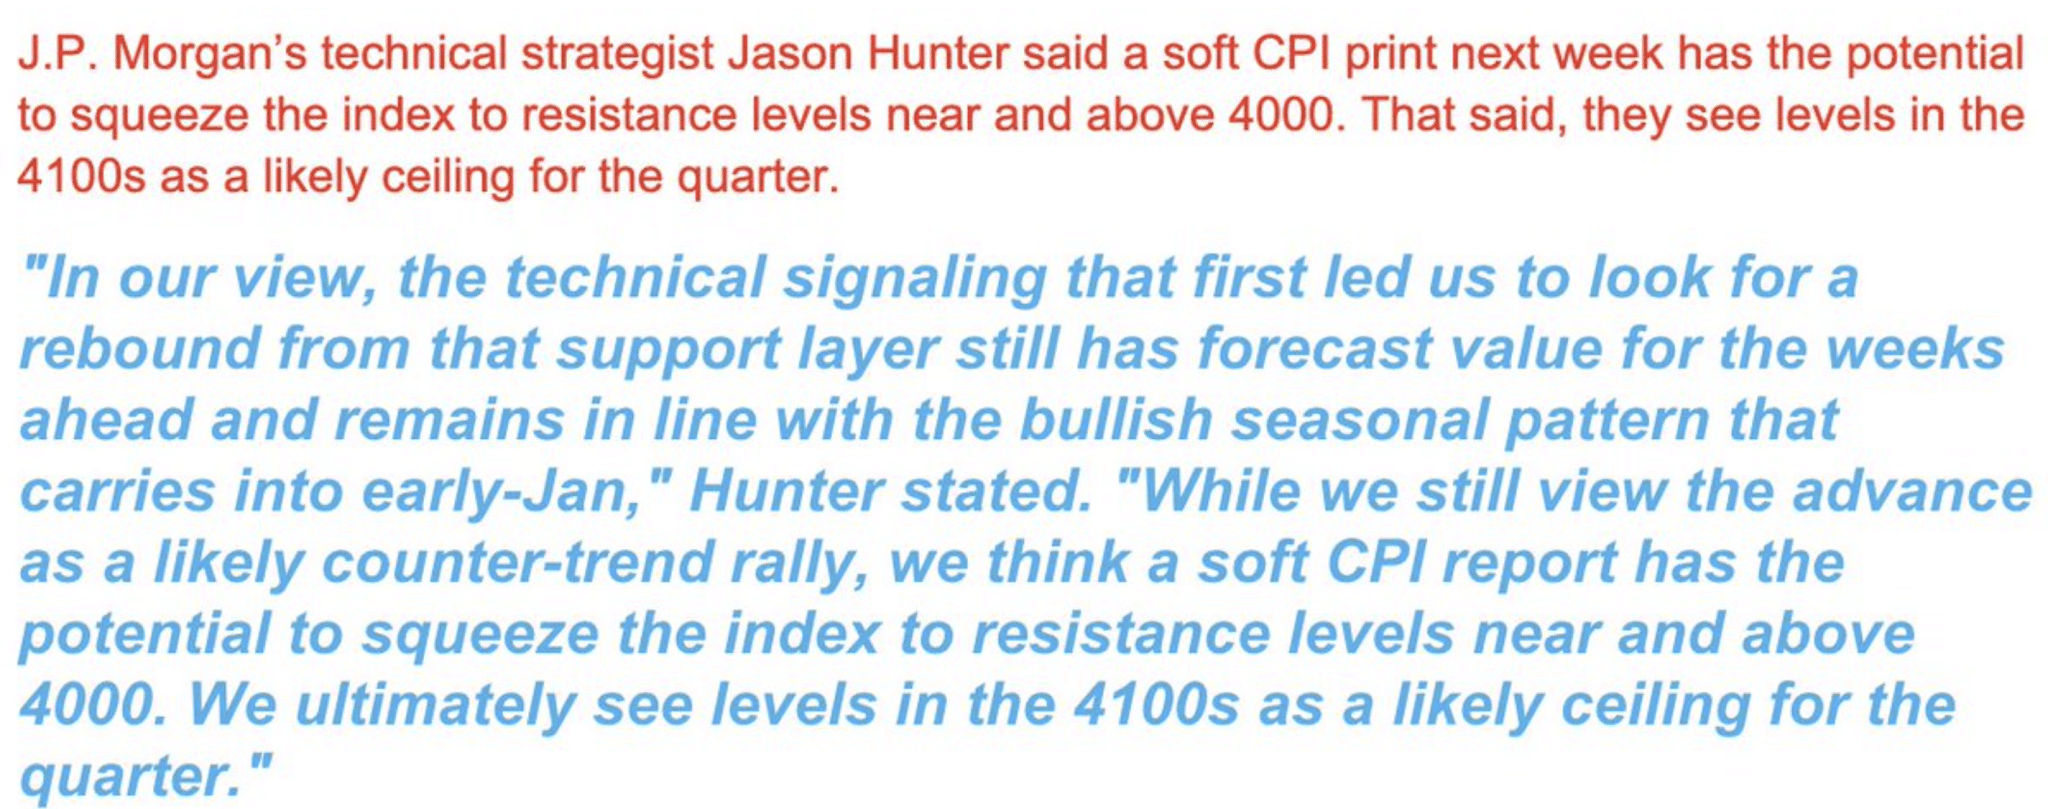
If over the next 2-week period, markets don’t make lower-lows, I would likely become more aggressive with allocations, increasing market exposure to align with the post-Midterm election historical market performance. And what if there is actually a positive CPI surprise favoring the bulls this coming Thursday? J.P. Morgan’s market technician offers his thoughts as follows:
Research Report Excerpt #6
Since 1948, the U.S. has experienced 12 recessions. The red numbers in the chart below (Leuthold Group) illustrate how much the stock market “discounted” each recession, otherwise known as priced ahead of time. Specifically, the numbers show the percent decline from the S&P 500’s monthly closing-cycle high to the month “before” the beginning of each recession.
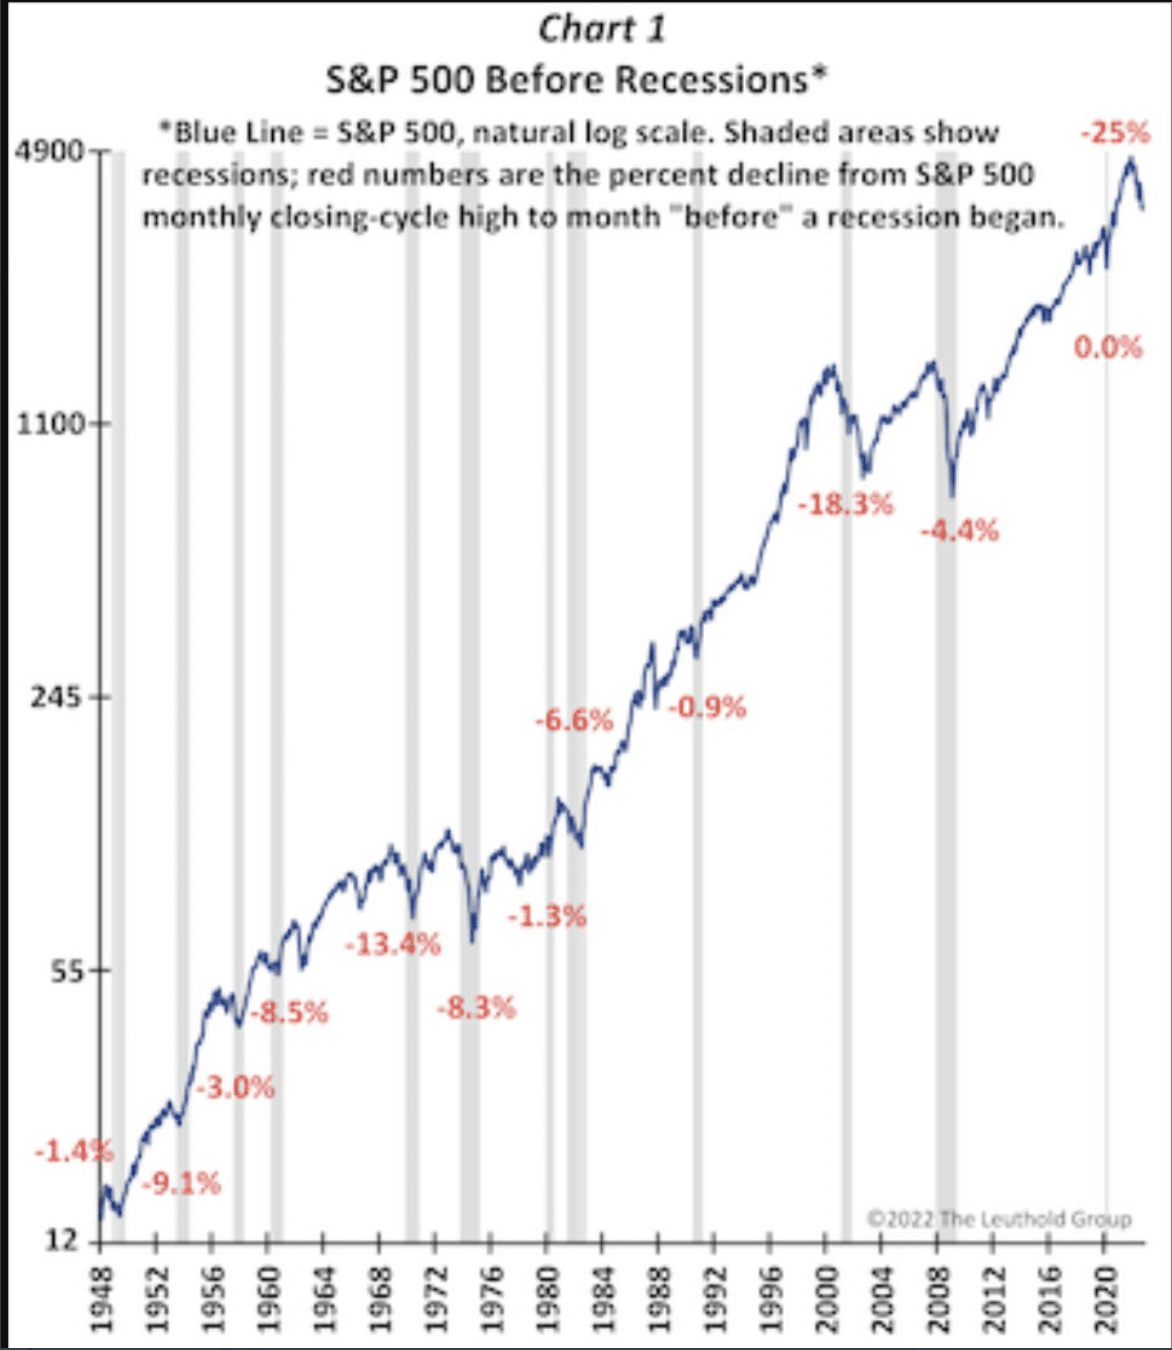
For example, in the 1957 experience, the stock market had lost only 3% by the time the recession started. In contrast, prior to the 2001 recession, the stock market was down 18.3% already.
Research Report Excerpt #7
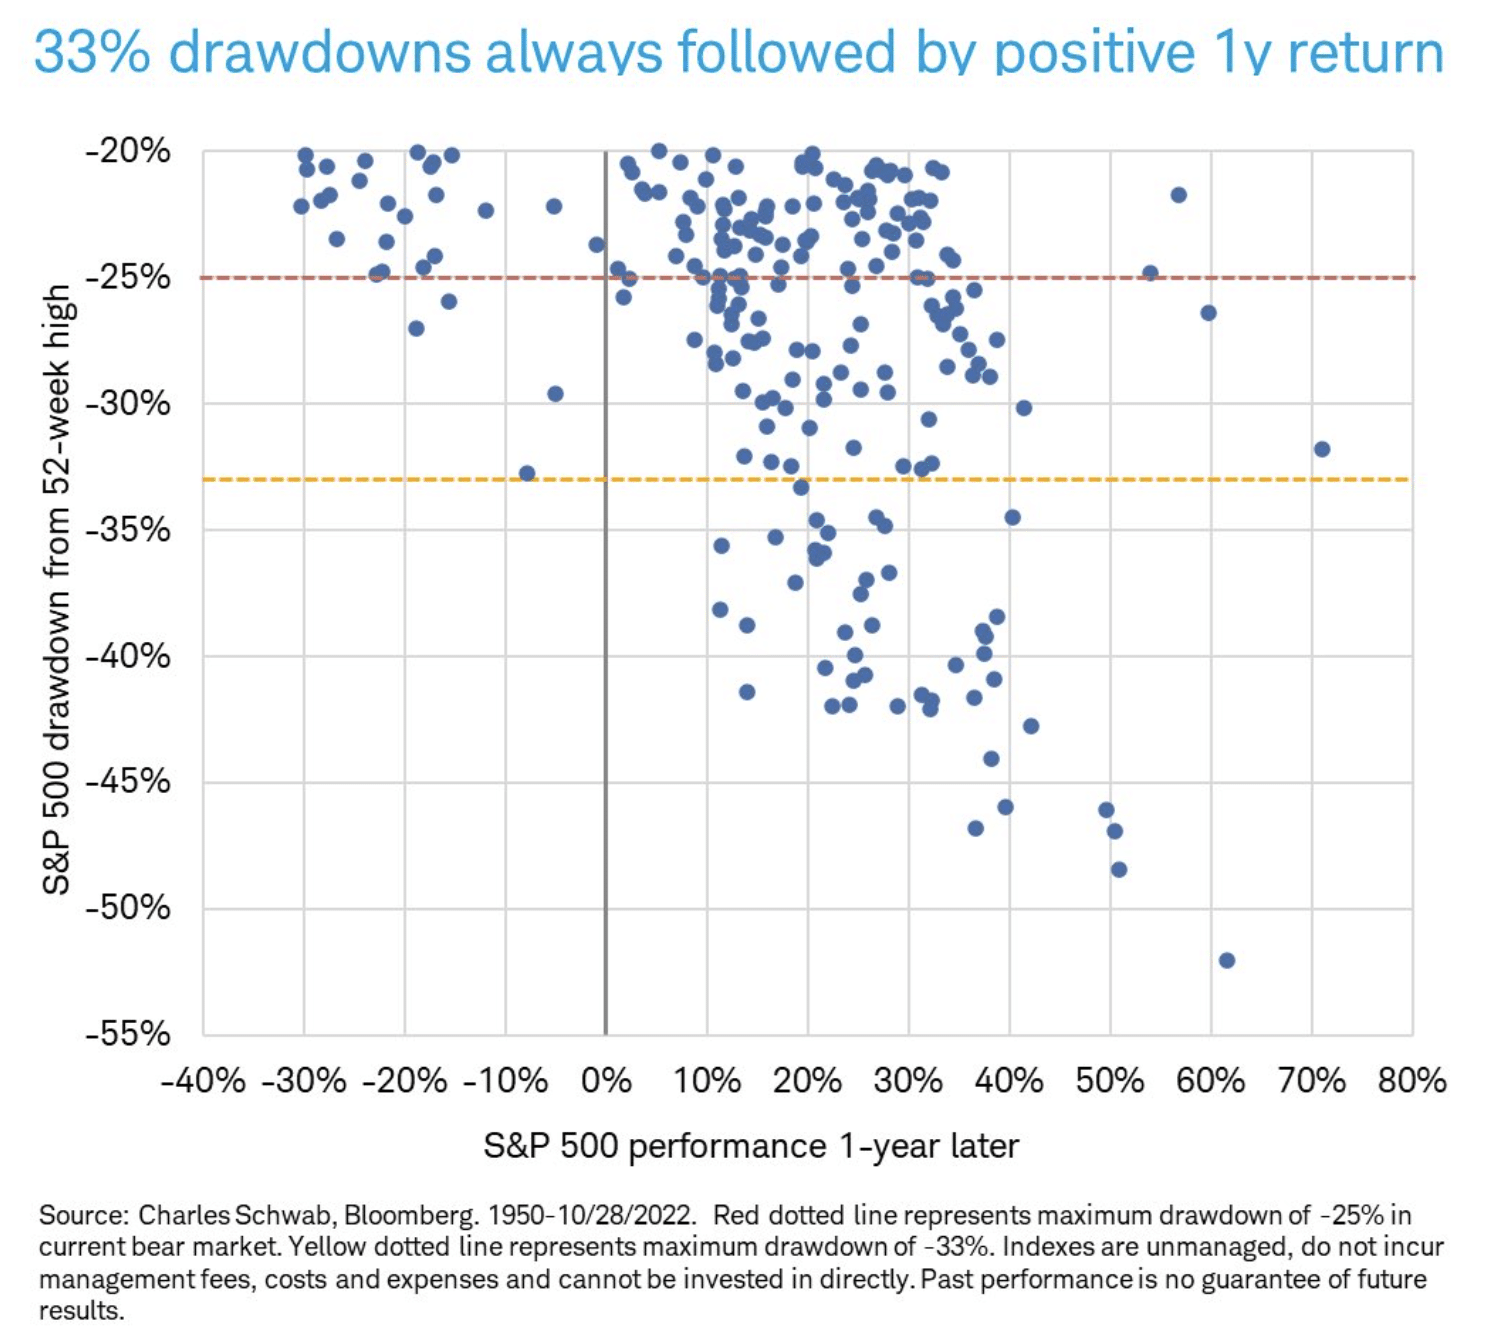
With the S&P 500 actually falling -28% from its all-time high, should the S&P 500 fall another -5% or -33% in total from the all-time high, did you know that the market has never been lower a year later?
Research Report Excerpt #8
Since this past week’s meeting and this hawkish rhetoric surrounding the potential terminal FFR to continue higher, the market has effectively priced a higher terminal FFR.
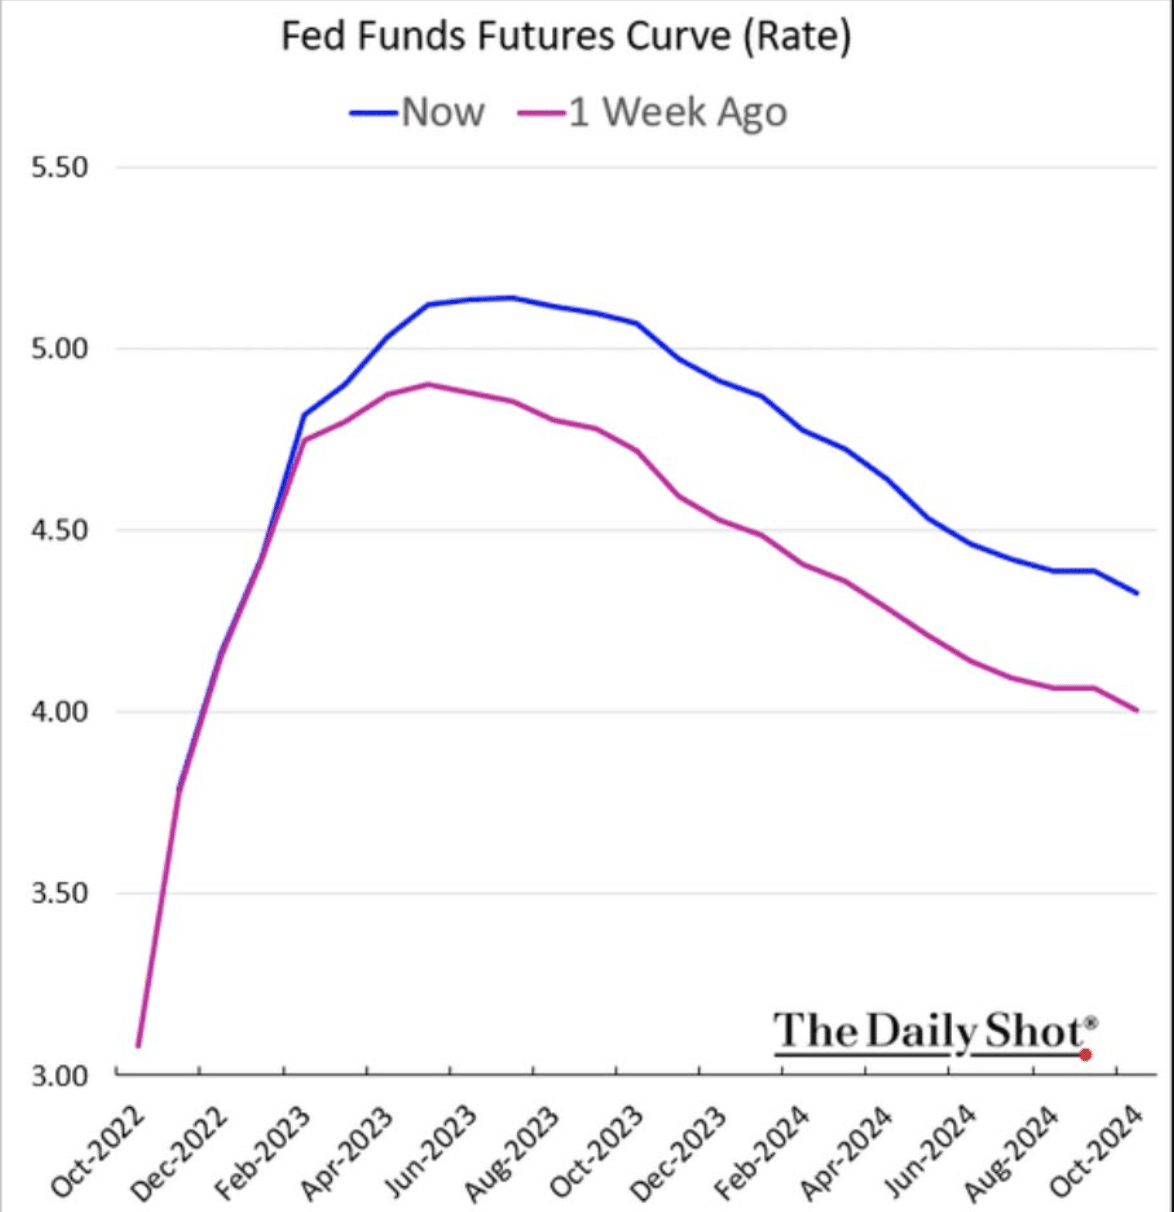
Fed communication (via FOMC statement and press conference) of slower speed and higher destination lifted market pricing for the terminal FFR. The terminal FFR is now seen at 5.2%, about 60bps higher than the September Fed dot plot assumed.
Research Report Excerpt #9
In August, I offered the following tweet that suggests the Fed is highly likely to raise its official inflation target from 2% to upwards of 4 percent in the future.
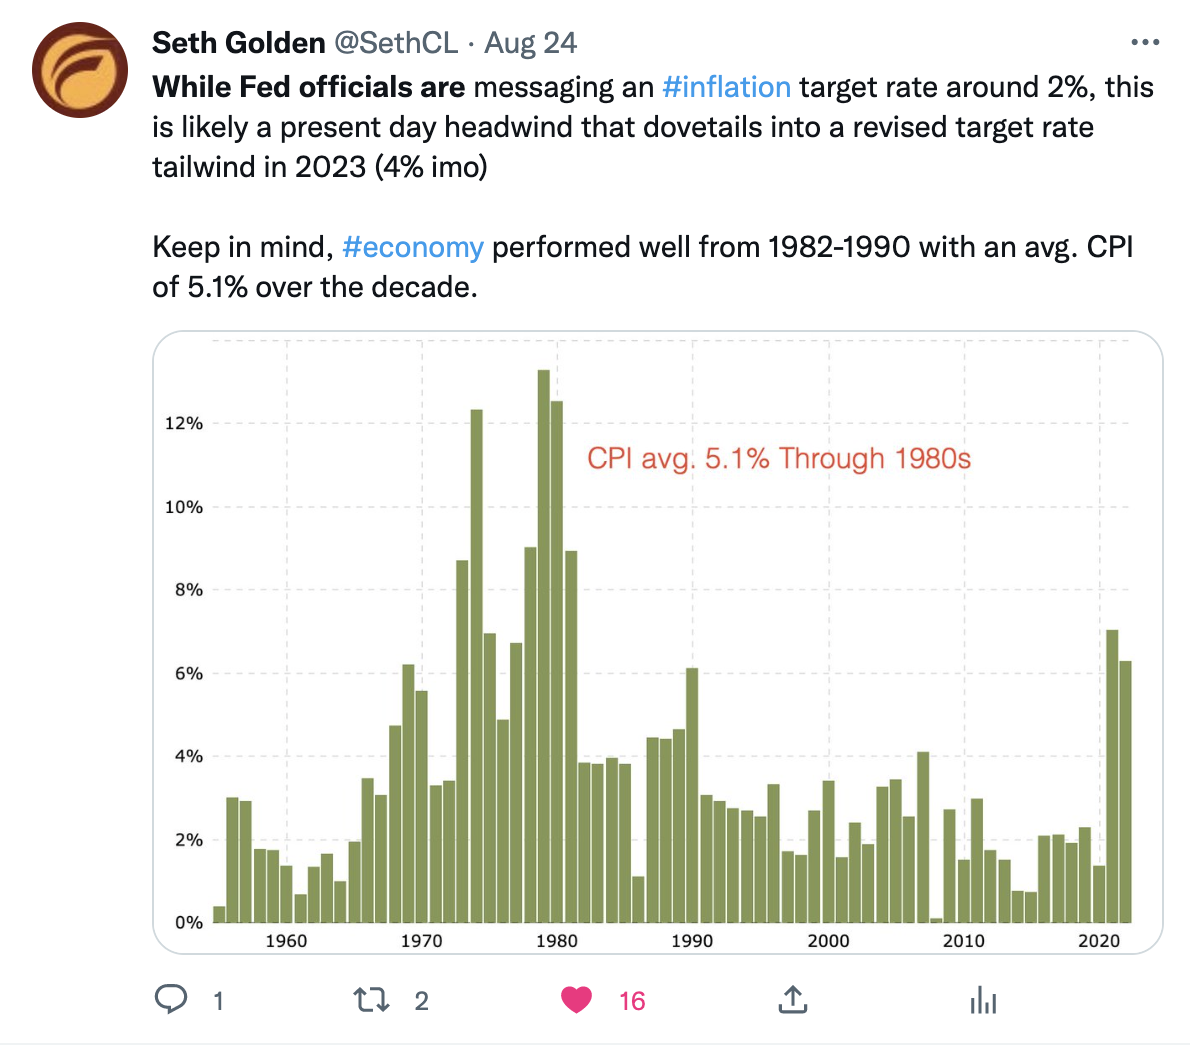
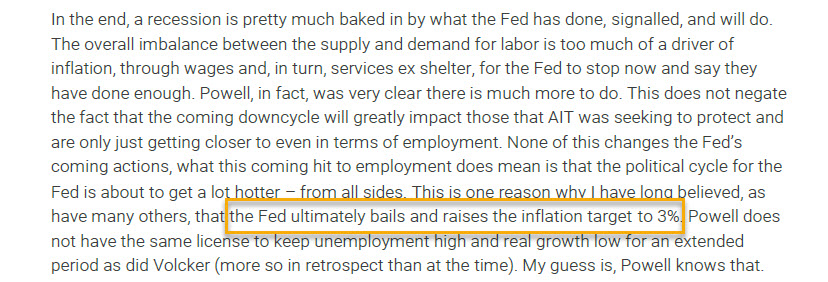
Just 2 weeks ago, Bank of America’s Michael Hartnett suggested the Fed would likely raise their inflation target rate from 2% to 3% sometime in 2023. This past week, we heard a very similar sentiment offered by TS Lombard’s Steven Blitz: “the Fed ultimately bails and raises the inflation target to 3%.” (see Blitz’ notes below)
Wall Street analysts are quickly coming around to my understandings and deductive reasoning. Remember that the Fed’s inflation target was 2%, from the Great Financial Crisis up until 2019. Then it moderated to an “average 2%” target range in 2019, and that was before 40-year high inflation was found in 2022. It’s only logical that the Fed would give itself more breathing room with the inflation target rate, given the level for which it would have to disinflate over the coming years. In other words, we don’t believe it is unreasonable, given the Fed’s flexible toolbox, to meet disinflation halfway  , and apparently other analysts are drawing the same conclusion.


