
Welcome to another trading week!! In appreciation of all of our Basic Membership level participants and daily readers of finomgroup.com content, we offer the following excerpts from our Weekly Research Report. Our weekly Report is extremely detailed and has proven to help guide investors and traders during all types of market conditions with thoughtful insights and analysis, graphs, studies, and historical data/analogues. We encourage our readers to upgrade to our Contributor Membership level ($7.99 monthly, cancel any time) to receive our Weekly Research Report and State of the Market Videos and take advantage of this ongoing promotional event today! Have a great trading week, be in touch, and take a look at some of the materials in this weekend’s published Research Report!
Research Report Excerpts #1
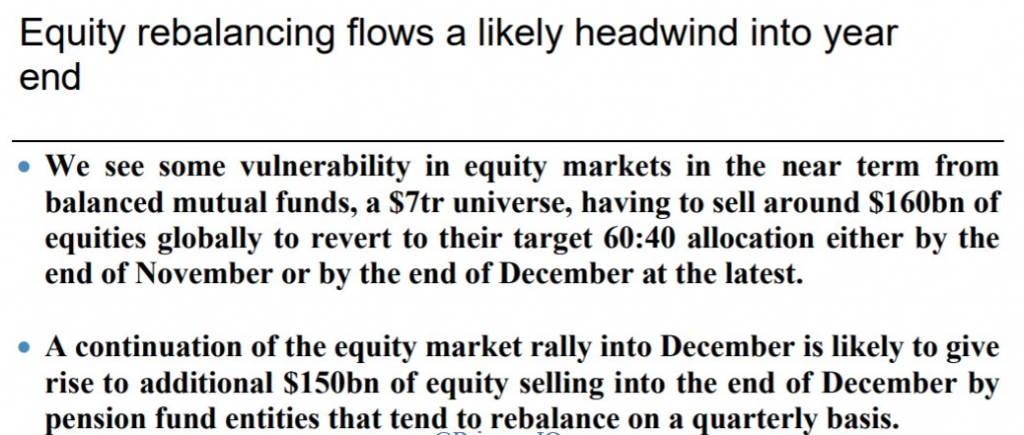
Normal market operations like quarterly rebalancing brought markets back from the depths of despair back in March, but given present valuations such rebalancing operations may prove a headwind by year-end. As heralded by J.P. Morgan, rebalancing flows have flipped for pension funds since the Q2 period from bullish to bearish…
Research Report Excerpts #2
There are certain market trends investors have learned not to fight and monetary policy trends rank right at the top of the list of battles not to engage. Pulling out and looking at things from a 30,000 ft. view we see a trend that is your friend and one that should not be found an enemy. (Chart of global M2 supply)

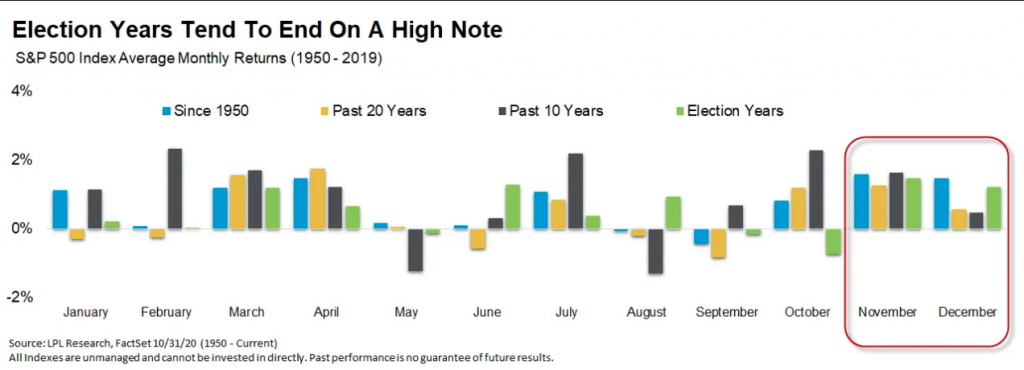
So as we complete the month of November, we recognize that while it went well beyond the expected returns, based on the historic data, there is still a trend of seasonality that favors more equity market upside in December.
Research Report Excerpts #3
Breaking down the week by day is interesting. Based on this, hold off on buying any stocks. Monday after Black Friday has been a bad day for stocks; it has averaged a loss of 0.28% for the S&P 500 since 1990, with only 40% of the returns positive. In fact, seven of the last eight years, the Monday after Black Friday has been negative. The only day that has been especially bullish has been Friday of next week, which has averaged a gain of 0.62% with 80% of the returns positive.

Research Report Excerpts #4
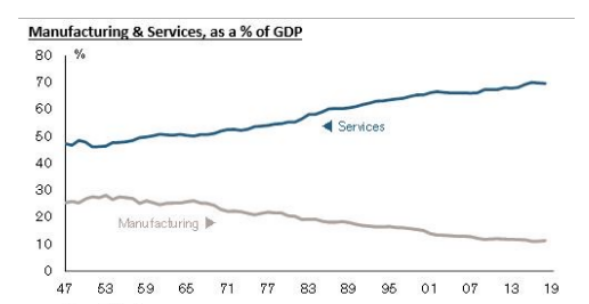
This was always to be expected, as manufacturing was not going to grow to the sky in the United States and has been on decline for roughly 40 years. The chart below identifies the regime shift from a manufacturing-based economy to a services-based economy, which began in the 1970s.
The Citi Economic Surprise Index is littered with lagging economic data, making it an inconsistent investment tool. Simply by looking at the previous chart positioned above, the index had been in negative territory since September of 2018, yet, the market has achieved new highs since that date. As such, we can clearly validate that it is less an investment tool than it is a greater tool for representing the lagging economic data surprises. And why do we say lagging? “X” marks the data that is old-news or backward looking.
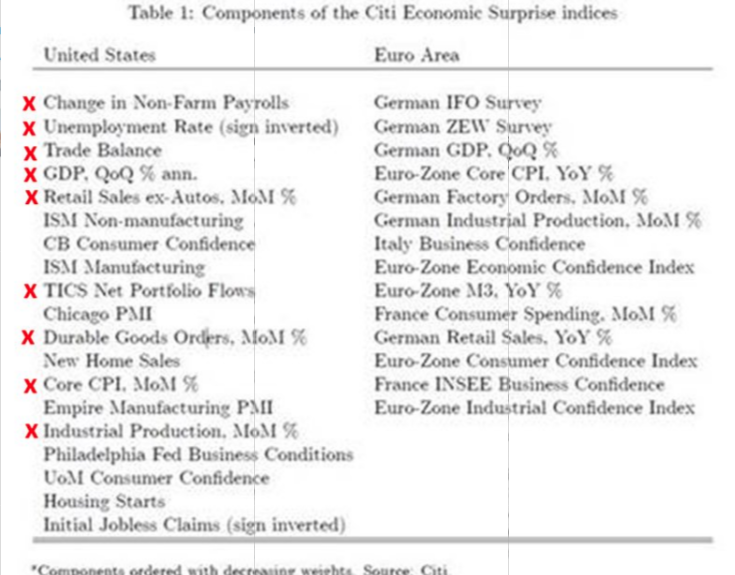
Positive surprises in data are important, but more so when they come from leading economic data, rather than lagging data. Unfortunately, even when we look at the leading economic data points within the Citi Economic Surprise Index, it doesn’t fit with the turn-of-the-century economy. The leading economic data is still largely PMI data.
Research Report Excerpts #5
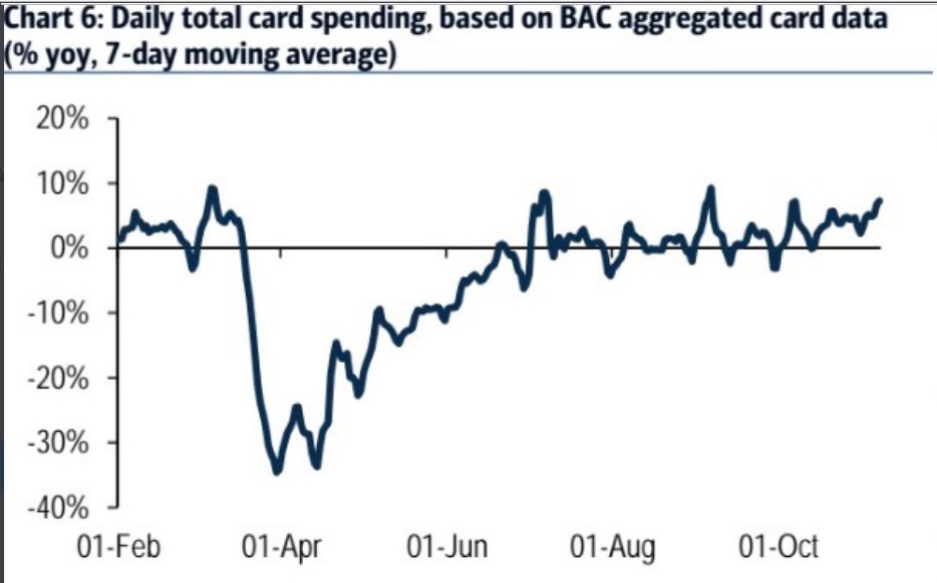
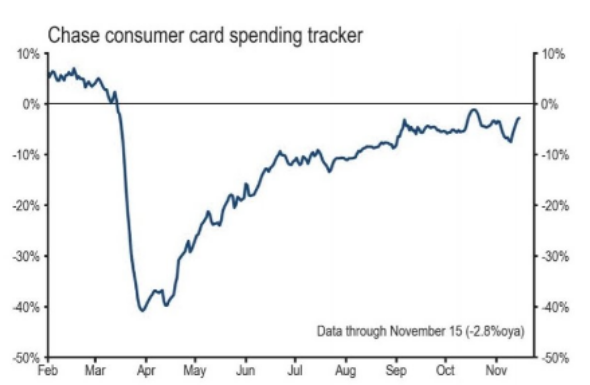
The most recent Bank of America and Chase card spending data showed week-over-week improvements. Remember, if focusing on high frequency data such as card spending data, you’re pulling forward time horizons ergo don’t forecast beyond a couple weeks folks.
Research Report Excerpts #6
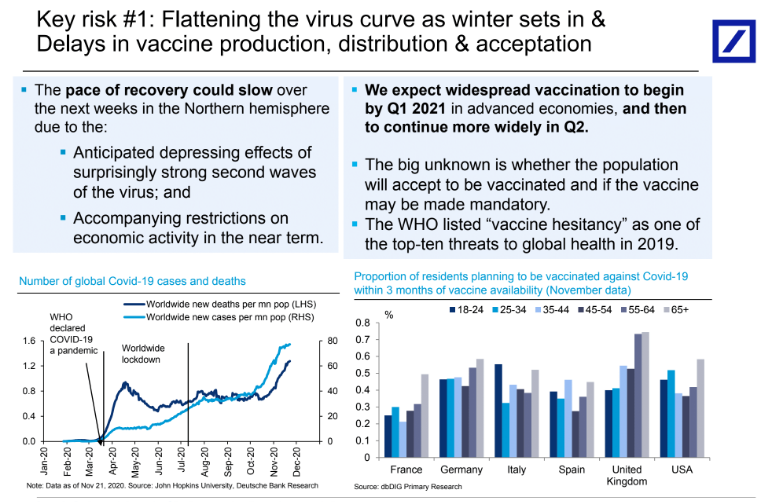
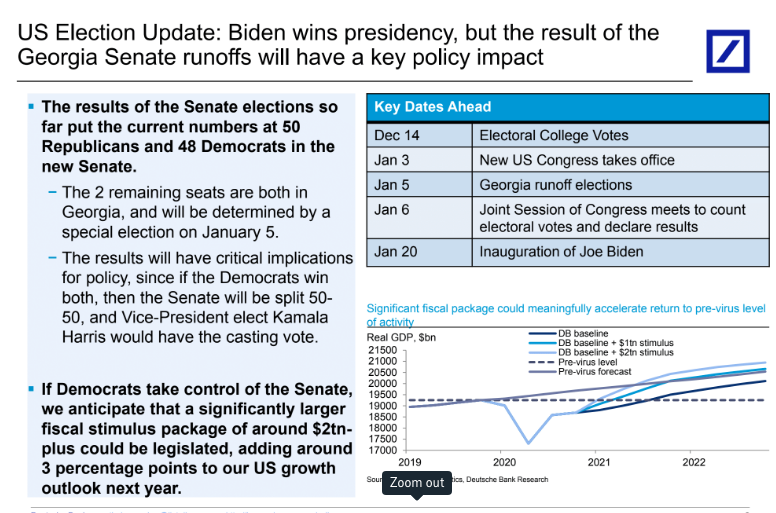
Here are some near-term risks highlighted in the latest Deutsche Bank report:
Research Report Excerpts #7
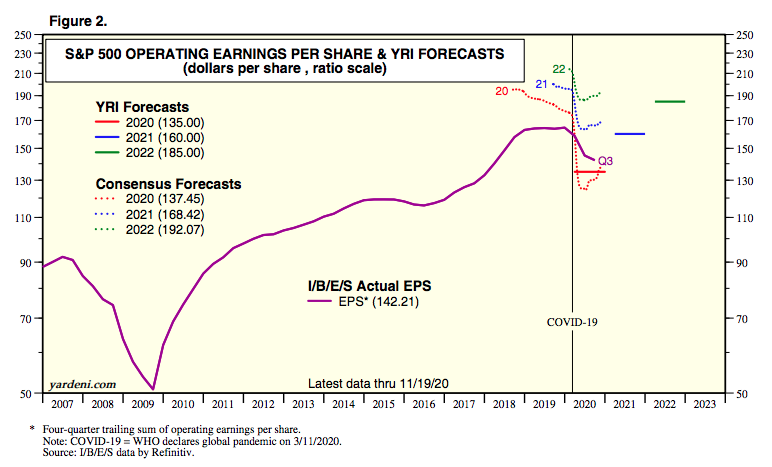
In addition to the positive revisions from Refinitiv, the latest consensus analysts’ estimate for FY2020 EPS has improved from the week ago period. Below is a screenshot from 2 weeks ago:
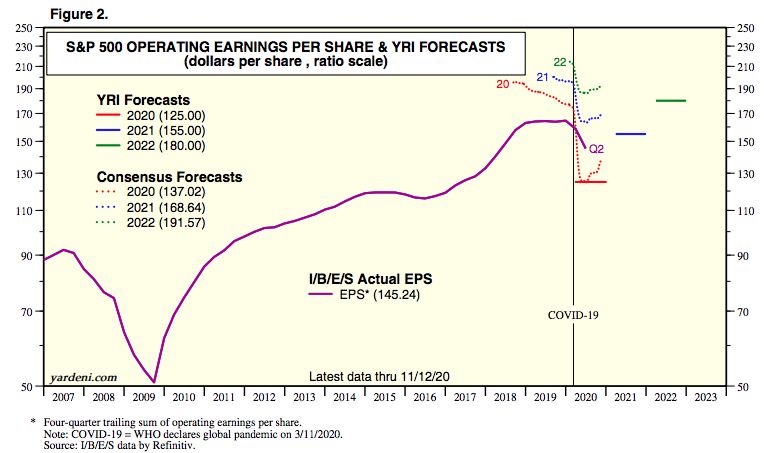
We can discern from analysts’ estimates that they had modeled for FY2020 EPS to come in at $137.02 a share, with roughly $168 in EPS for 2021 and $191 in EPS for 2020. Fast-forward to the present and we can see the positively revised forecast for FY2020 EPS.
Research Report Excerpts #8
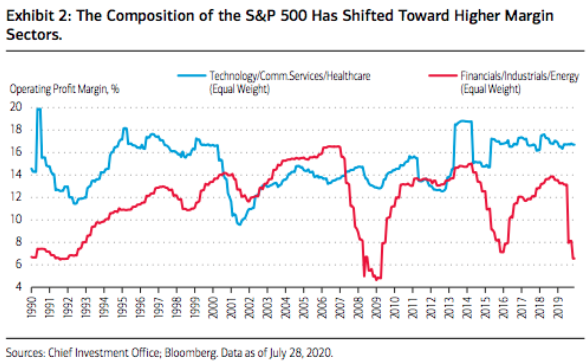
here are other factors which lead me to believe that EPS estimates will prove too low for 2021 when it is all said and done. A shift in the composition of equity indexes has had a major effect on margins. The share of the S&P 500 composed by the Healthcare, Technology and Communication Services sectors has increased over 20 percentage points over the past 10 years and now totals 53 percent. These businesses tend to enjoy higher and more stable margins, in part due to achieving high operational leverage. For example, the net margin of the Technology sector has averaged 15.4% from 2004 through 2019, which is nearly 70% greater than the overall index during that period according to FactSet. Sectors such as Financials and Energy typically have lower or more volatile margins, are fixed-asset intensive, and have seen their collective market share shrink over time. Within this context of elevated profitability, growth and quality, a higher valuation multiple for the S&P 500 is likely justified as well, and something I’ve been pounding the table about since the recession began.
Research Report Excerpts #9
There is no guarantee as to what the markets will do next week. Nonetheless, we can guarantee that if we remain open-minded, disciplined, patient and flexible, all outcomes are likely to be rewarding opportunities. That is the objective I shoot for on a quarterly basis. No matter what comes the way of the Golden Capital Portfolio, it should prove a rewarding opportunity if I stick to my long-term disciplines. One of those disciplines is to do what I call “act locally, think distantly”.
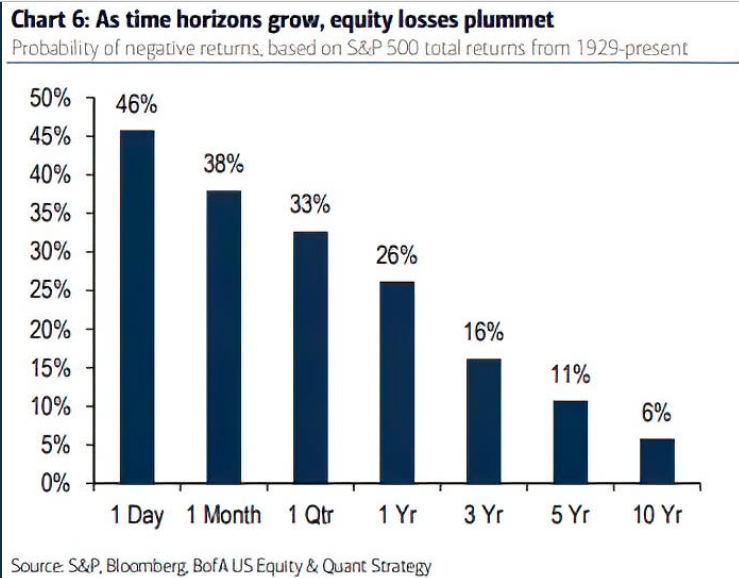
In other words, If I act upon the opportunity at-hand/locally with a longer-term/distant time frame, my ability to achieve my capital return goals increases. Historically, lengthening one’s time horizon has been one approach to reducing losses, which is identified in the chart above from Bank of America.
Research Report Excerpts #10
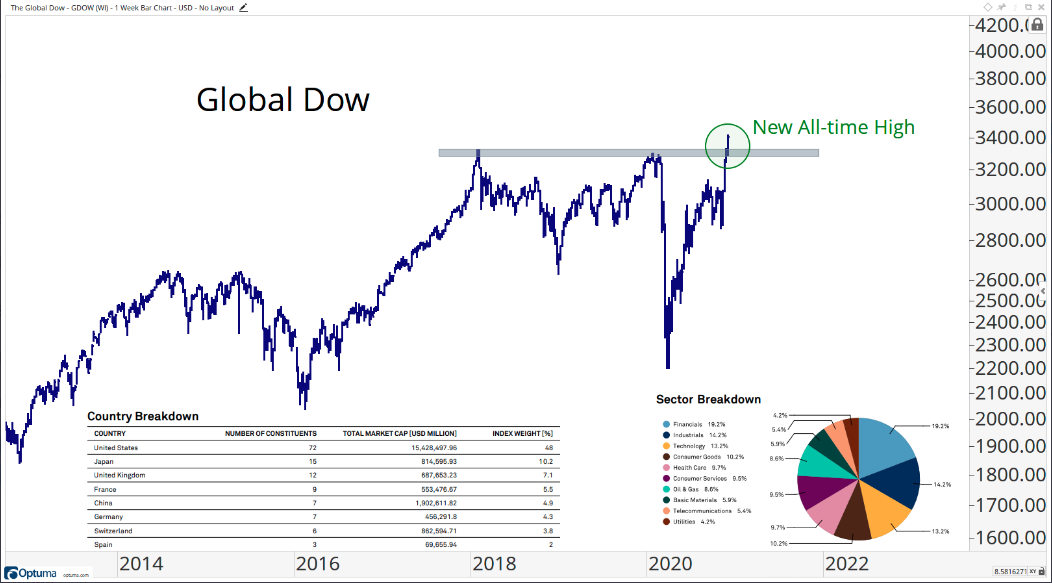
This is an important development. Global stocks have been in a bear market since January 2018. When a breakout like this occurs, anticipate a retest before more upside, but also this affords investors whom have positioned bearish the market to resolve that positioning and align for the probabilities of higher prices in 2021. (All Star Charts)
Thank you for joining us for another trading week and reviewing our weekly “Must Knows”! To receive and review our weekly, full-scale Research Report each Sunday and our State of the Markets weekly video analysis every Thursday, subscribe to our Contributor Membership level at just $7.99 monthly (Cancel any time)! With these two weekly deliveries, you’ll have all the unbiased and fact-driven market and economic data analysis at your fingertips. Don’t make capital allocation decisions based on headlines that brush the surface of what is and isn’t affecting markets. Let our deep-dive analytics supply you with bottom-up and top-down analytics. You won’t be disappointed. Upgrade today!!


