
If you were concerned for the economic data to be released by China overnight, color yourself in the same camp as many investors. But for all of the concern, China managed to surprise economists with better than forecasted growth in the Q1 2019 period. Beijing said its economy expanded by 6.4% year-on-year in the first quarter of 2019, topping the 6.3% that analysts polled by Reuters had expected. China’s economy grew by 6.4% year-on-year in the fourth quarter of last year, and 6.8 percent in the first quarter of 2018. The world’s second largest economy also released other economic indicators:
- Industrial production jumped 8.5% year-on-year in March — surging past the 5.9% estimated by Reuters to register the fastest growth since July 2014.
- Retail sales for March grew by 8.7% year-on-year, beating Reuters’ projection of 8.4 percent.
- Fixed asset investment in the first quarter increased by 6.3% year-on-year, in line with expectations.
“I think that policy impact is really taking effect now,” Yifan Hu, regional chief investment officer and chief China economist at UBS Global Wealth Management, told CNBC’s Signs “after the data announcement.”
Hu said she expects Chinese authorities to introduce more supportive policies as uncertainties surrounding trade have not gone away. The U.S. and China are currently negotiating a trade deal after putting their tariff fight on hold.
“Negotiations are continuing. We saw positive signs but we still have to be fully aware of the uncertainties and the volatility that that could bring later on,” she said.
The U.S. will have it’s own set of economic data releases to contend with, mostly on Thursday and with the rollout of the latest monthly retail sales data, Philly Fed Index, Markit PMI and Leading Economic Indicators data sets. Yes, Thursday’s going to be quite the data dump in the United States. Tuesday’s economic data was rather light, but found with the typical rebounding results that signal trend-growth is the theme of 2019.
The National Association of Home Builders’ monthly confidence index rose one point to 63 in April, the trade group said Tuesday.
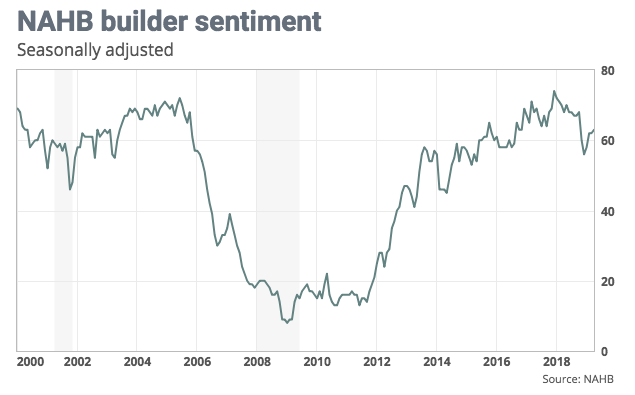
Builder confidence in the market for newly built single-family homes rose one point to 63 in April, according to the latest National Association of Home Builders/Wells Fargo Housing Market Index (HMI) released today. Sentiment levels have held in the low 60s for the past three months.
“Builders report solid demand for new single-family homes but they are also grappling with affordability concerns stemming from a chronic shortage of construction workers and buildable lots,” said NAHB Chairman Greg Ugalde, a home builder and developer from Torrington, Conn.
“Ongoing job growth, favorable demographics and a low-interest rate environment will help to modestly spark sales growth in the near term,” said NAHB Chief Economist Robert Dietz. “However, supply-side headwinds that are putting upward pressure on housing costs will limit more robust growth in the housing market.” [link]
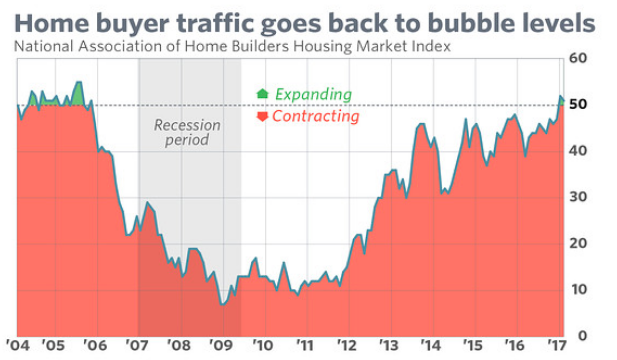
The gauge of current sales conditions rose one point to 69, but the one that tracks expectations for the coming six months fell one point to 71. The sub-index that measures traffic of prospective buyers jumped three points to 47.
The traffic component of this particular index has long been an outlier, only rarely rising above the neutral 50 line. It had not been this high since December 2016, as reported in January 2017.
The sentiment index tumbled eight points in November, charting a bigger monthly decline than what was seen in the worst of the housing crisis a decade ago, as market headwinds finally caught up to builders.
“As we have been emphasizing over the past couple of months, the housing sector should transition to a modest tailwind for growth in 2019 as housing demand gets a boost from the sharp decline in mortgage rates since their November highs and the passage of the ‘shock’ value of tax reform,” said Deutsche Bank economists in a note out before the NAHB release.”
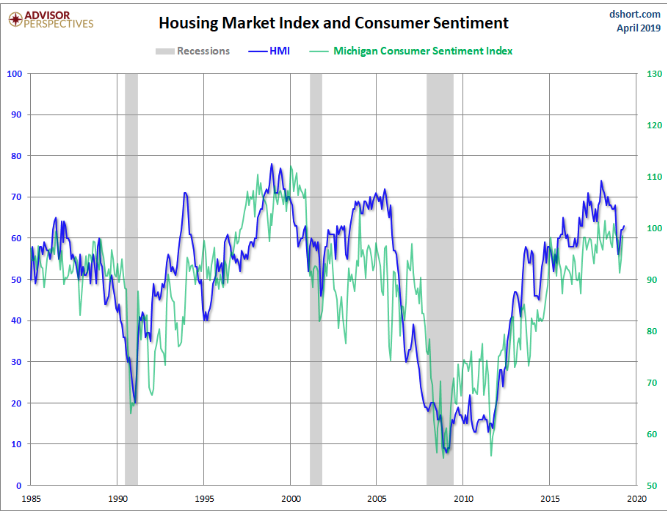
Housing tends to have a pile-on affect for the overall economy. When a home is bought, new home or resale, additional purchases of goods that will go inside the home spur consumer spending and consumer sentiment. For this reason, the NAHB tends to track the Michigan Consumer Sentiment Index, as shown in the chart below.
While investors await greater economic data on Thursday, earnings continue to roll in with Netflix stealing the spotlight in the after hours Tuesday afternoon. Here are the numbers Netflix reported compared to Wall Street’s expectations:
- Earnings per share: 76 cents, vs. 57 cents expected, per Refinitiv consensus estimate.
- Revenue: $4.52 billion, vs. $4.50 billion expected, per Refinitiv consensus estimate.
- Domestic paid subscriber additions: 1.74 million, vs. 1.61 million, forecast by FactSet
- International paid subscriber additions: 7.86 million, vs. 7.31 million, forecast by FactSet

Netflix revenue rose 22.2% year over year, reporting $4.52 billion compared with $3.70 billion a year earlier. Earnings per share climbed from 64 cents in Q1 2018 to 76 in the same quarter this year, marking an 18.8% increase.
Netflix provided light guidance for the second quarter. The company estimated Q2 earnings per share of 55 cents compared with the 99 cents analysts were expecting, per Refinitiv. Netflix expects 5 million new paying subscribers in the second quarter, while analysts were projecting 5.3 million on average, but Netflix executives said they “expect another year of record annual paid net adds in 2019,” which means topping 2018’s total of 28.6 million new paying subscribers.
The biggest disappointment in Netflix’s forecast was in U.S. subscribers. Netflix forecast only 300,000 new paying subscribers in the U.S., while analysts were expecting more than double that total. Netflix is increasing prices in the U.S., and stated in its letter to shareholders that price increases can lead to “some modest short-term churn effect.”
Netflix said that more than 52 million subscribers watched “Triple Frontier,” a big-budget action movie starring Ben Affleck, in its first four weeks of availability, and that the series “Umbrella Academy” was watched by 45 million member households in its first four weeks.
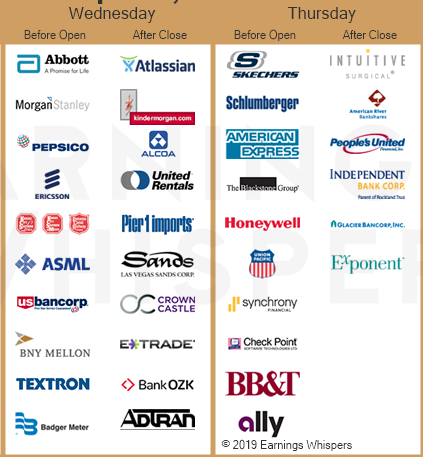
Corporate results for the Q1 period are the biggest market focus right now and as the big money center banks continue to deliver earnings this week. Morgan Stanley, PepsiCo, Abbott Labs and U.S. Bancorp will update investors before the bell. Las Vegas Sands will also report their latest results. More corporate earnings results will rollout through Thursday and ahead of Good Friday.
Based on the early results from the Q1 earnings season, analysts and data tracking firms are quickly revising their Q1 EPS forecast…drumroll… higher! Remember, it was just last week that FactSet was forecasting an earnings decline of -4.3% with revenues expected to rise 4.8 percent. (Below from Finom Group’s Weekly Research Report)
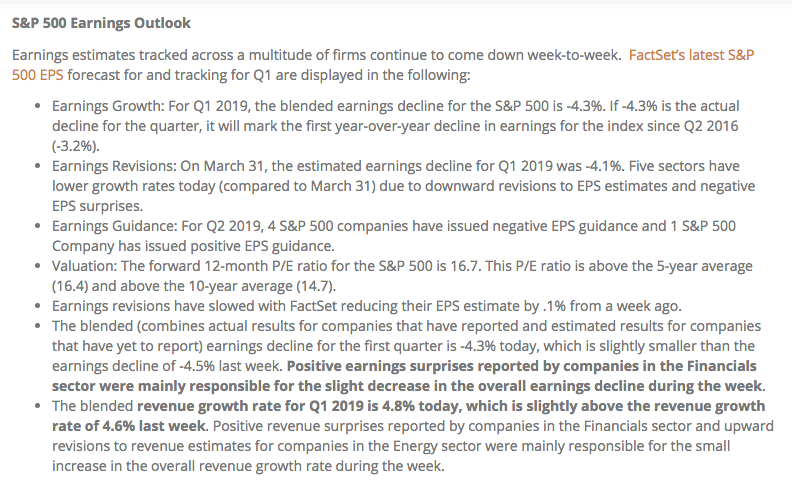
“In terms of estimate revisions for companies in the S&P 500, analysts have made larger cuts than average to EPS estimates for Q1 2019 to date. On a per-share basis, estimated earnings for the first quarter have fallen by 6.7% since December 31. This percentage decline is larger than the 5-year average (-3.2%), the 10-year average (-3.7%), and the 15-year average (-4.0%) for a quarter.”
And now analysts are forced to revise their estimates higher in the out quarters. FactSet has also adjusted its Q1 EPS and revenue forecast higher. The firm now sees Q1 EPS declining -3.6% with revenues growing 4.9 percent. Furthermore, FactSet’s Q2 2019 EPS forecast has moved from expressing another quarter of EPS declines to a slight positive EPS result.
- For Q2 2019, analysts are projecting earnings growth of 0.1% and revenue growth of 4.6%.
- For Q3 2019, analysts are projecting earnings growth of 1.8% and revenue growth of 4.4%.
- For Q4 2019, analysts are projecting earnings growth of 8.1% and revenue growth of 4.8%.
- For CY 2019, analysts are projecting earnings growth of 3.8% and revenue growth of 4.9%.
FactSet’s CY19 EPS forecast has risen some .4% WoW and we would be of the opinion the trend of upward revisions will continue in the coming weeks. So if you’re in the camp that the bond market is always right and the V-shaped recovery in equities has been wrong…
Based on the upward motility in FY19 S&P 500 EPS, some are of the opinion the market could “melt up” through the year. This doesn’t exonerate the potential of a market pullback between now and year’s end, but a melt up from perceived over reactionary market lows in December 2018 could be in the cards. Blackrock’s Larry Fink seems to think so.

“We have a risk of a melt-up, not a meltdown here. Despite where the markets are in equities, we have not seen money being put to work,” the head of the world’s largest asset manager told CNBC’s “Squawk Box. ” “We have record amounts of money in cash. We still see outflows in retail in equities and in institutions.
Many people thought we were going to be in a period of rising rates. We were not and we saw huge underinvestment and people had to rush into fixed income,” Fink said. “We have not seen that in equities yet.”
Fink added that, with central banks being “more dovish than ever … there is a shortage of good assets” for investors, which could ignite the melt-up in the global equity market.
We can utilize the following chart as representative validation of what Fink has described as the rush/flight into bonds late last year.
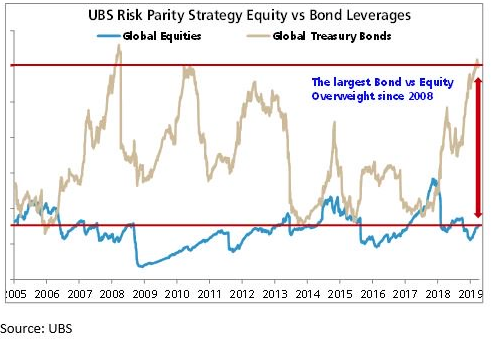
As shown in the chart, this has been the largest bond vs. equity overweighting since the Great Financial Crisis in 2008. It’s hard to ignore and has lead many to believe the bond market could not have it “this wrong”. But if earnings continue to be revised upward, as displayed in the Strategas chart below, the equity market melt up outlined by Larry Fink could find flows coming out of bonds and further into equities in the back half of 2019.
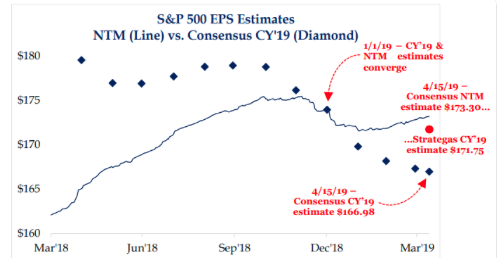
“The slope of downward estimate revision has clearly moderated and the outlook for the full-year ahead is clearly improving – historically a positive leading indicator. .. we maintain our view that policy makers will be able to engineer an economic “soft landing”.
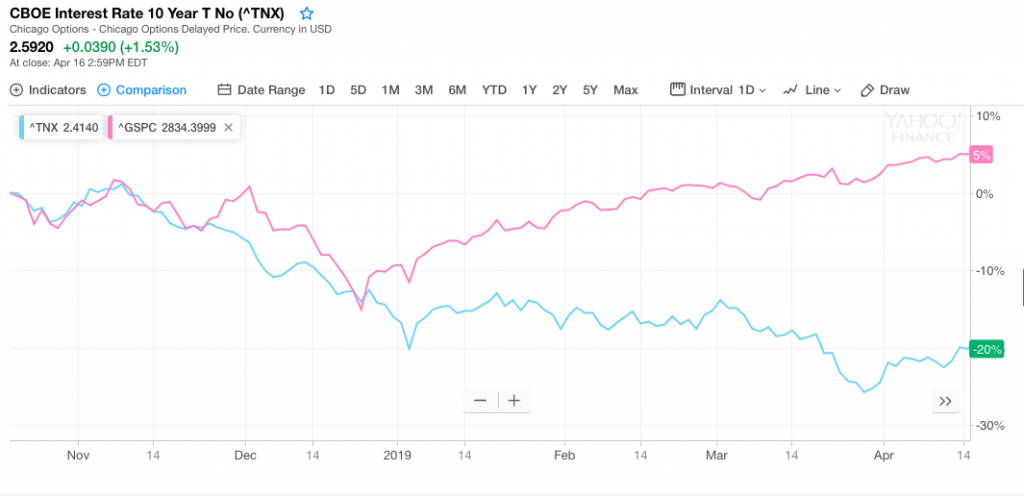
Recall from our past Daily Market Dispatch articles we compared the 10-year yield chart with that of the S&P 500. Given the flight into bonds as well as the surging S&P 500, the alligator jaws chart often is suggested that the jaws will close with the S&P 500 (top line) closing down onto the TNX-10 yr. Treasury (bottom line). But that’s not what’s happening to date as the TNX has actually tilted higher over the last 7 trading session.
With every positive outlook, of course there is the contrasting negative outlook to consider. That negative S&P 500 EPS outlook comes to us from, yes you guessed it, Morgan Stanley. In their Monday released notes to clients, Morgan Stanley warns investors about wage inflation and the rising savings rate.
Finom Group discussed these notes at length and with detail in our Trading Room with Premium Members on Tuesday, but let’s take a look at exactly what Morgan Stanly had to offer in its investor warnings.
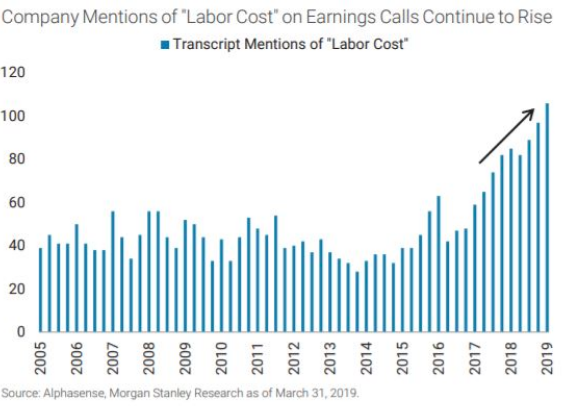
“Large public companies and small businesses alike are discussing labor costs as a major headwind to profitability,” wrote Morgan Stanley equity strategist Adam Virgadamo. “Sustained wage pressures add to the likelihood of an earnings recession in 2019 as higher labor costs and slowing top line growth create a dangerous recipe for margins. In the bear case, the earnings recession could spur layoffs and raise the probability of an economic recession.
While wage growth by some measures, like average hourly earnings, remain near historic averages, Virgadamo warns that underlying data, which show the broadening of wage gains and the acceleration of overall compensation growth, will combine with an apparent trend of slowing revenue growth to crimp margins, a development that could result in employees being laid off.
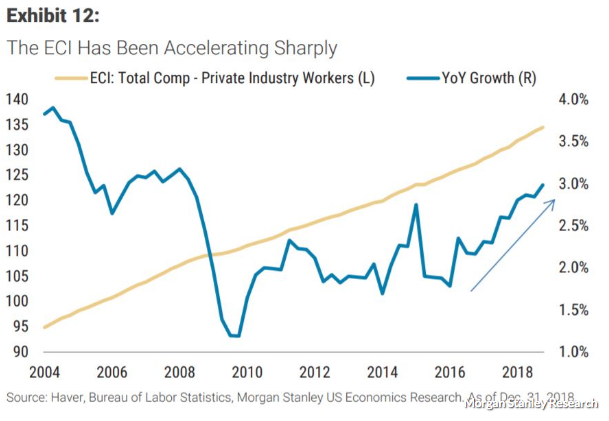
Average hourly earnings grew at an annual rate of 3.2% in March, down from 3.4% in February, but well above the 2.3% average annual pace seen over the past 10 years, according to the Labor Department. The Employment Cost Index, as pictured below, and which includes the growth of non-wage payments, like health-care benefits in addition to wages, has been accelerating more steadily: to 2.9% annually from 1.9% in 2016.”
“The bull case attached to rising wages is that higher wages can spur consumer spending and offer sales growth support for consumer facing companies,” wrote Virgadamo, but in recent years rising wages have been matched commensurately with rising savings. During recent years, “ an increasing percentage of higher wages are being saved.”
Everything the analyst has outlined seems very logical and is accompanied by back dated-present charts of the economic data offered. Having said that, there’s simply never been the scenario where rising wages, even when accompanied by a higher savings rate, has CAUSED an earnings recession or an outright economic recession. The denominator would have to cause that earnings recession, demand/sales. The demand side of the equation has waned from 2018 and into 2019 undoubtedly, but by all YoY accounts (factory orders, wholesale inventories and end-user retail sales) sales continue to grow. And this, yes this through the accelerated wage growth of 2018, which by the analysts’ own admission, has tapered off in Q1 2019. Nonetheless we can also take a look at that savings rate overlay with wage growth.
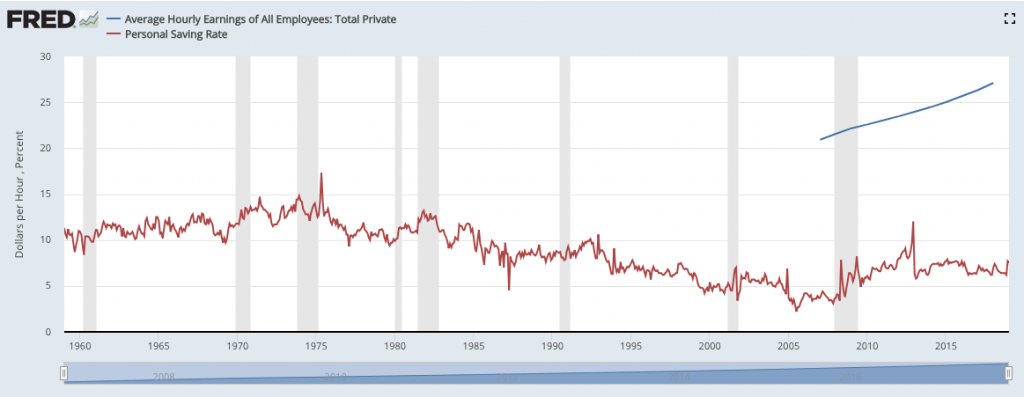
If you want to be your own worst enemy as an analyst, go ahead and pick the fight suggesting the U.S. consumer/household is unwilling to spend over time. Go right ahead and pick that fight. As shown in the chart above, the savings rate (red line) has come down since we’ve moved to a more consumer-based economy (Post 1970s). Wages do nothing but go up over time and as such it should be expected that the rate of change for the savings rate may tick higher, but rate of change does not qualify as a growth rate or growth rate trend. The current uptick in the savings rate is a measure we would anticipate to tick lower in the back half of 2019. With that said, we don’t see the demand picture moving to a more recessionary stance either. The impetus for declines in consumer spending aren’t presented in the labor market presently.
Steady as she goes, this market seems to be expressing and as earnings season is suggesting the worst of analysts’ expectations may have been an overreaction to the geopolitical landscape and rate of change in the global economy. Moving from above trend-growth to trend-growth can produce overreactions, but let’s wait and see if we can certify the revised claims and forecasts in the weeks to come.


