Remember all the way back in January 2019 all the calls for a retest of the lows from December 2018? With each passing month since, those calls have faded into the misty background and proven more of a bias towards recency and fear than anything else. Some of the worst calls for market moves ever are seen at market peaks and valleys. But if you actually pay attention to who are laying out these claims, forecasts and/or calls, you’ll likely understand where the calls were made with great error and emotion.
We often like to think that technical analysis is more black and white, somewhat void of emotion. There are no words from CEOs and company executives in technical analysis, there’s no analysts’ notes or stock rating associated within the performance of technical analysis and thus we assume all measures of implied bias have been removed right? WRONG! The fact is that wherever human interests are found performing the exercise there is the intrinsic element of bias to one degree or another.
Now I happen to favor the work and experience of Mr. Carter Worth, the resident CNBC technical analyst. I’ve followed his works for a number of years and he often has stated that he doesn’t care what a CEO says or what analysts are saying about a stock he’s performing TA on, he simply looks at what the charts are saying and what his experiences tells him. Remember that phrase, “his experience”. The fact is that his experience is a qualified bias. With that in mind let’s go back to January 2019 and review the market rally that commenced off of the December 2018 bottom with a recorded CNBC Fast Money broadcast.
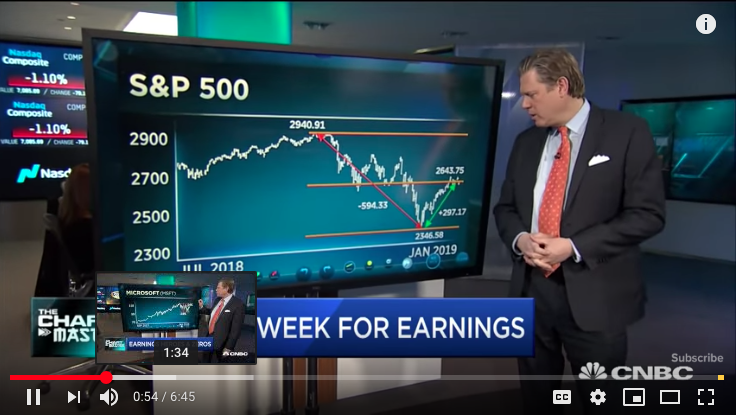
On January 28, 2019, Carter Worth stated very clearly that he expects the market will return to test its lows from December 2018 and after a 50% retracement off the December bottom. What Worth’s charts couldn’t identify were the shift in gamma positioning amongst CTA’s, hedge funds and the like, which while proved minimal positioning at best, was still enough to create a Breadth thrust and Zweig thrust. What Worth’s technical analysis couldn’t identify was the effects of the fundamental underpinnings of the market’s rally that aligned with a mild earnings recession in Q1 that would presume accelerated earnings growth forecasts through the remainder of 2019. Remember, the stock market is a forward pricing mechanism and as such it tends to price the 6 month forward looking, fundamental outlook or earnings forecast. There in lay the main problem with Carter Worth’s technical outlook, which was proven dead wrong. What I believe most technicians fail to consider as they herald the glory of TA over that of fundamental analysis is that charts have to start somewhere and are driven by an underlying valuation of a stock and that valuation is offered in what? That’s right, the fundamental operational performance metrics of a company over time.
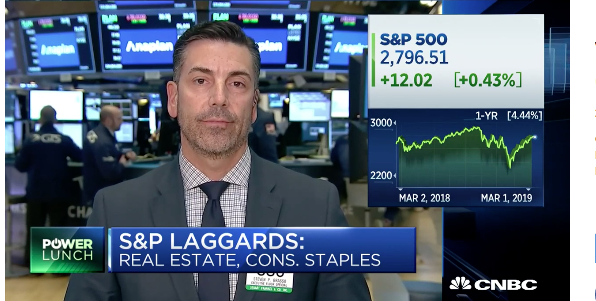
And then there’s CNBC’s Steve Grasso. If you thought Carter Worth’s market call was poorly offered in January 2019, Grasso’s was even worse as he not only expected the market to retest the lows from December 2018, he expected a move even lower and with the S&P 500 reaching 2,200-2,100.

Unfortunately, when these CNBC folks are challenged with their own calls, they block most Twitter accounts and even with polite discourse. As such, I’m unable to do anything more than post Mr. Grasso’s erroneous call for the S&P 500. But Grasso re-upped that call in March and advised viewers of CNBC not to buy into the market rally.
The S&P 500 rose another 115 or so points since that time and broke 2,900 recently. It’s not often that critique other market participants to this degree, but there is a message to offer in the critique that could prove to have great educational value. That message is simple: Just because you’re on television, just because you’re an asset manager and/or a registered advisor that doesn’t mean you’re good at what you do. It doesn’t even mean you beat the benchmark annual return.
Moreover, if you thought the ever popular and infamous Mad Money host Jim Cramer was some kind of stock guru because that is essentially what his whole show is about, providing stock picks and ratings, think again.
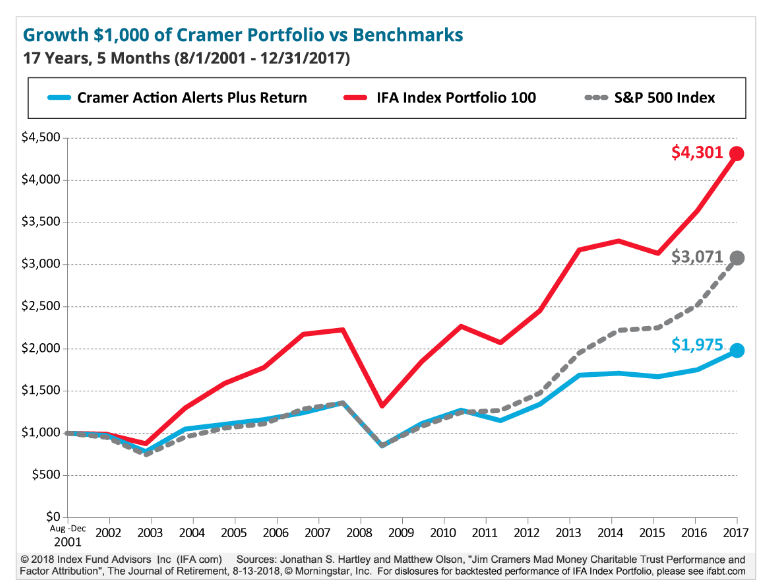
“CNBC TV personality and “Mad Money” host Jim Cramer has built a lucrative career as a stock picker, but a new analysis of his charitable fund—a personal stock portfolio he co-manages that the financial website he founded has built a subscription service upon—shows he doesn’t beat the market.
Cramer’s Action Alerts Plus portfolio has underperformed the S&P 500 index in terms of total cumulative returns since its 2001 inception, according to a working paper released Friday by Jonathan Hartley and Matthew Olson, researchers from the Wharton School at the University of Pennsylvania. While the fund outperformed the 500-member index in the years leading up to the 2008 financial crisis—which Hartley said was partially a reflection of the fund’s previous inclusion of small-cap companies and growth stocks that were outperforming during the pre-recession bull run—things have gotten worse since 2011, with Action Alerts Plus falling 9.5% in that year, when the S&P 500 was unmoved. It rose just 1.3% in 2014, versus an 11.4% increase for the S&P, the study found.
Cramer told MarketWatch that he has “never promised outperformance” and that the subscription service is a “largely educational product.”
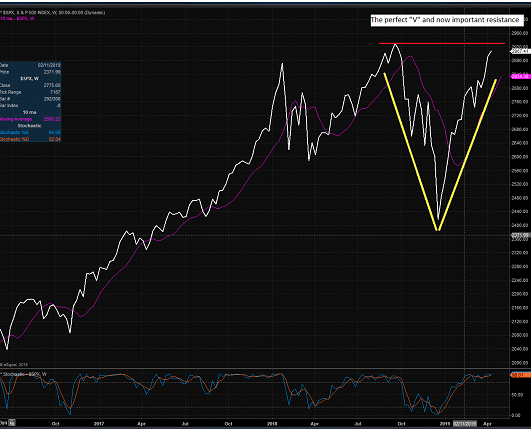
Look, nobody’s the perfect stock picker or trader for that matter. And certainly nobody I’m aware of was expecting a V-shaped recovery, which is exactly what has taken place since the bottoms in 2018. Because nobody was expecting this performance, not too many have been benefitting from it as they weren’t positioned for it.
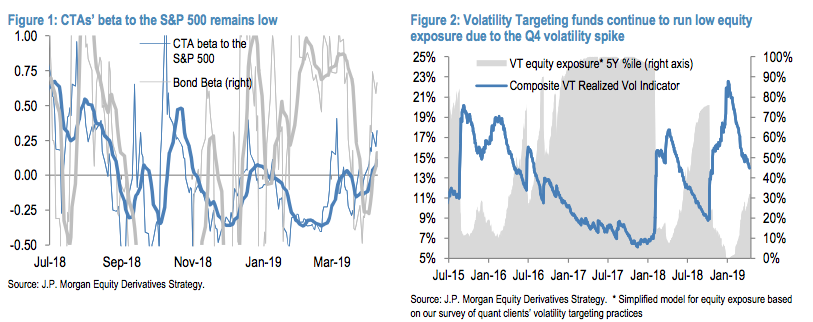
- CTAs’ equity exposure is only modestly long based on their trailing short-term beta, and remains low relative to history, ranking in just its ~40th %ile over the past 5 years.
- Volatility Targeting portfolios continue to run relatively low equity exposure (~30th %ile based on our composite VT indicator for US equity realized volatility). Meanwhile, option dealers’ current long gamma positioning should keep a lid on realized volatility for the time being, allowing these portfolios to continue to re-lever as the impact of the Q4 volatility spike continues to fade.
- Hedge Funds’ equity exposure remains very low in aggregate. The market beta of HFR’s broadest daily HF performance index to the S&P 500 remains near multi-year lows and net leverage is in just the 32nd %ile over the past year across their U.S. portfolio as of the end of last week.
- Retail investors have yet to return to U.S. equity funds after record outflows in December, recording additional outflows of ~$20Bn YTD.
Based on the relentless rise in the major stock market indices, the constant outflows from equities and inflows for bond funds, trading volume has become so thin lately. According to the WSJ, only 6.2 billion shares traded hands daily last week on the Nasdaq and NYSE, which is the lowest weekly average seen in more than seven months. If you thought the past 8+-year market rally was the most hated bull market rally, it’s quite clear that the 2019 market recovery that resumed the bull market rally is hated that much more. The psychology of the market, for lack of better phrasing, has sucked something fierce out of the psychology of traders and investors alike.
At some point, the current rally will pause (during the “Sell in May” period, perhaps?). At some point, stocks will pull back a bit (and perhaps test the seemingly all-important 200-day moving average?). And at some point, an entry point that so many have been looking for in 2019 will appear. It’s at this point that investors will have a decision to make and we’ll know for sure if volumes come back in force.
You’ll often hear from permabears when the market is rallying that it is doing so on lighter volume. What they are referencing is that markets are moving higher on lighter volume than when they decline, with higher volume. That’s actually how the market works folks and it doesn’t matter what time frame one looks at; markets trend higher, but decline more precipitously. Fear is gripping and powerful on the human psyche.
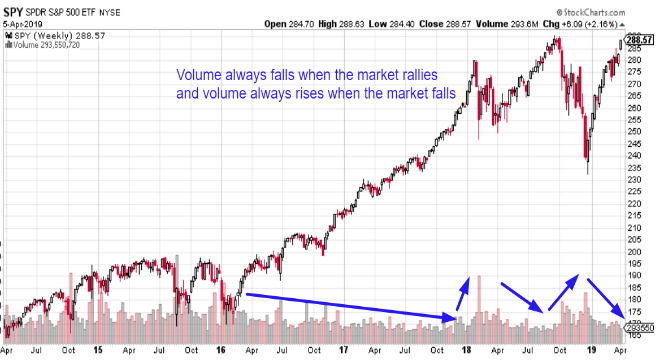
As shown in the chart above, volume is always weaker on the way up and thus in no way, shape or form is volume an indicator of strength or weakness of a market rally. Additionally, we can look at the SPY 15-day average’s distance from its 200-day volume average to assess forward-looking market probabilities. Here’s what happens next to the S&P when SPY volume is this low. (Table provided by Troy Bombardia)
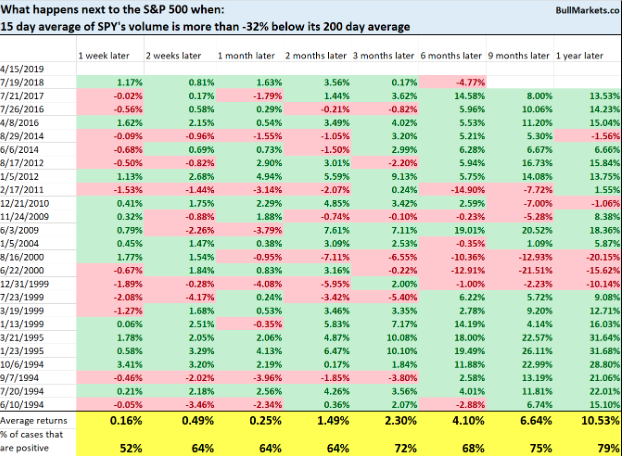
There’s no real edge to be found here, but what we can extrapolate is that the further one goes out in the duration of the table, the higher the market goes.
So what’s next for the stock market? Well, from a seasonal perspective earnings season is upon us and the market will likely ebb and flow based on the strength or weakness in the trend of earnings results as well as guidance issued. Thus far, earnings are coming in better than expected, but we’re really just getting started with the financials reporting results through the current week. Tech earnings and other mega cap stocks will report in the coming weeks, which will draw out consensus estimates for forward-looking 2019 EPS.
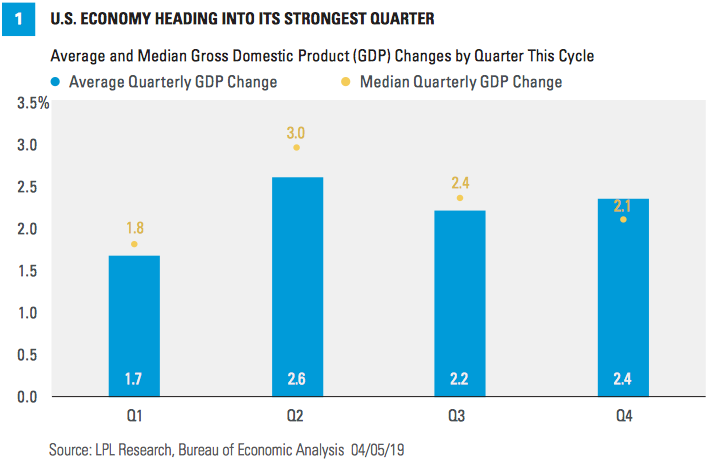
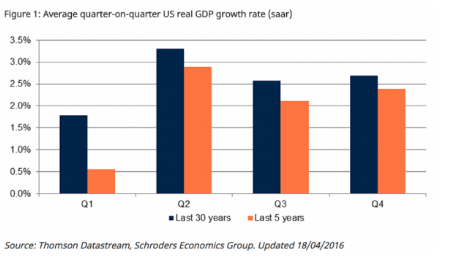
From a more macro perspective, economic growth is expected to accelerate in Q2 and from what is a typically slower Q1 period. Since the expansion cycle began in 2009, the first quarter has grown an average of 1.7%, the weakest quarter for output growth. Winter could be to blame for seasonal weakness, as inclement weather can inhibit consumer activity.
We can actually go much further back in time and validate that Q1 is seasonally the worst quarter of the year, as shown in the chart below. Between 1986 and 2015, real GDP growth for Q1 averaged 1.78% compared to 2.86% across Q2, Q3 and Q4.
But I get it, if you’re a permabear and the Q1 period is the present period, you hike up the rhetoric to drive fear as the economic data is seemingly siding more in your favor. And don’t get me started on the Ides of March nonsense that has no historical relevance other than it’s seasonal triple witching, which also has extremely little impact on the market.
The first quarter’s mixed signals were understandably difficult to digest. Pockets of the economy unexpectedly weakened, uncertainty grew amid global setbacks, and trade and political headlines were an added distraction and headwind. Moreover, we’ve now entered the best month of the year for equity markets as well as the best GDP quarter of the year historically. Second-quarter GDP growth in this cycle has averaged 2.6%; the strongest pace of all quarters, and seasonality in GDP has been more evident in recent years. Output has grown the most in the second quarter in each of the past five years.
Equity markets remain in rally mode with April proving to be the best month of the year for stocks historically. Banks are beating on the bottom line broadly with mixed results on the top line. On Tuesday, with Blackrock also beating reporting a beat on the bottom line in the premarket, equity futures are once again in rally mode. Netflix will be the first of the mega cap tech stocks to report after the closing bell Tuesday.
With the V-shaped market recovery came a calming of markets that seems relentless. The VIX or implied volatility is near its lowest level of the year, just above 12% and with a VIX futures expiration taking place Tuesday. There have been some big bets placed throughout the year on a return of the volatility beast.
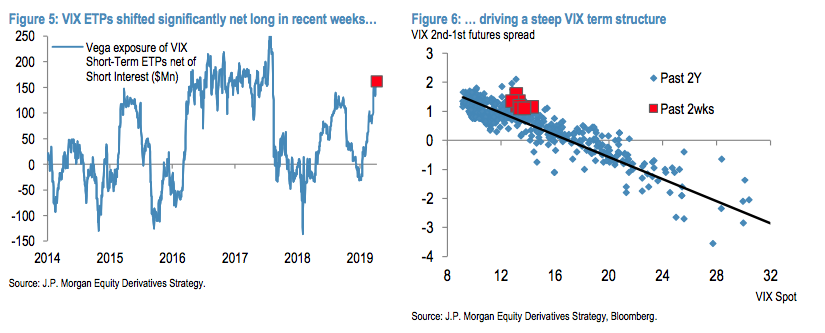
Investors piled into VIX ETPs in Feb and March as volatility declined from the Q4 spike, driving ETPs’ net long exposure to 1.5-year highs. Since then inflows have slowed, but investors continued to allocate into long VIX products (~$400Mn in inflows over the past 2 weeks), causing ETPs’ net long exposure to increase modestly further (Figure 5). As discussed in our previous note, the Vega notional in levered and inverse VIX ETPs remains well below pre-Feb’18 levels, and thus are unlikely to drive end-of-day short gamma rebalancing effects anywhere close to those experienced on 2/5/18 in the near term. However, rebalancing by these long VIX ETPs has driven a steep front-end VIX term structure (i.e., steeper than expected given the level of volatility, Figure 6). Meanwhile, the build-up of long Vega exposure in VIX ETPs suggests they could provide a headwind to the next volatility spike, as investors are likely to take profits on these positions and/or invest in inverse products to monetize the spike.
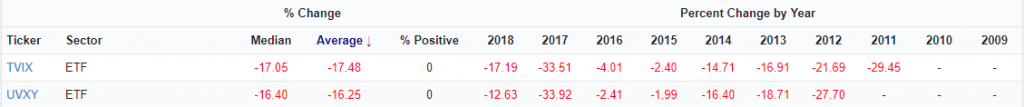
There’s been a lot of discussion and misinformation published by Zerohedge and Sven Henrich on how to review the aforementioned hedging and outright positioning within the volatility complex of late. One thing is for sure; betting long on volatility requires astute timing and positioning with the right instruments. Some VIX-ETPs are down anywhere between 35-40%+ for the year. Going long the likes of UVXY or TVIX in 2019, assuming a retest of the market lows has been a poor bet, but one which has found a doubling down on that bet over the last 45 days, which has produced the countertrade in the noncommercial VIX Futures market. It’s not often that the long-VOL trade drives the participation in the short-VOL trade, but when EXPOSED long VEGA is some 12-13X that of the short VEGA, this is what you get. Nonetheless and more importantly, the natural order of the market is one of complacency.
That last statement certifies that markets demand normal operating procedure to drive market participation. It also certifies that positioning long-VOL requires astute precision in positioning. And from a seasonal perspective, No time is a good time to be long levered inverse VIX, but the second half of April has been historically bad.
Does this certify that historic trends will repeat this April? I can only offer readers refer to the market crash playbook. The market crash playbook tells us, first there is a bounce of the dead cat variety, then a retest of the lows (which can take many forms), a basing period (to make sure the worst is over), and finally, a resumption of the uptrend. The market crash playbook was pretty useless this time around. Who’s to say whether or not going long volatility in the back half of April will or won’t follow the seasonal playbook of volatility?


