Welcome to this week’s State of the Markets with Wayne Nelson and Seth Golden. Please click the following link to review the SOTM video. In this week’s episode we discuss the best 6 months of the year to own stocks, the clear signals the market has sent with regards to seasonality and forward looking economic strength and earnings. Our dialogue this week aims to rationalize the numerous headlines while recognizing the impact on financial markets. More than halfway through earnings season, the median beat rate is on track to show, at worst, a slight YoY decline in S&P 500 EPS. Nonfarm Payroll data came in much better than economists forecast while ISM Manufacturing continues to lag. Looking ahead, we find strong historical and seasonal reasons for owning equities. Please review the supporting graphics and bullet points that accompany our State of the Markets video!
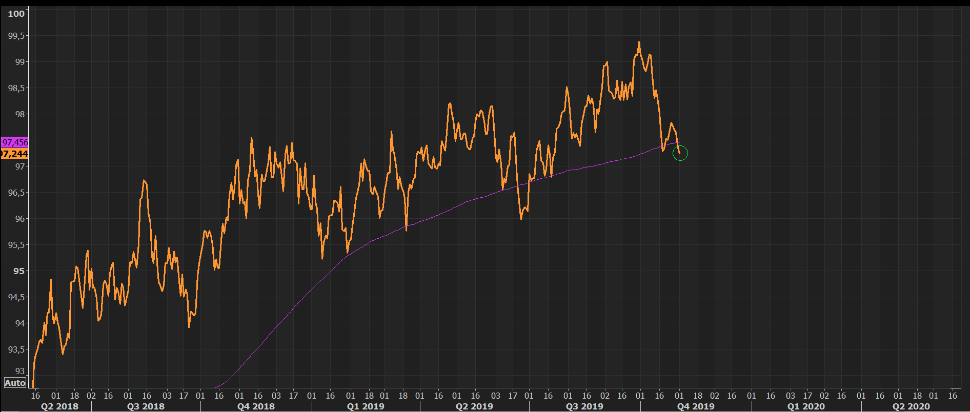
- DXY: below the 200 day average here and has not closed here since late July.
- The U.S. dollar index could fall to as low as 85 as the Federal Reserve expands its balance sheet, Mohammed Apabhai, head of Asia Pacific trading strategies group at Citi, told CNBC.
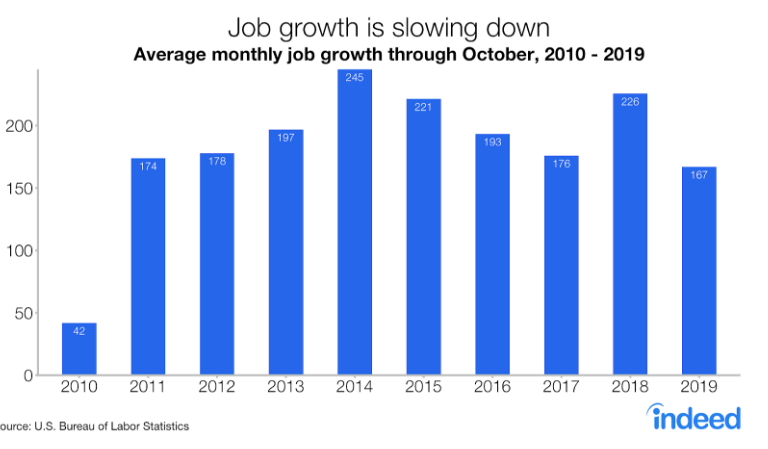
- Economists lauded Friday’s employment report as the U.S. added 128,000 new jobs, handily beating expectations of a lower number affected by a strike at General Motors.
- The unemployment rate, meanwhile, edged up to 3.6% from 3.5%, still hanging around the lowest level since 1969.
- Wages rose 0.2% in October to $28.18 an hour, but worker pay isn’t increasing as fast as it was earlier in the year. Wages have climbed 3% in the past 12 months.
- Updated figures for September and August, meanwhile, show that the economy added 95,000 more jobs than the government previously reported.
- “In 8 of the 10 times ChicagoPMI has printed today’s level it came with a Recession.”
- The Chicago Purchasing Management Index sank to 43.2 in October from 47.1 in the prior month.
- This is the lowest level since December 2015. Economists has expected a reading of 48.3, according to Econoday.
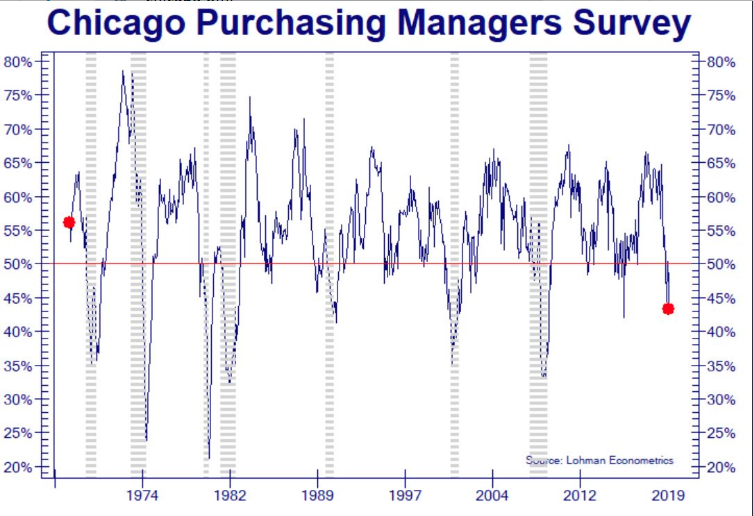
- Chicago PMI has a 91% correlation with ISM Manufacturing. “New Orders declined to 37.0, its lowest since March 2009”.
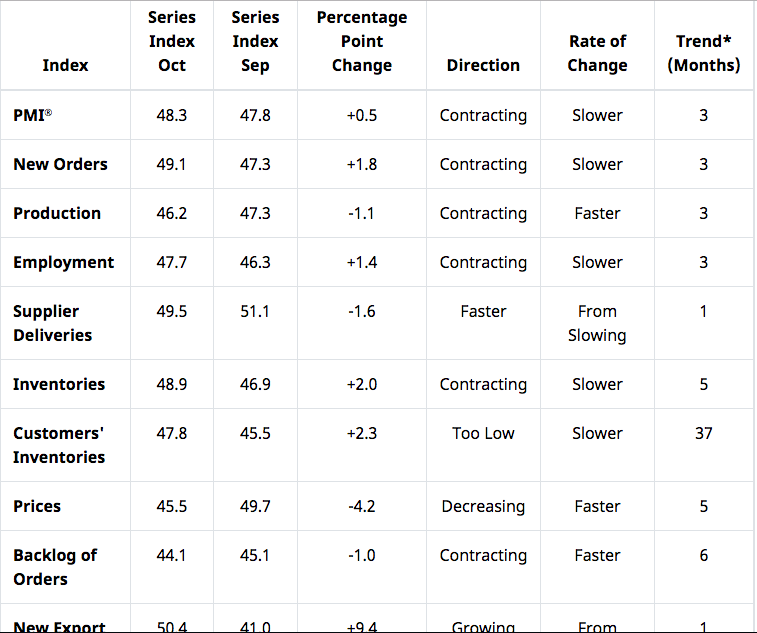
- The purchasing manufacturing index from the Institute for Supply Management came in at 48.3% last month, compared with a 47.8% reading in September. But it was below economists’ expectations of 49.1%. A number below 50% represents a contraction in the industry.
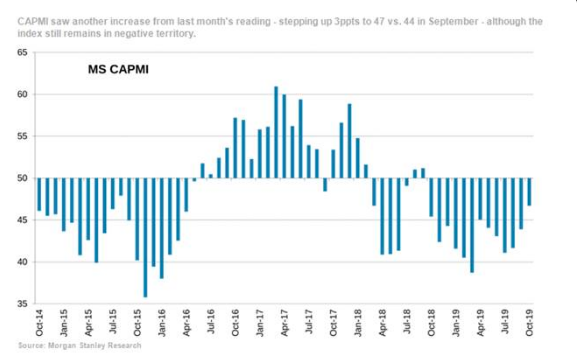
- MS CAPMI index registered a 3ppt increase in October (coming in at 47 vs. 44 last month), but also represents the third consecutive month with a positive change on a sequential basis.
- The result this month, however, also marks one full year of sub-50 readings.
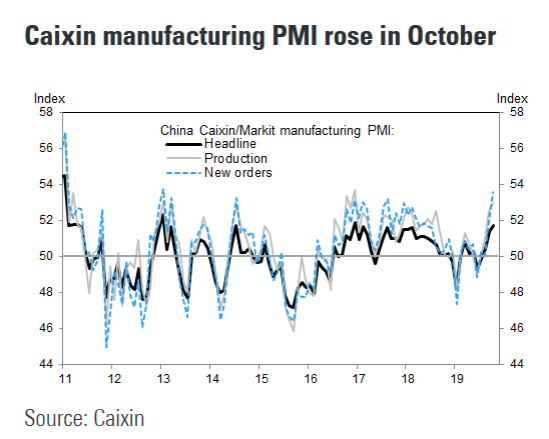
- The Caixin China manufacturing purchasing managers index rose to a 32-month high of 51.7 last month from 51.4 in September, Caixin Media Co. and research firm Markit said Friday.
- The gauge for new export orders returned to expansion and reached the highest level since February 2018, Zhengsheng Zhong, an economist at CEBM Group said. That’s possibly due to the U.S.’ move to exempt more than 400 types of Chinese products from additional tariffs, Mr. Zhong said.
- China’s official manufacturing PMI, a competing gauge, dropped to an eight-month low 49.3 in October from 49.8 in September, the National Bureau of Statistics said Thursday.
- Goldman: “The divergence between the Caixin manufacturing PMI and NBS manufacturing PMI was particularly large in October. It is the highest ever divergence based on our adjusted NBS manufacturing PMI, and one of the highest divergence if we take both manufacturing PMIs as released. The diverging trend between the new export orders sub-indexes under the two surveys contributed– we find that in recent years, the Caixin new export orders sub-index seems to be leading the NBS one slightly. Other factors such as different survey times during the month and different samples of companies might have also contributed to the difference. In general however, the NBS manufacturing PMI shows a higher correlation with hard indicators such as industrial production in recent years”
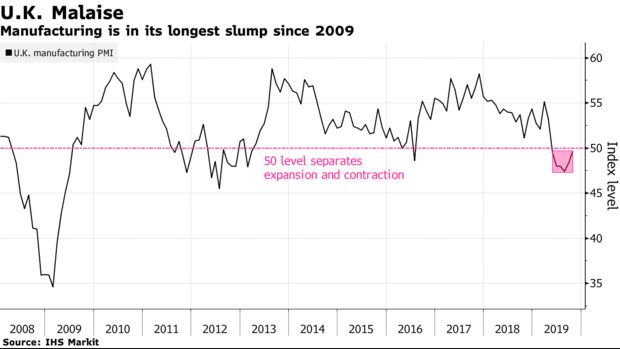
- U.K. manufacturing almost returned to growth last month bloom.bg/36oylA6
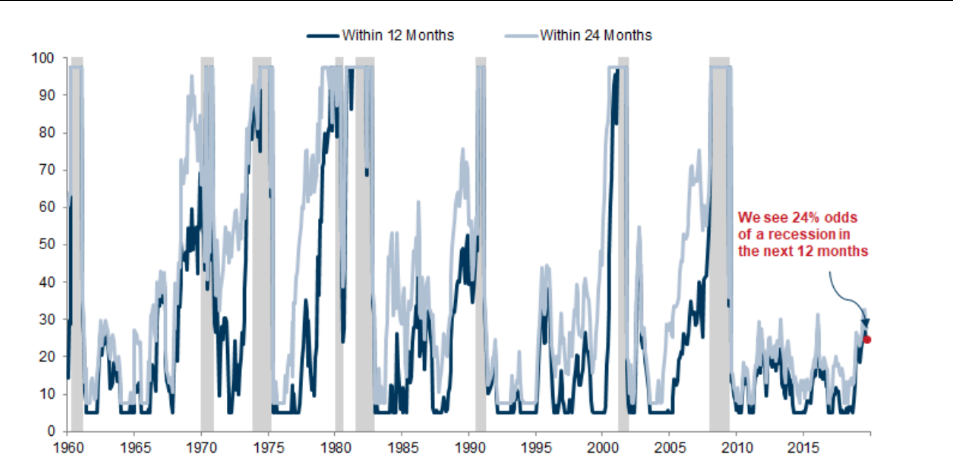
- The risk of a US economic recession remains fairly moderate.
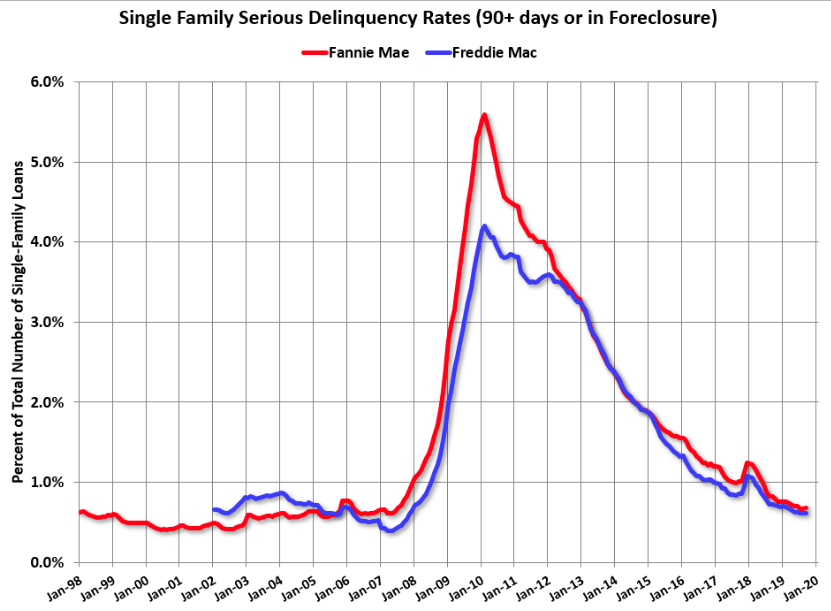
- Fannie Mae reported that the Single-Family Serious Delinquency increased slightly to 0.68% in September, from 0.68% in August. The serious delinquency rate is down from 0.82% in September 2018.
- The Fannie Mae serious delinquency rate peaked in February 2010 at 5.59%.

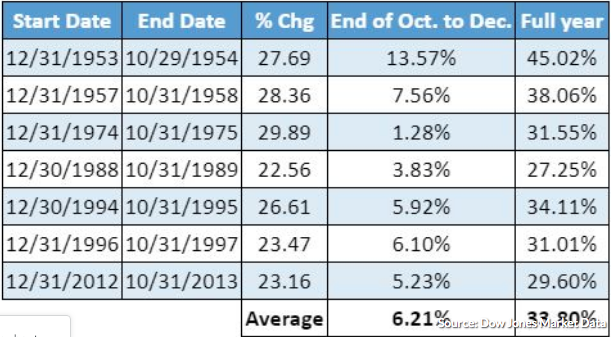
- When the S&P 500 has gained at least 20% through Oct. 31, it is up 21.17% thus far, as of Thursday, the benchmark’s return is 6.21% on average for the remaining period, with an average full-year gain of 33.8%.
- The Fed slashed interest rates for the third straight time on Wednesday while indicating it is going to pause easing. Powell made it clear in the press conference that the current monetary policy stance is “likely to remain appropriate.”
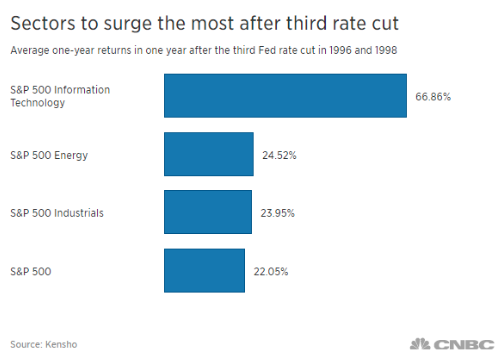
- The three-and-done approach was used on two occasions in history — between 1995 and 1996 and in 1998. The Alan Greenspan-led Fed slashed rates by a total of 75 basis points during both periods to combat an economic downturn and successfully prolong the expansion.
- The Fed’s insurance easing episodes in the 1990s managed to drive the S&P 500 22% higher on average a year after the third cut, CNBC analysis found. The move was particularly beneficial for cyclical stocks — including tech, energy and industrials — as investors bet on economically sensitive pockets of the market after Fed rate cuts.
- Kensho Data
- Investors are subject to behavioral biases that color how we see the world. One of these biases relates to trading and investing and how we tend to seek out data that confirms our beliefs and biases while conveniently ignoring the rest.
- Economic data is often conflicting and at times murky. At the same time, daily news headlines can cause investors to lose sight of the big picture in waiting for a negative event to occur that never materializes. By focusing instead on how stocks react to market news as opposed to the news itself, one can gain more confidence in their portfolio and the ability to weather the occasional negativity in the news cycle.

- The median beat rate average is 4.2%.
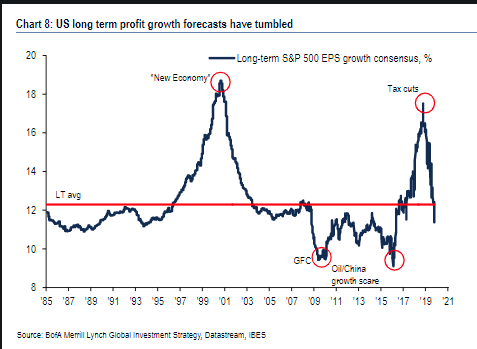
- In Q3 2019, thus far, the beat rate is 4.2%. If the beat rate holds through the remainder of earnings season, the S&P 500 EPS will decline by roughly .5% YoY.