
Welcome to another trading week. In appreciation for all of our Basic Membership level participants and daily readers of finomgroup.com content, we offer the following excerpts from within our weekly Research Report. Our weekly Research Report is extremely detailed and has proven to help guide investors and traders during all types of market conditions with thoughtful insights and analysis, graphs, studies, and historical data. We encourage our readers to upgrade to our Contributor Membership level ($14.99/monthly, cancel anytime) to receive our weekly Research Report and State of the Market videos. Have a great trading week and take a look at some of the materials from within this week’s Research Report…
Research Report Excerpt #1
Coming into 2022, most investors and strategist were highly skeptical and pessimistic about the progress, if any, occurring for the S&P 500. Finom Group’s 4,375 price target projected a double-digit return year and has already been achieved. Below is a review of Wall Street strategists’ price targets coming into 2023:
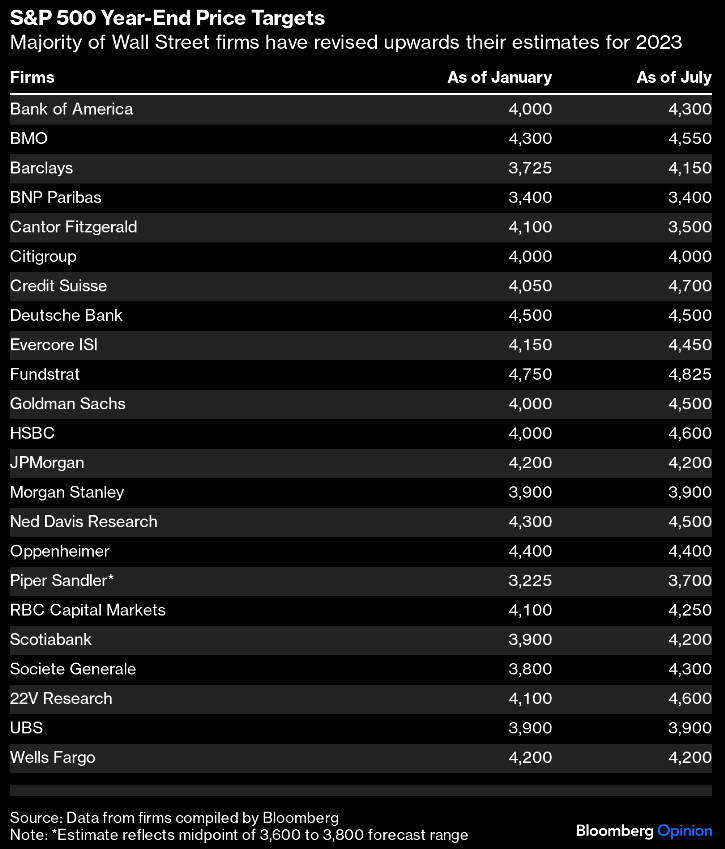
There is nothing like price that can adjust the view of the strategists. That’s not just true of strategists, however, as price has a stimulative or degenerative affect on the human psyche and depending on which way price is trending.
Research Report Excerpt #2
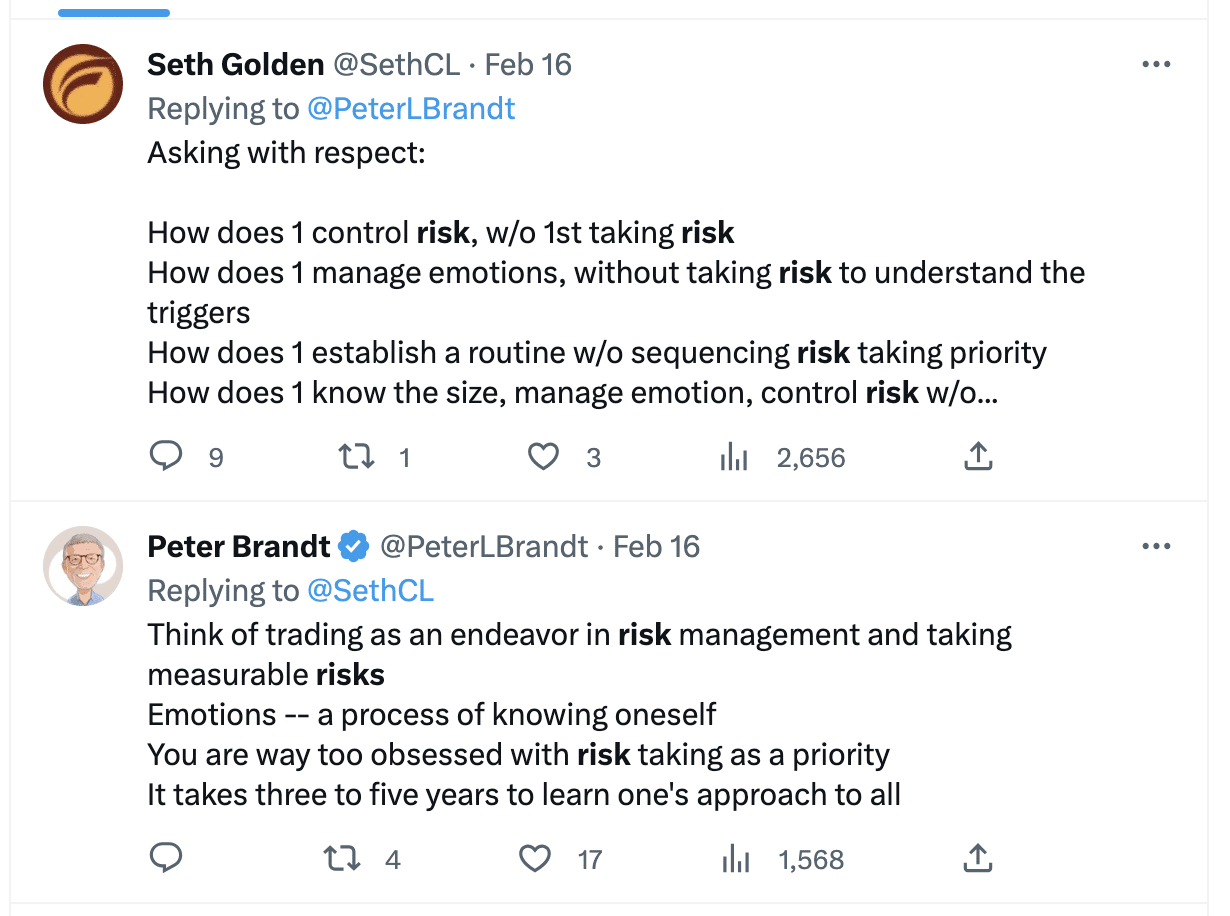
The above tweet engagement is a good back and forth on what risk is, and the practical recognition of risk for investing purposes. It all starts with the willingness to take and feel risk. Without being able to do so, nothing can be stimulated or assessed.
Research Report Excerpt #3
The Nasdaq is more than 20% above its long-term 200-day moving average. While that sounds extremely overbought, it also defines the bullish momentum in the market.
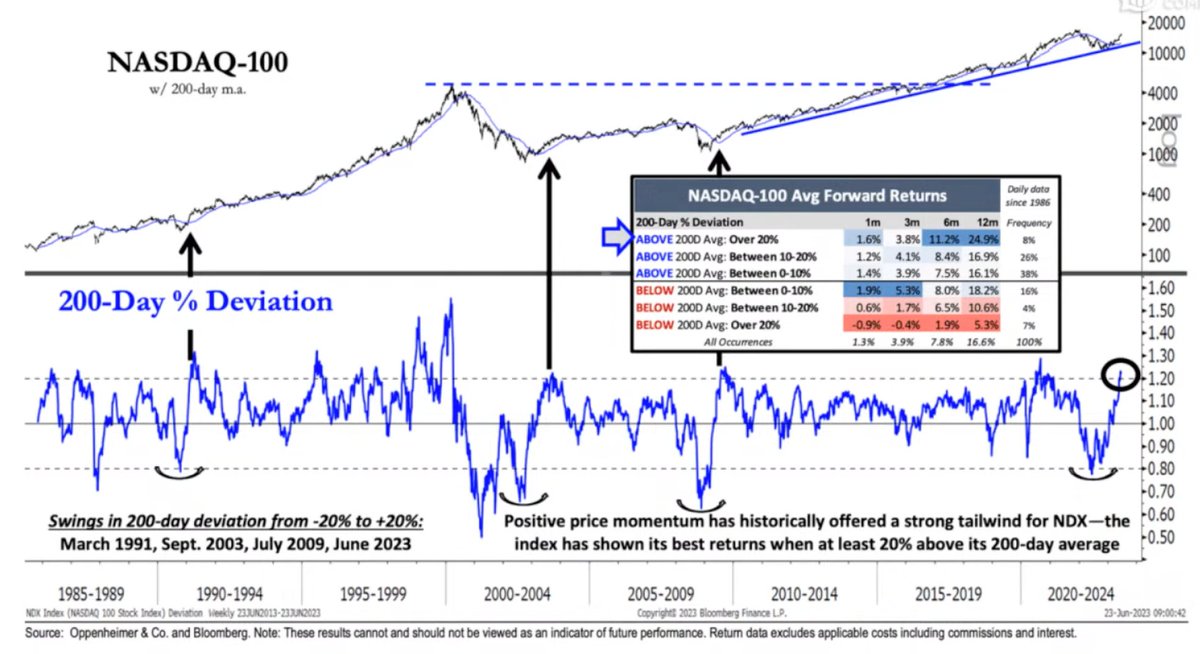
In other words, you might think that YTD gains in the Nasdaq 100 and distance above its 200-DMA are warning signs of overbought conditions, but historically, it is a major buy-signal. The forward 6-12 month gains are 11%/24% on average.
Research Report Excerpt #4
This kind of overbought condition is somewhat unique, but has taken place 12 other times since 1970. The other occurrences are exampled in the chart below from Fundstrat:
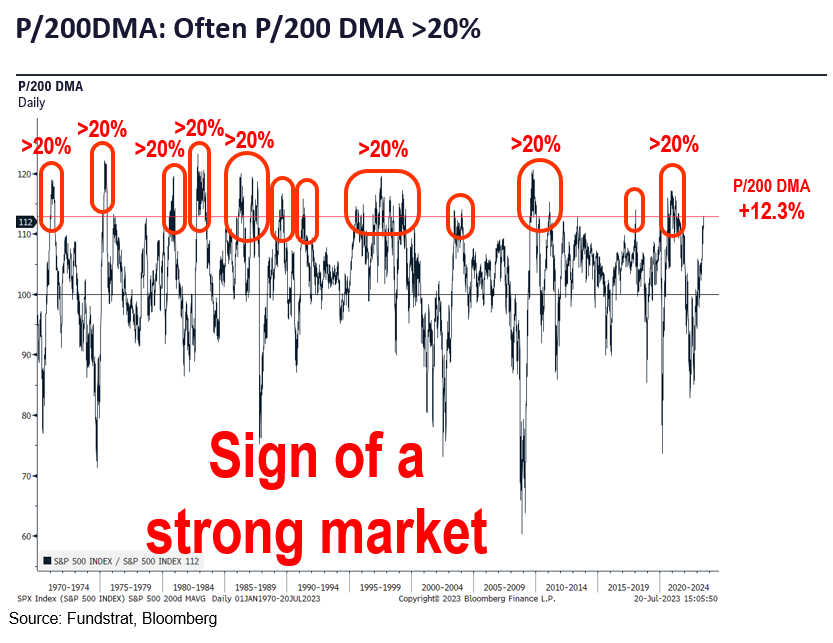
What we are looking to better understand with regards to the overbought conditions is the probability that the S&P 500 price continues to climb relative to its 200-DMA. The chart above clearly answers our question. In 8 of the 12 prior times the S&P 500 was 12%+ above its 200-DMA, 8 of the occurrences found the S&P 500 reaching 20% above its 200-DMA.
Research Report Excerpt #5
As usual, such forecasts and projected analogues based on seasonal data are not guarantees, but probabilities based on historical precedence and patterns.
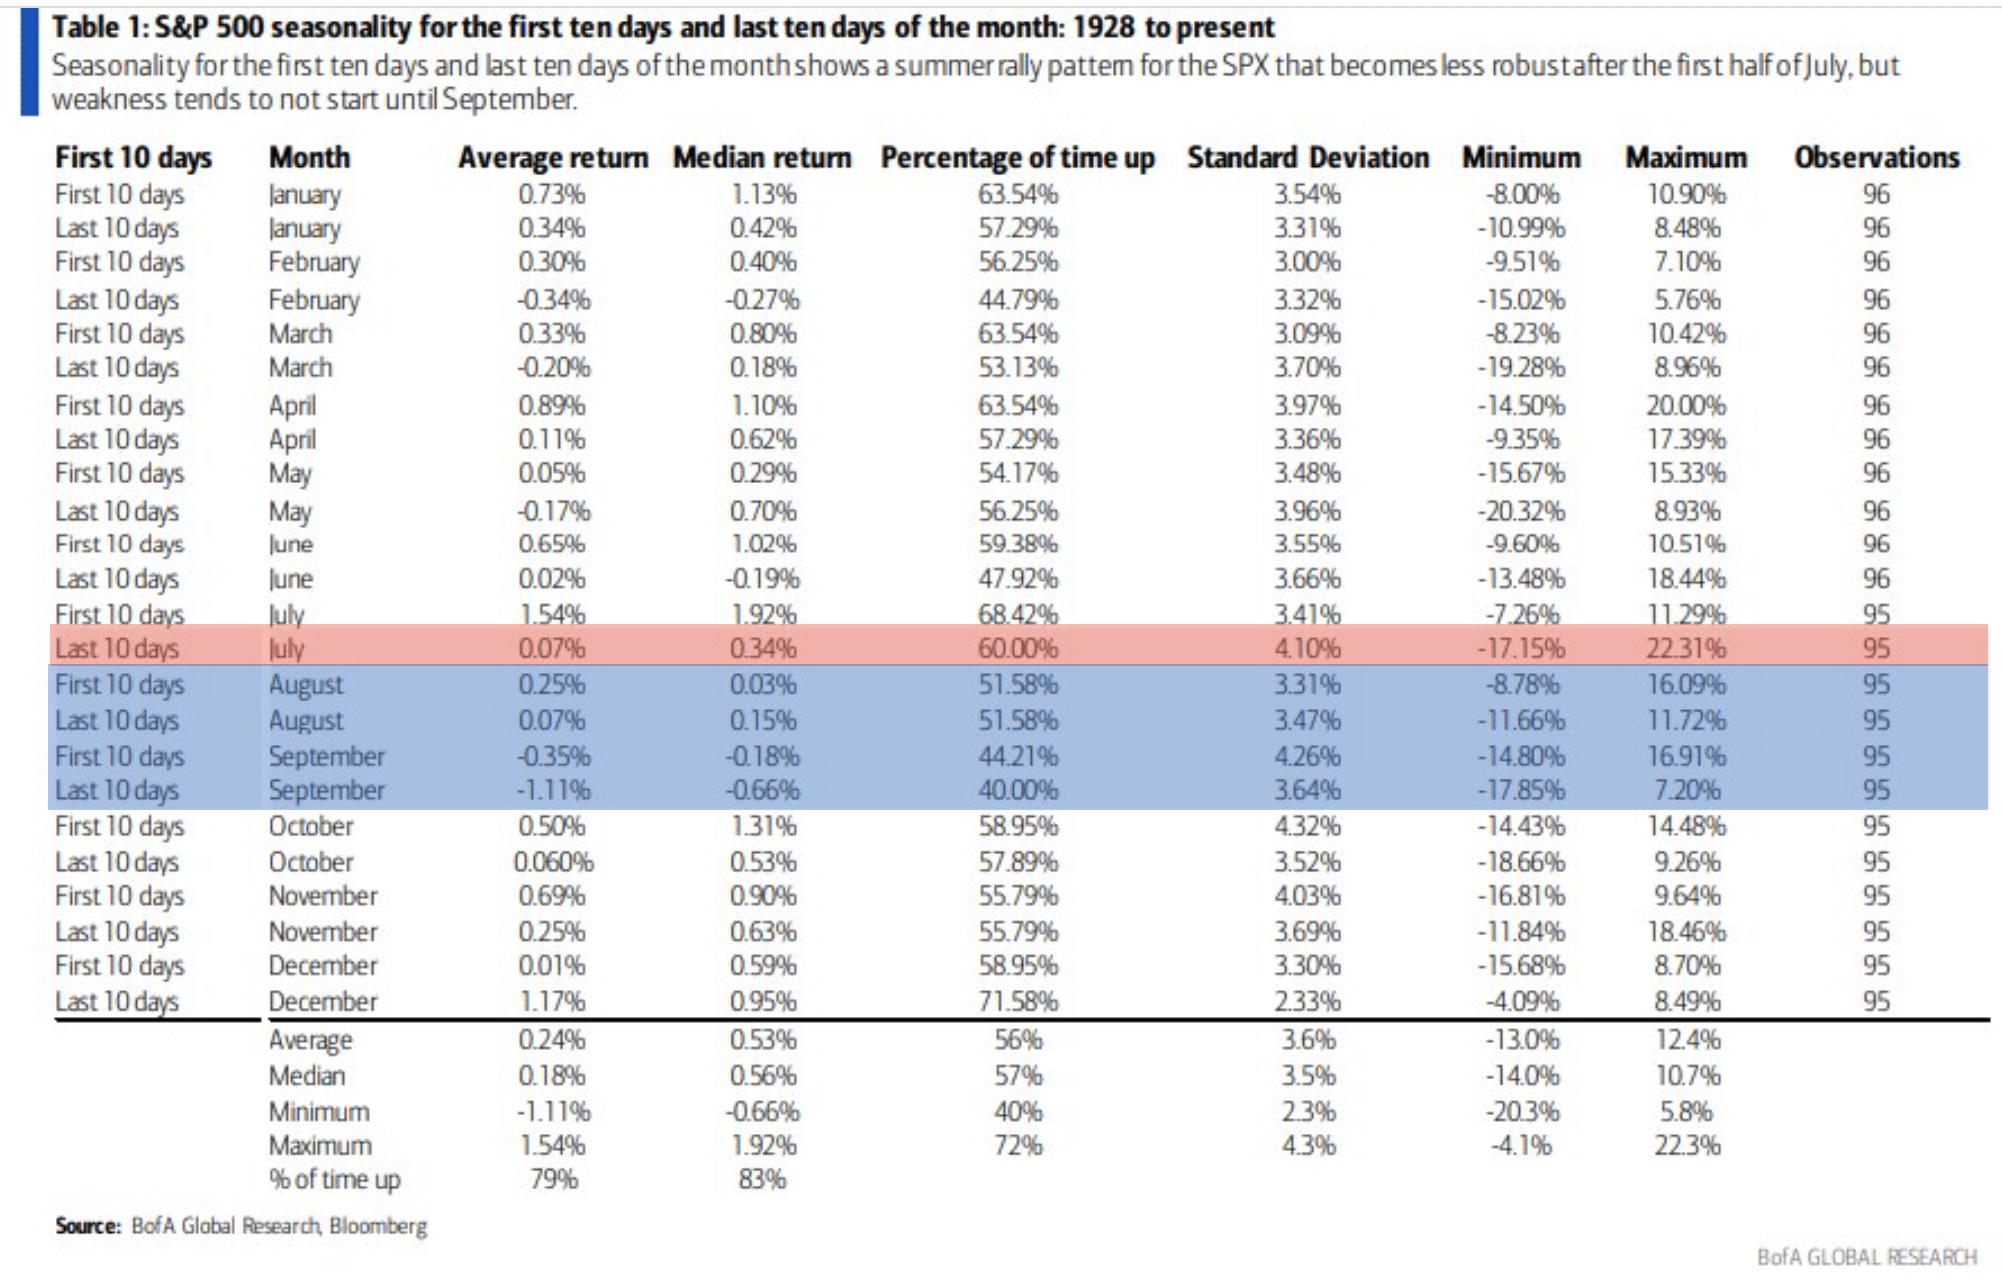
In last weekend’s Research Report, we proved to be one step in front of the crowd, by already considering the possibility that overbought and overheated conditions are edging closer to a seasonally weaker period for markets. Weaker does not guarantee negative returns any more than a slowing economy guarantees a recession.
Research Report Excerpt #6
Given the data, insights, observations and analysis above, I would be ANTICIPATING a 5-7% pullback in the major averages in the Q3 period, but offering such an outcome has a 40/60 probability for the S&P 500 and 50/50 probability for the Nasdaq/Nasdaq 100, in my opinion. There is simply too much momentum, too much consistent rotation informing that “no sector gets left behind”, and too much broadening out of market breadth.
“…we think a bearish market view carries a poor risk/reward balance when we consider our high priority to the S&P’s bullish trend and low priority to market timing. The point is not to miss the forest for the trees—we think long-term reward outweighs near-term risk.”
~Oppenheimer’s Ari Wald
Research Report Excerpt #7
The Health Care and Energy sectors have also been the largest contributors to the decrease in earnings for the index since June 30.
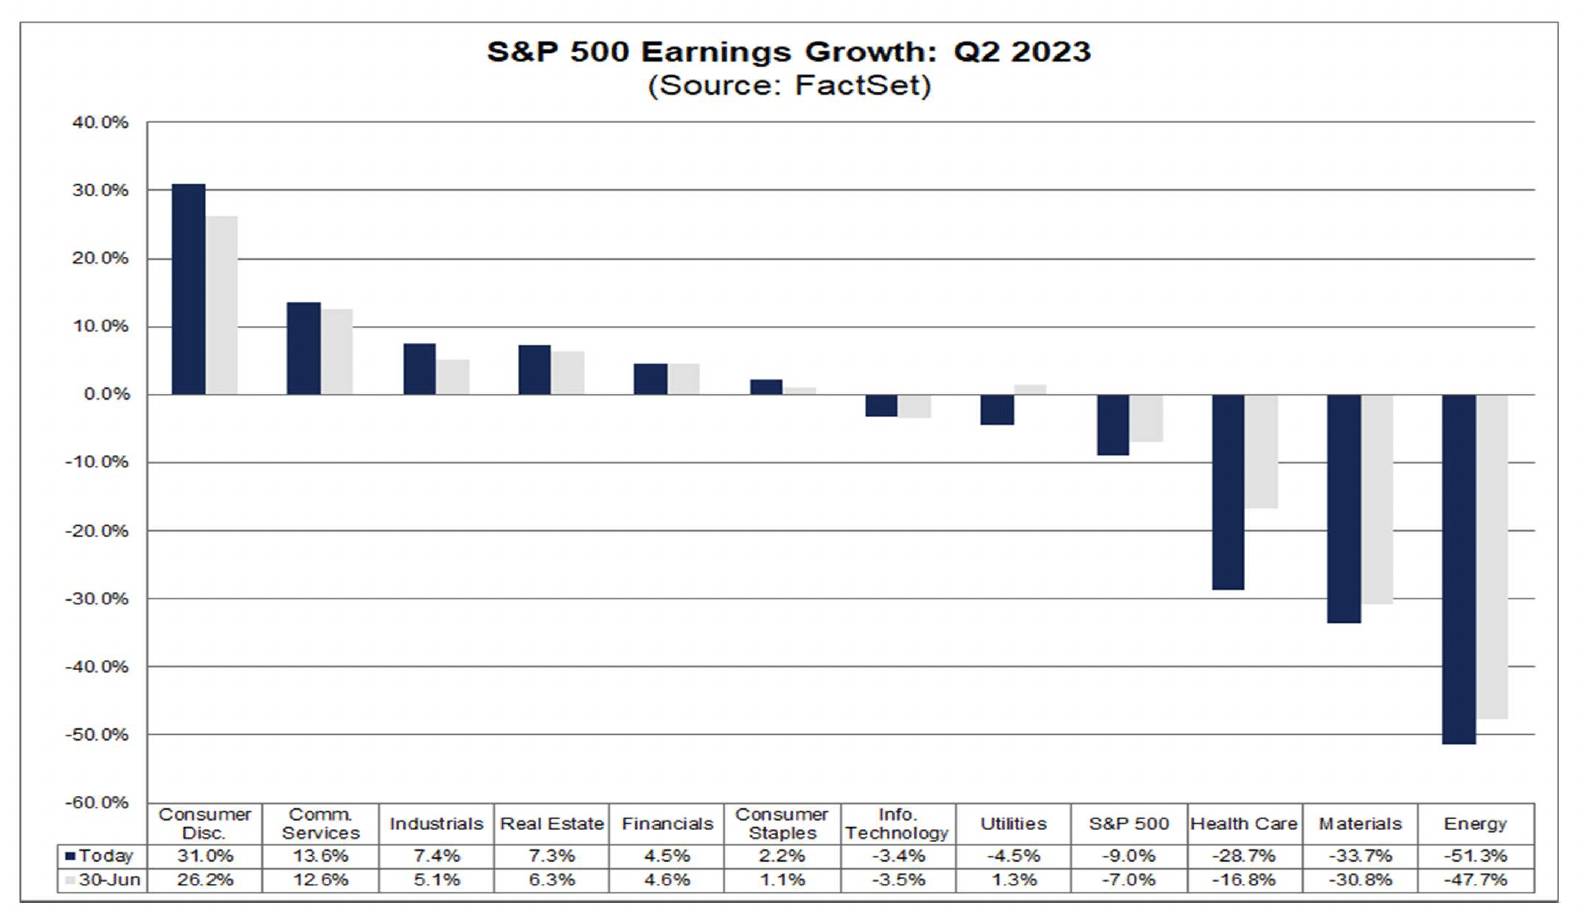
So what has created an even greater decline than formerly projected in Health Care, which is the 2nd largest sector of the S&P 500? In the Health Care sector, downward revisions to EPS estimates for Merck & Co. were the largest contributor to the increase in the earnings decline for the index during the week. Over the past week, the majority of analysts covering Merck & Co. elected to include a $4.00 charge related to the acquisition of Prometheus in their non-GAAP EPS estimates for the company for the second quarter. As a result, the mean EPS estimate for Merck & Co. for Q2 has fallen to -$1.98 today from $1.83 on July 13. Due to the decrease in the mean EPS estimate for Merck, the blended earnings decline for the Health Care sector increased to -28.7% from -17.1% over this period.
Research Report Excerpt #8
The following chart of the LEI and CEI evidences why a recession has not been labeled since the Covid recovery began: (charts from Yardeni Research)
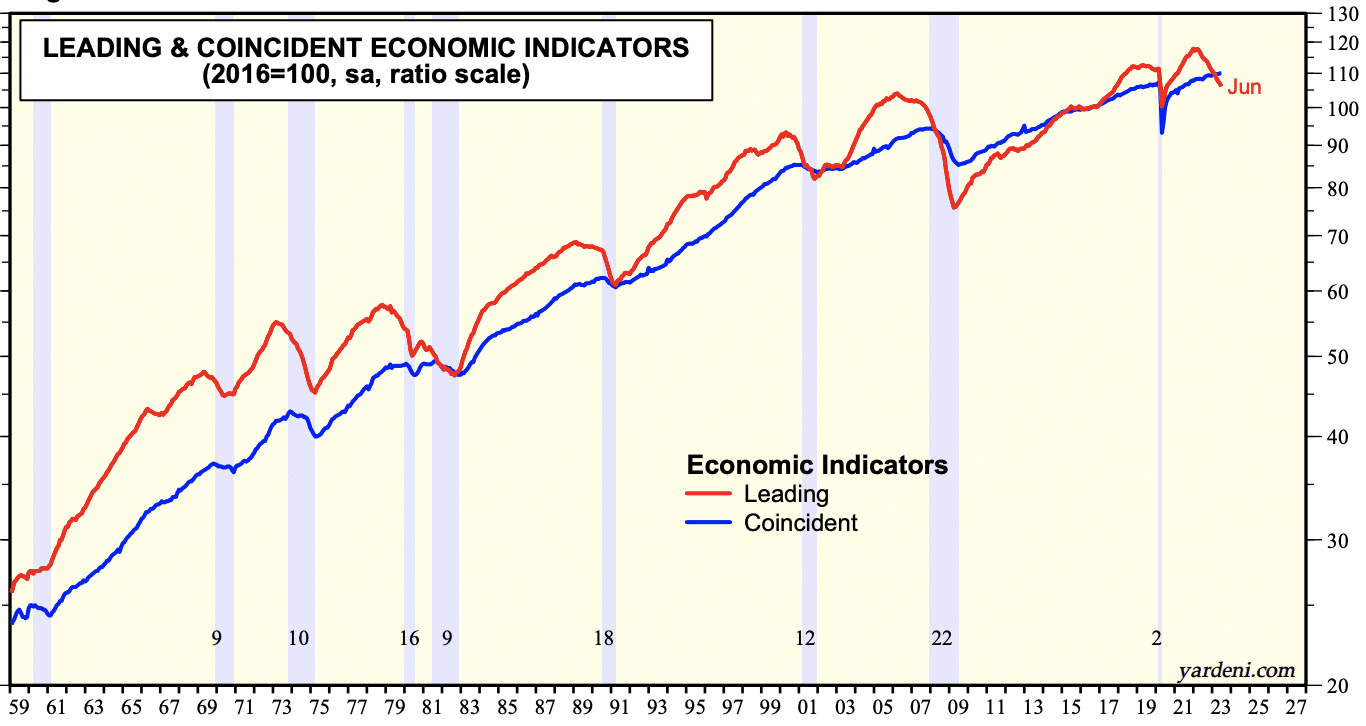
While we have done advanced research on LEI and CEI in the past, the following charts should refresh which economic index is more closely correlated with Real GDP.
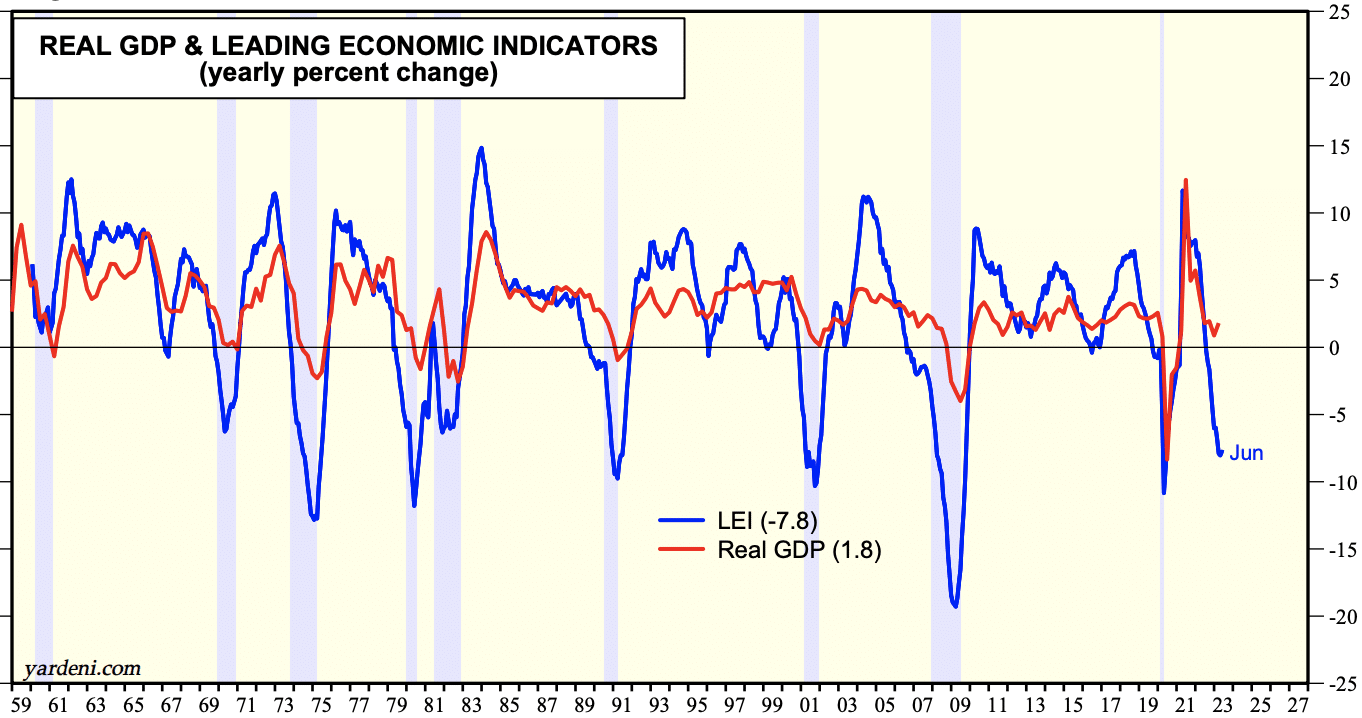
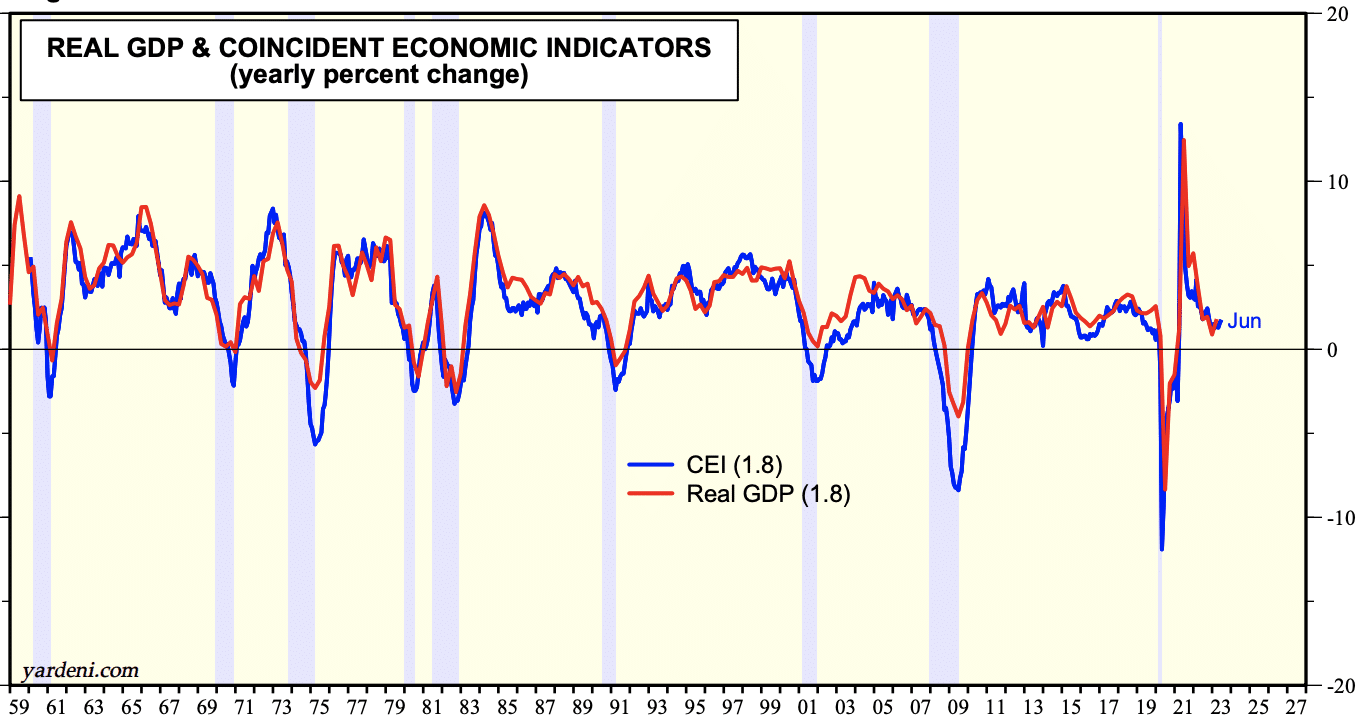
Going back to 1959 and to mine own eyes  , it looks very clear that CEI (bottom chart) has a closer relationship with Real GDP than does LEI (top chart). With this in mind, we can better understand why GDP is currently still trending at a 2% annualized growth rate in 2023
Research Report Excerpt #9
What I can say, however, is that when corporate and consumer balance sheets are as healthy as they have been and seemingly have proven habitually even before the pandemic, and fiscal policy has remained strong… (chart below)
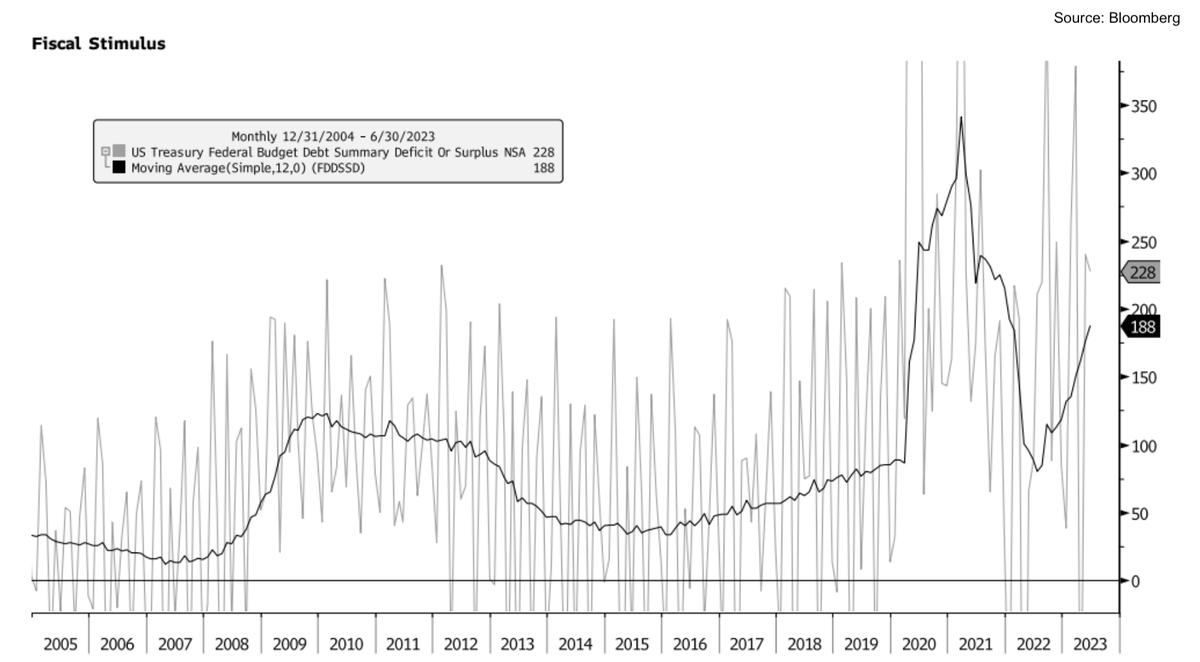
… these are the variables likely throwing off economists’ forecasts over the past year (switching from tightening to easing fiscal policy in H2 2022). While so many have religiously taken to the Fed as their personal punching bag when it comes to monetary policy, the reality is that even as the Fed has been tightening or normalizing monetary policy, the Federal govt. has been easing policy through several fiscal policy initiatives, including the Chips Act.


