
For the week, the Dow eked out a gain of 0.2%, while the S&P rose less than 0.1%. The Nasdaq notched a decline of less than 0.1%, enough to halt a string of two straight weekly gains. A big nothing burger indeed! When it comes to the market and the bear vs. bull debate one thing was made very clear last week: The bull case was better supported with both economic data and earnings reports.
With results from 87 S&P 500 (SPX) members already delivered we can safely suggest that the Q2 earnings season is on track to be as good as what we saw in Q1 2018. This week is particularly busy with more than 750 companies reporting results, including 175 S&P 500 members. Some of the major earnings reports are noted in the graphic below.

Everyday there is at least one major tech company reporting results this coming week, beginning the week with Alphabet’s (GOOGL) earnings after the bell on Monday. Midweek we’ll get results from Facebook (FB) and PayPal (PYPL) and on Friday we’ll cap the week with results from Twitter.
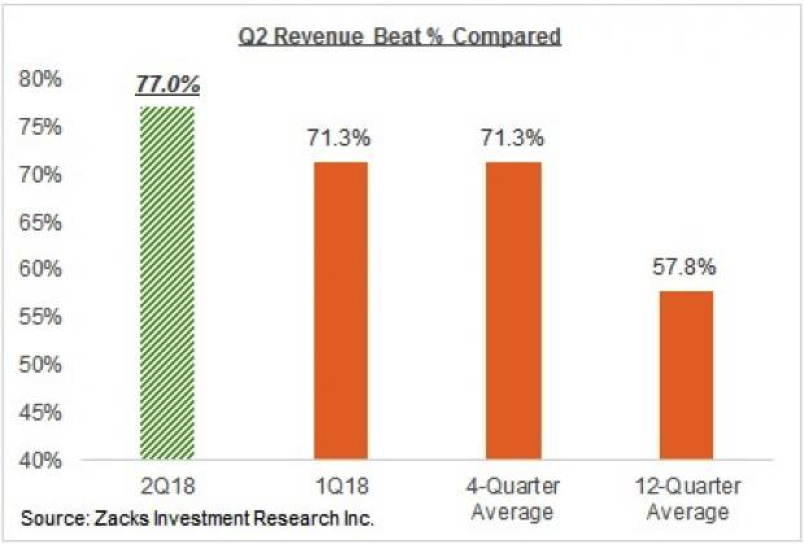
The proportion of companies beating Q2 revenue estimates is tracking significantly above any other recent period. The chart below identifies that the proportion of companies beating revenue estimates is tracking 20% above the average over the last twelve quarters.
We’ll discuss the earnings picture a little bit more and with the most recent data tracking forecasts, but it’s clear that even though earnings are finding the bull case stronger, the market is somewhat snubbing the results. The reason for the proverbial snub might be due to all the geopolitical strife that continues developing, which tends to favor the bear case. In this scenario of growing geopolitical strife, multiple contraction has the bears pushing forth the narrative that markets may have peaked.
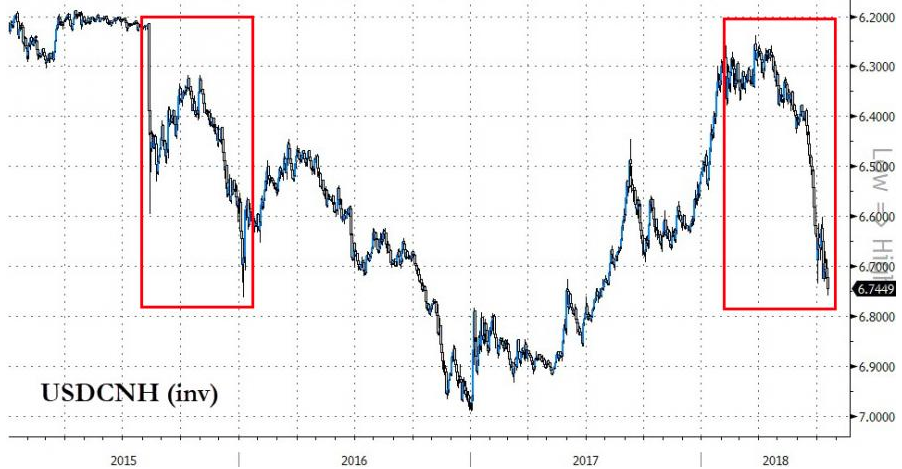
The most recent subject matter stealing some of the luster and spotlight from earnings season is the Chinese currency, the Yuan. The Yuan has dropped sharply in the last couple of months. Offshore Yuan is now at 12-month lows, down almost 9% from the March highs and collapsing at an annualized pace of around 30 percent. That is a faster plunge than the 2015 post-devaluation slide of roughly 23% annualized.
With the sharp devaluation in the Yuan, the top policymakers seems to have shifted its view towards the Chinese currency over the past three weeks. On July 3, five PBOC officials commented on the currency, ahead of the deadline of US tariffs on $34 billion Chinese products. Following the remarks, the falling Yuan paused at around 6.70. However, the daily fixing set by the regulator was weaker than the forecast calculated by Caixin news with PBOC’s formula. This may be because a relatively weak Yuan could help to make up some Chinese exporters ‘losses caused by US tariffs, amid the on-going US-China trade war.
The Yuan’s devaluation is nothing new, but the rate of the devaluation and reasons for the devaluation might be. Bloomberg notes that China’s shock Yuan devaluation in 2015 “provides a good template for what the contagion might look like” according to former Goldman head FX strategist, Robin Brooks, who is currently chief economist at the Institute of International Finance.
“Risk assets and oil prices would likely tumble as worries about growth arise, hitting currencies of commodity-exporting countries particularly hard — namely, the Russian ruble, Colombian peso and Malaysian ringgit — before taking down the rest of Asia.
Asian central banks will initially try to stem currency weakness through intervention,” Brooks said. “But then Asian central banks will step back, and in my mind, the big underperformer on a six-month horizon could be EM Asia.”
Goldman then discusses how Trump’s jawboning of the Fed will impact both the Fed’s outlook on the global economy and negotiations with foreign nations:
“The evolution of the conflict to more directly focus on FX would be consistent with how major trade disputes have played out in the past—often involving negotiated Dollar weakness—as well as the Administration’s goal of reducing the US trade deficit. We do not think the President’s comments on the Fed affect the outlook for US monetary policy. However, they could impact how other countries are approaching trade disputes, either by bringing them to the negotiating table or affecting currency policy directly.”
As depicted, while the issues concerning the Yuan have been developing over the last 60 days or so, they have finally made their way into the forefront of investor minds. If in fact we are still a global economy, interdependent on the stability of global economic activity and currencies then we have to weigh the contagion risks from a Yuan fall-out.
Whether it is the Yuan devaluation, trade spats/wars, midterm elections and an unclear agenda from the White House, investors are left with a great deal to consider. Many fund managers, with regards to corporate global profits don’t believe global net profits will improve from this point going forward according to a recent BofA Merrill Lynch fund survey depicted below.
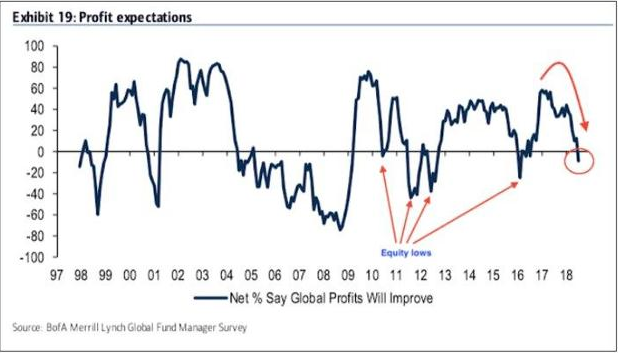
From the survey, it’s clear that profit expectations are near their lowest level since 2016. And we all know how global profits have performed since that time. One thing the surveys show is that, by and large, nobody is in love with the bull market or has a profound bullish bias toward corporate profits.
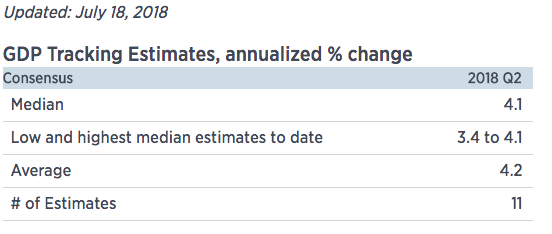
While earnings will be the focus of trading this week, with a close eye on the Yuan and Chinese markets, GDP will be the highlight of the economic data to be reported. Most economists are expected Q2 GDP to accelerate from Q1.
In terms of Q2 GDP forecasts, let’s take a look firstly at the CNBC Rapid Update, which offers a new measure for how much an economic report changes the outlook on Wall Street for U.S. growth forecasts. With each major report that impacts Gross Domestic Product, Moody’s Analytics and CNBC measure how much the new data changes the average tracking forecast among a select group of Wall Street economists.
Switching gears, somewhat, for the moment we find ourselves discussing matters surrounding market volatility and SKEW. We recognize that the VVIX (volatility of volatility) has been heading higher and is above the 100 level presently. While elevated, it doesn’t forecast immediate danger, but it is something to take note of as we recognize very clearly there are outsized buyers of call options, pushing VVIX higher.
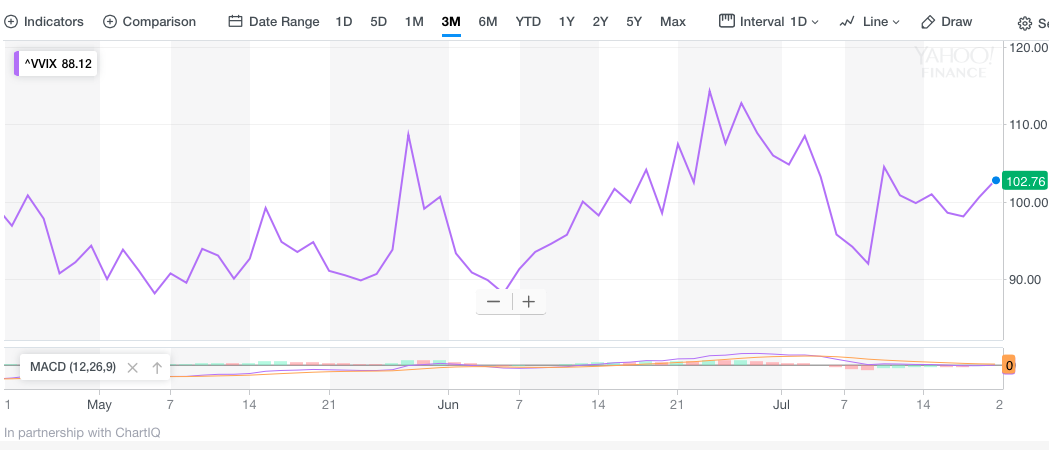
How do we define the current level of activity within the VVIX. Basically it suggests that the recent rally in the SPX is either extended or not finding believers. Now let’s talk about SKEW!
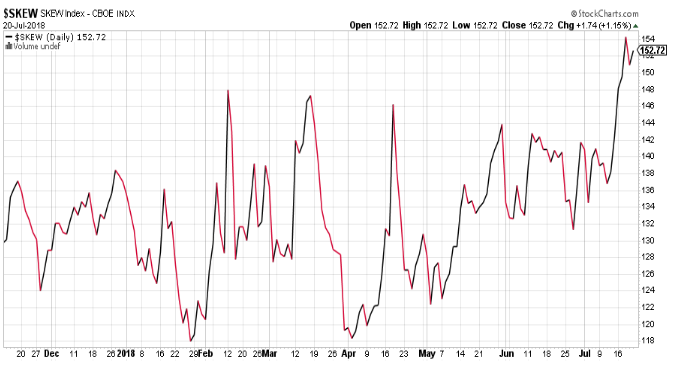
So what is SKEW? The CBOE’s SKEW Index measures potential risk for the financial markets over the next 30 days. It has been in existence since 1990. When the SKEW Index spikes, conventional “wisdom” assumes that there’s a greater chance of a major event occurring in the financial markets. The SKEW Index typically ranges from 100 to 150. The higher the value, the greater the chance of a major market event.
Skew is the measure of OTM puts vs. OTM calls, when skew is high (just shy of record amounts recently) there are buyers of puts in SPX who are also sellers of calls, which causes a distortion resulting in the skew metric. The activity drives implied volatility higher in the S&P 500. So why is the SKEW so high (above 150)? It is high due to hedging activity: Record numbers of traders are hedging. So let’s look at just how high SKEW is presently or has risen to recently.
Most investors and analysts will outline that spikes in SKEW are bearish, but that is historically inaccurate. SKEW has been consistently higher from 2014-present. The SKEW’s track record as a bearish sign is not good. SKEW has been consistently higher while the S&P 500 has trended higher over time. The table below, offered by Troy Bombardia of Bullmarkets.com identifies what has occurred when SKEW spikes above 150 in each of the other 4 occurrences.
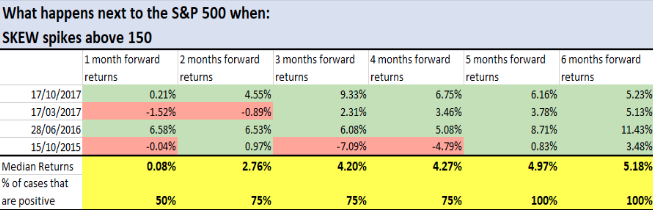
While the longer-term market reaction to the measured SKEW is undeniably bullish, the near-term reaction may certainly breed a different outcome. Finom Group believes much of the hedging activity is centered on this coming week’s earnings reports that are “skewed” heavily toward some of the biggest tech stock earnings reports. Investors seem to be preparing for reports from the most heavily weighted tech stocks like Alphabet, Amazon and Facebook this week.
Switching gears from SKEW to earnings, although the two may be intermingled given the aforementioned discussion, earnings forecasts continue to rise for the S&P 500 Q2 reporting cycle. In our most recent research report we offered the following commentary on the upwardly revised earnings outlook from Reuters.
“Prior to last week’s bank reporting season commencement, Reuters was forecasting S&P 500 Q2 2018 earnings to grow 20.7% and now that has been revised higher to 20.9%, as shown in the table above. Finom Group continues to believe that S&P 500 Q2 2018 earnings will come closer to expressing 22% earnings growth once the earnings period is concluded.”
So now let’s take a look at Thomson Reuters most recently revised Q2 2018 S&P 500 earnings forecast.
Aggregate Estimates and Revisions
- Second quarter earnings are expected to increase 22% from Q2 2017. Excluding the energy sector, the earnings growth estimate declines to 18.2%.
- Of the 87 companies in the S&P 500 that have reported earnings to date for Q2 2018, 83.9% have reported earnings above analyst expectations. This is above the long-term average of 64% and above the average over the past four quarters of 75%.
- Second quarter revenue is expected to increase 8.3% from Q2 2017. Excluding the energy sector, the revenue growth estimate declines to 7.2%.
- 6% of companies have reported Q2 2018 revenue above analyst expectations. This is above the long-term average of 60% and above the average over the past four quarters of 72%.
Thomson Reuters has increased their forecast since May and for the Q2 period to where it rests at 22% expected EPS growth YOY…until further notice.
The financials greatly outperformed expectations recently with a few banks still set to report earnings early this coming week. All eyes will be on big-tech and information technology earnings this week.


