
In all my 22 years of investing and following markets both domestically and abroad, I’ve not come across this many perplexed market participants, and why. Markets have been sending a number of mixed signals since running equities have set record levels in 2020 and while demonstrating extreme sentiment and overbought conditions. The overbought conditions were briefly found with a one-week pullback of roughly 3% in the S&P 500 (SPX), but which was quickly reversed in the following week by greater than a 3% rally to more record levels. Even with the unknown impact from China’s spreading coronavirus, the market rallied to new record levels on Monday as the S&P 500 closed above 3,350 for the first time ever. The following commentary from Canaccord Genuity’s chief equity strategist Tony Dwyer probably highlights the confounding resiliency of the equity market in the first couple of months of 2020:
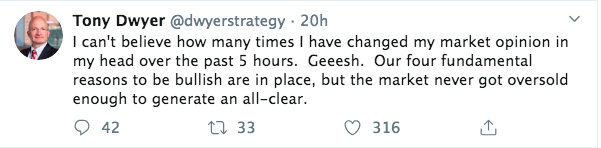
Tony Dwyer had downgraded his market outlook two weeks ago as overbought conditions begged of a distribution phase of sorts. And that distribution phase was achieved but only with a 3% pullback and for a brief respite in general market sentiment that went from extremely bullish to neutral. The rapidity for which the distribution phase culminated and was found with new record highs thereafter, on the S&P 500 and Nasdaq (NDQ), has left market participants wanting for greater relief of upward pressure and stretched valuations once again.
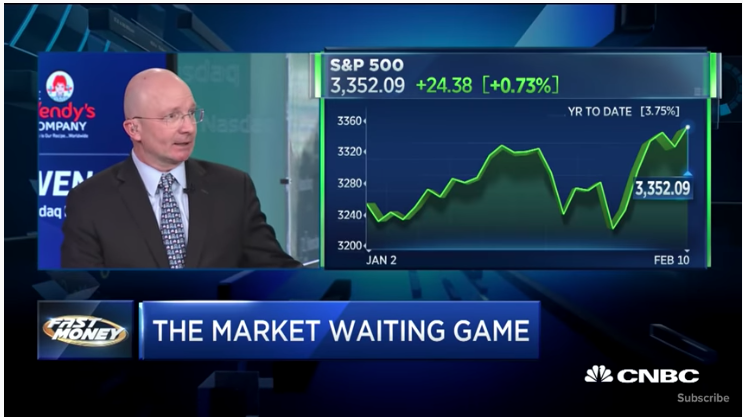
Dwyer recently admitted he’s at a loss for the near-term market outlook, as markets seemed to be defying fundamental and technical risks. In his latest on-air commentary via CNBC’s Fast Money show, Dwyer details that he still isn’t confident in tactile positioning presently.
Finom Group has recognized that the bond market and VIX complex had been reflecting global economic concerns, but to-date, the equity market has largely ignored the macro concerns. Equity markets continue to reflect the rising probability that earnings estimates for 2020 may in fact be too low. The earnings picture has been one that anticipates a rebound in EPS growth for FY2020 of roughly 9.5 percent according to both Refinitiv and FactSet. Having said that, given the beat rate and overall better than anticipated Q4 2019 EPS and revenue growth to-date, investors have continued to bid up some of the mega-cap growth stocks through the earnings reporting season.
The blended (combines actual results for companies that have reported and estimated results for companies that have yet to report) earnings growth rate for the fourth quarter is 0.7%, which is above the earnings decline of -0.5% last week. Positive earnings surprises recorded by companies in the Communication Services sector were mainly responsible for the increase in the overall earnings growth rate during the week.
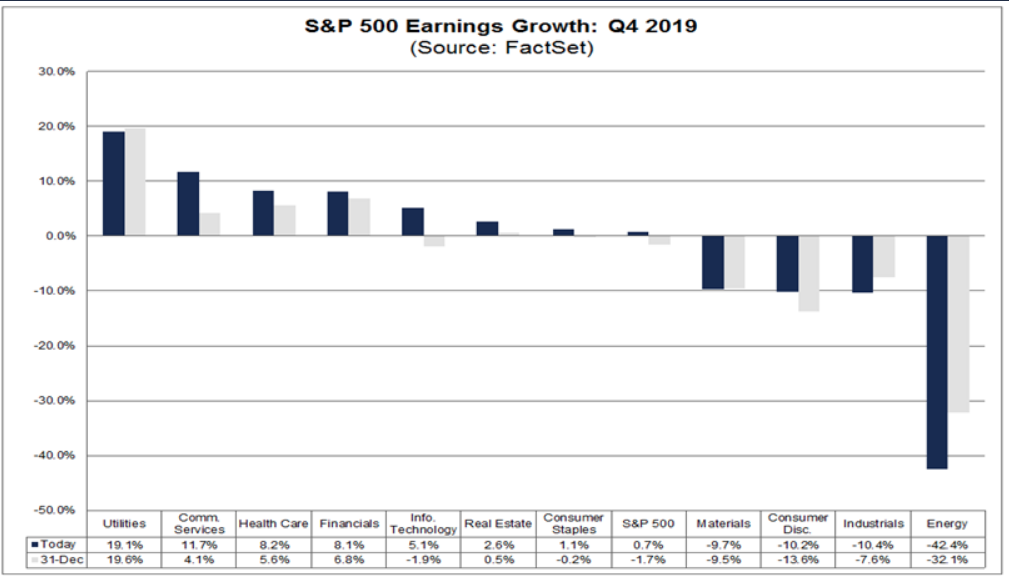
According to Refinitiv, the forecasted Q4 2019 EPS growth will come in even higher than the .7% growth tracked by FactSet.
- Fourth quarter earnings are expected to increase 2.3% from 18Q4. Excluding the energy sector, the earnings growth estimate is 5.1%.
- Of the 322 companies in the S&P 500 that have reported earnings to date for 19Q4, 70.5% have reported earnings above analyst expectations. This compares to a long-term average of 65% and prior four quarter average of 74%.
- 19Q4 revenue is expected to increase 5.0% from 18Q4. Excluding the energy sector, the growth estimate is 6.2%.
Market participants have been complaining about the S&P 500’s forward looking P/E multiple over the last month or so and since it has stretched to a cyclical high of 18.8. With this in mind, it is important to recognize that using valuation as an investment tool for the benchmark index may prove a faulty exercise. With yearly rebalancing of the S&P 500, higher growth sectors have proven to dominate the index and stretch valuations over time. What looks expensive today, may prove cheap going forward.
The Tech and Telecom sectors combined make up 34.7% of the S&P 500’s market cap which is higher than average and median, but still below the almost 45% high from the tech bubble.
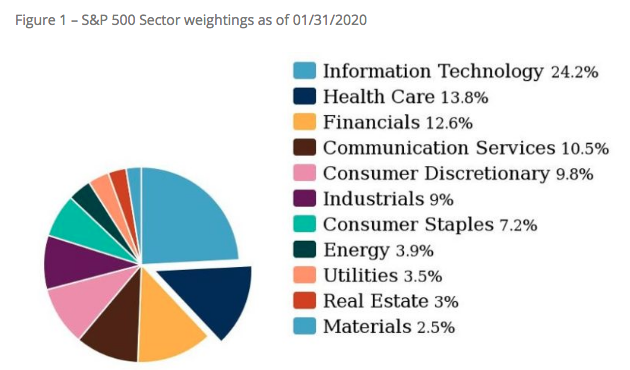
- More expensive valuations for the S&P 500 as a whole make more sense when considering the most heavily weighted sector is now technology, with high-growth companies in this sector tending to trade at higher multiples relative to corporates in other groups.
- Technology sector companies are trading at 22.5x 2020 earnings while components of the financial and health care sectors – the cheapest groups – are trading at 13.2x and 15.9x this year’s earnings.
- At the start of 2010, Technology was 18.7% of the S&P 500. On an apples-to-apples basis Tech is now 27.5% (with Google which is now Comm Services but was in Tech in 2010, but not Facebook because it was only added in 2013). Throw in Facebook, and you get a 29.4% weighting today.
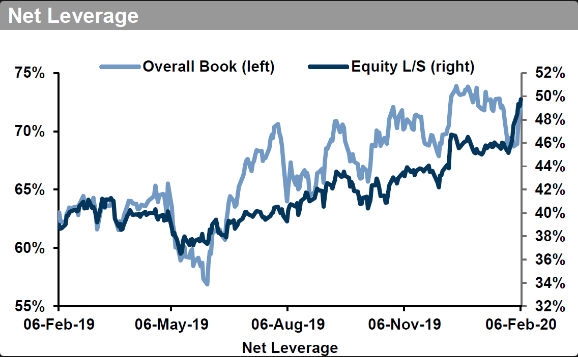
We don’t dismiss frothy valuations still persist compared to the 5 and even 10-year average P/E, but price and process matter most to investors and as price has moderated back to record levels, we still see fund managers chasing the market by increasing equity exposure. Fighting this market’s bullish trend for any overarching macro concerns, even those that have found 50 million Chinese civilians quarantined and much of the economy halted in the region, has proven to the detriment of the trader/investor.
Many economists and strategists continue to express concerns over the market’s resiliency and valuation given the unknown affects from the coronavirus epidemic. J.P. Morgan recently downgraded its economic growth outlook for the U.S. and global economy due to the coronavirus.
- We continue to markdown Q1 global and regional growth significantly, while adding China policy easing and projecting recovery in Q2 and Q3. Hence the limited adjustments to market forecasts and to strategy. Conviction around these views is higher over the quarter than over the next couple of weeks. The coronavirus infection rate has slowed substantially over the past two weeks but is still rapid enough to allow only partial reopening of Chinese factories. Thus a demand shock deepens while a supply shock begins. At the index level, no market carries a risk premium for sustained disruption.
- Because China’s factory shutdown has broadened over the past ten days and because the nCov infection rate has not slowed sufficiently to allow a full reopening on February 10th, we’ve lowered targets again and more substantially. The China forecast for Q1 now slows from 4.9% to 1%, but Q2 rises from 7% to 9.3%. The full year number falls from 5.8% to 5.4%.
The outlook for Q1 in China’s economy may prove to weaken, J.P. Morgan denotes the FY 2020 outlook will likely improve on the heels of continued PBOC stimulus. As such, the firm suggests any equity market dips should be used as opportunities to increase equity exposures both domestically and abroad.
“Our global equity strategists believe the fundamental backdrop remains constructive for the equity markets. The coronavirus outbreak is a potential source of further short term volatility; however, the China growth impact is likely to be more about the readjustment of H1 trajectory, rather than materially hurting the full year growth numbers. PMIs should be higher in 2H vs current on stronger money supply, reduced inventories, trade ceasefire, and on a potential for more vigorous Chinese stimulus. Earnings momentum is improving, with robust Q4 results, labour markets remain very strong, and central banks extremely accommodative. Our strategists stay with the view that stock indices will make further all-time highs before the next US recession strikes.”
Finom Group is in agreement with the assessment offered by the analysts at J.P. Morgan, although the buy-the-dip moment may be met with another dip on the near-term horizon. At present, there are many signs of market froth coupling with breadth weakness or divergences. In terms of froth and where the overwhelming market strength has been coming from in this snapback rally to record-level highs, technology stocks have been the main driver for markets.
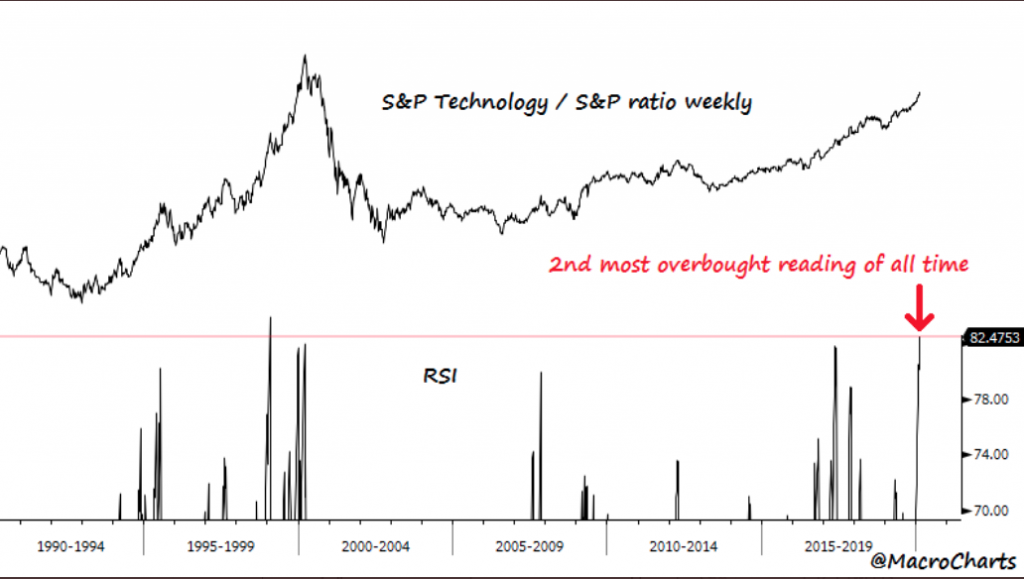
The Tech/S&P ratio weekly RSI just hit the 2nd most overbought reading of all time (30 years). One might say that it doesn’t get much more extreme than this, with respect to overbought conditions. Only one week ever closed higher than the current ratio, January 29, 1999, which then produced the start of a five-month long 15% correction. This is not to suggest history will repeat itself, but rather to define what has proven to be historically overbought conditions.
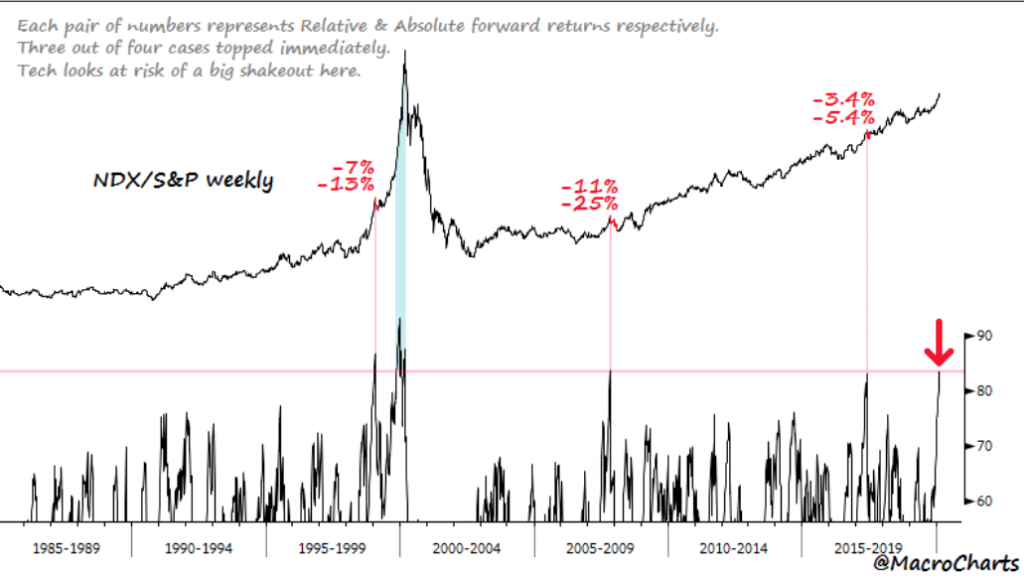
Another measure of market breadth that has proven to extend market frothiness is the Nasdaq/S&P 500 ratio weekly RSI. As of Monday, the RSI is in the top 1% most overbought weeks of all time (35 years). According to the MacroChart tracking, prior cases led to *immediate* relative & absolute losses. The only exception to such immediate losses was the Y2K Bubble.
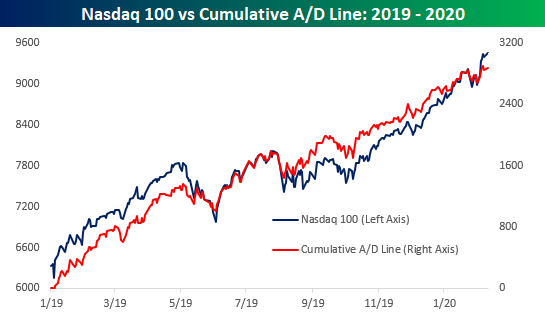
While we have already discussed record levels in the S&P 500, the Nasdaq record levels are showing signs of a potential near-term top. Even though the Nasdaq 100 is at new highs, the cumulative A/D line is marginally lower than its high last week. As shown in the Bespoke Investment Group chart below, this is not a large divergence, but does illustrate the fact that some of the largest stocks are carrying the index while the smaller names are not moving higher. .
(Click on image to enlarge)
Moreover, the broader Nasdaq Composite itself, which includes a much larger universe of smaller companies, is showing a much more identifiable divergence. In this example of index breadth, the Nasdaq’s cumulative A/D line saw a much larger pullback than price during the most recent pullback, and the magnitude of the bounce last week and into Monday had been relatively small. This is something we think bears attention going forward. Something is obviously brewing beneath the surface of the Nasdaq.
(Click on image to enlarge)

Outside of the Nasdaq, the S&P 500 and NYSE are both showing signs of weakening underneath the hoods. As shown in the charts below, the S&P 500 is at new highs, but less stocks are rebounding above their moving averages.
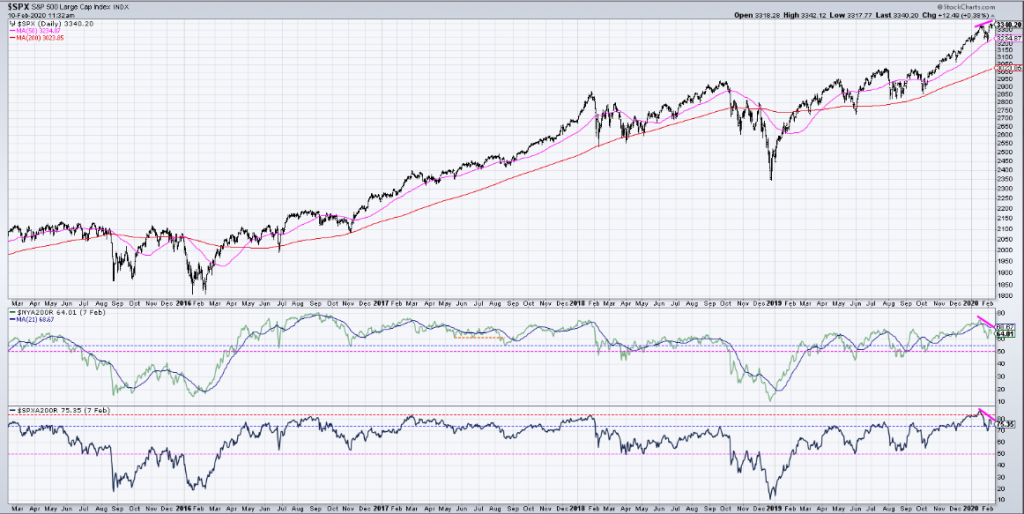
Both the NYSE and S&P 500 Advance/Decline lines have weakened while the S&P 500 hits new record highs. One thing we don’t want to dismiss is that while the divergences are noted in the bottom two boxes and outlined in the Nasdaq, divergences do not translate to “sell signals”. Just because divergences are presented in these varied breadth indicators, the weakening is still in keeping with strong overall breadth levels. We would need to see breadth weaken further to suggest a sell signal.
One of the ways we can validate that breadth, while weakening, remains at strong levels is by way of sector and index ETF levels. Most every sector ETF (shy of Energy (XLE)) are above their respective 50-DMA.
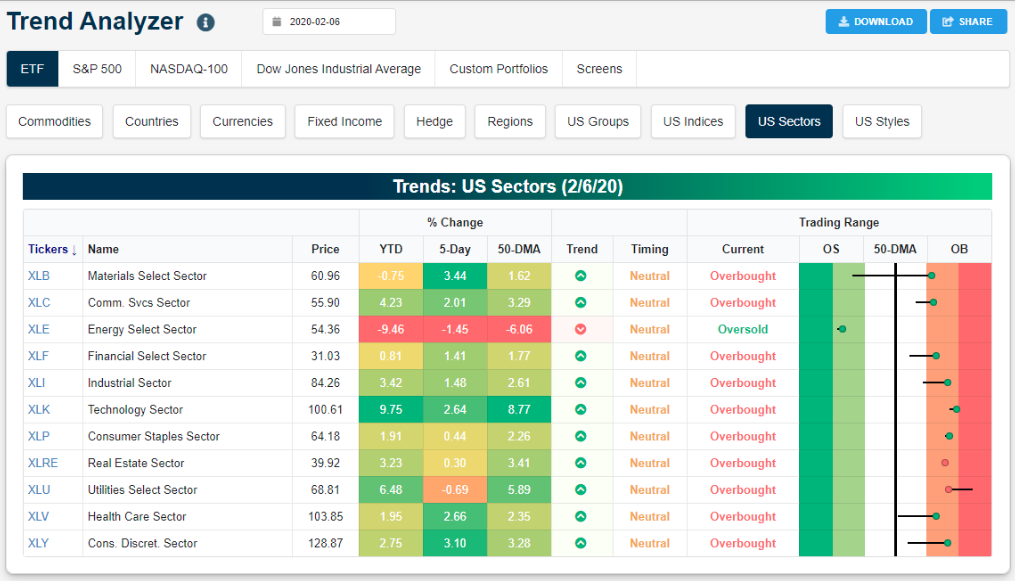
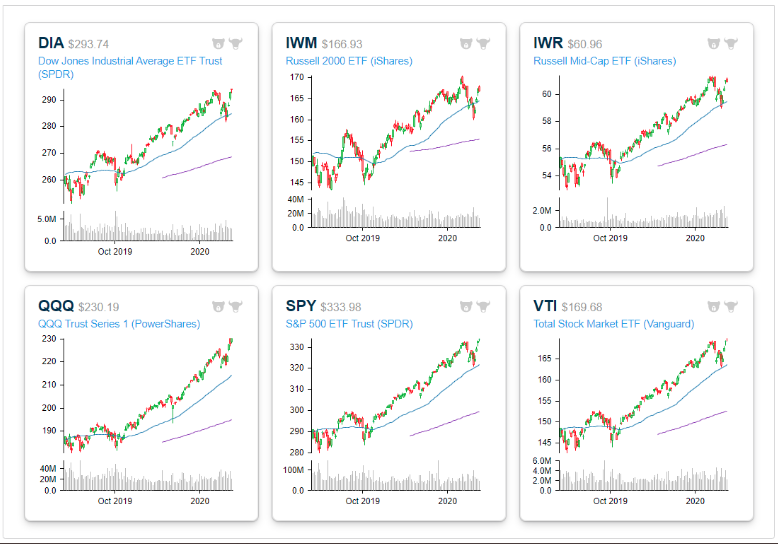
Not only are most sector ETF’s above their 50-DMA, but they are advancing further away from the 50-DMA. The same can be said for the index ETFs as shown below:
While Finom Group does not discount that markets appear overbought and breadth is indeed weakening, the process of rebalancing during the uptrend in the major averages may prove a prudent exercise rather than indiscriminate selling. Price and process matter most to disciplined investors/traders.
Markets are apparently looking through any Q1 2020 impacts from the coronavirus, the duration of the uptrend underlines equity market strength. It’s been some time since the market has exacted a 10% correction.
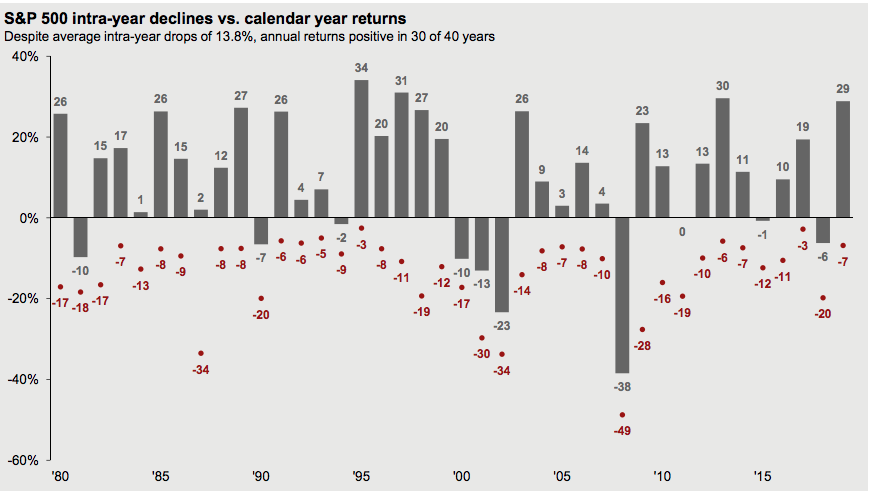
As depicted in the chart above, the average year dating back to 1980 has expressed a pullback of roughy 13.8% intra-year. A textbook correction of 10% was avoided throughout 2019. In fact, it has been 409 days since the last 10%+ correction. This, however, is only 1/6th as long as the 2,553 days without one from October 1990 through October 1997 (on a closing basis, chart from Bespoke Investment Group).
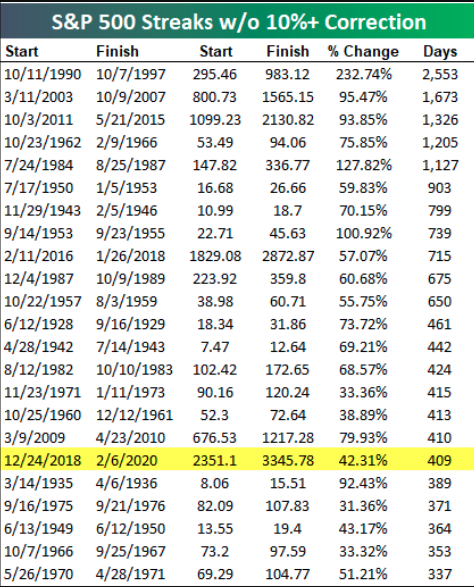
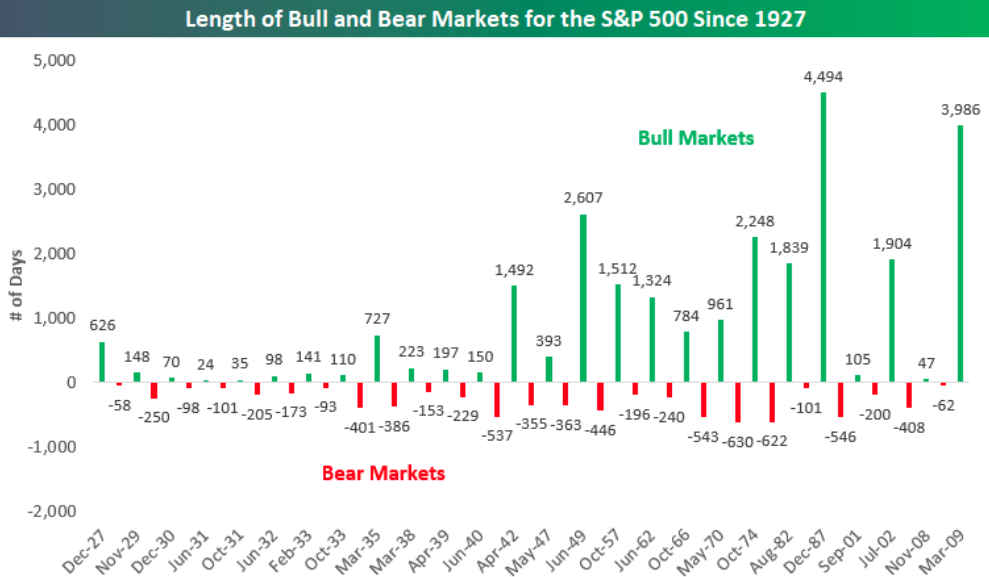
As shown in the table above, 10% corrections have been hard to come by since the Great Financial Crisis, but a 20% bear market has proven even more difficult. With a new high on Monday, the S&P 500 extended the number of days since the last 20%+ decline (closing basis) to 3,988 days. We have to get to June 29th, 2021 to eclipse the late 80s/90s record.
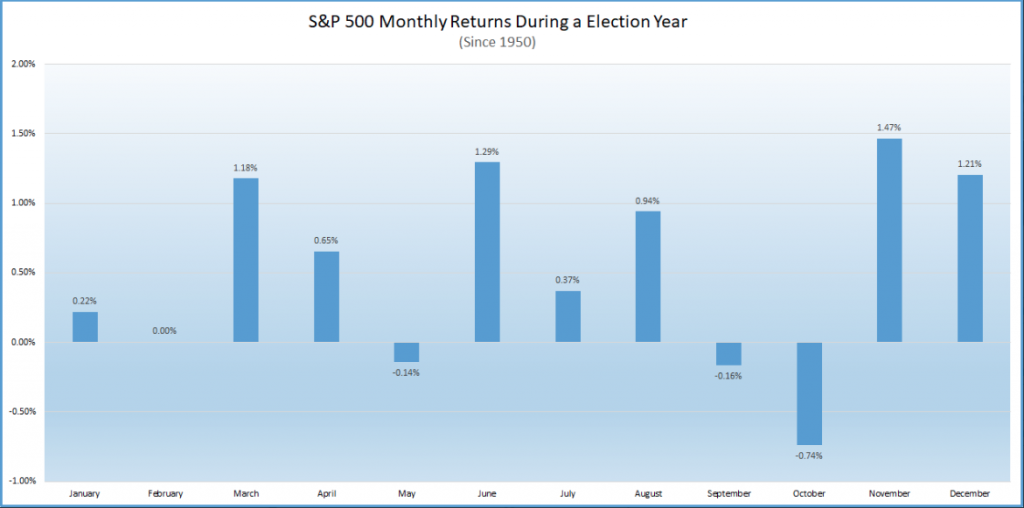
With investors are still in buy-the-dip mode and the S&P 500 is finding new record highs in February 2020, it is not just defying the seemingly bearish impact on markets from the coronavirus, but also defying the usual February returns. The S&P 500 averages a 0.00% return in February during an election year. (Chart from Ryan Detrick)
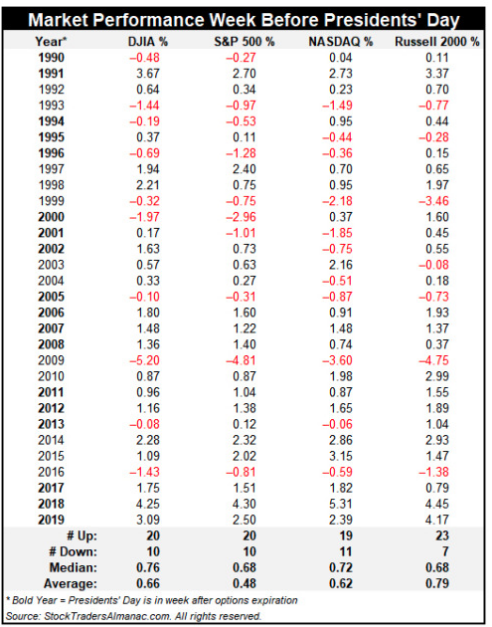
While the month itself may prove irrelevant historically, the week before President’s Day… not so much… It’s always important to understand historical data as an investor/trader. Such data helps to define probabilities going forward, using like macro or market conditions. While the historic data is not a guarantee of market performance in the future, the probabilities can assist with risk management practices assigned to capital allocation decision-making. With that being said, the current trading week leads up to a long weekend that highlights President’s Day, as markets will also be closed next Monday.
Historically, the full week before the long holiday weekend has a bullish record. Since 1990 the Dow Jones Industrial Average (DJIA) and S&P 500 have advanced 20 times with average weekly gains of 0.66% and 0.48% respectively. NASDAQ has one additional weekly decline while Russell 2000 has been the strongest, up 23 times with an average gain of 0.79 percent.
It remains to be seen how the market will perform for the remainder of the trading week leading up to President’s day, but Monday’s gains are already finding legs into Tuesday. Equity futures continue to move higher Tuesday, and ahead of economic data releases and Fed chairman Jerome Powell’s 2-day Testimony before Congress. We’ve seen a host of Fed president’s recently discuss their outlook for rates, the economy and the coronavirus.
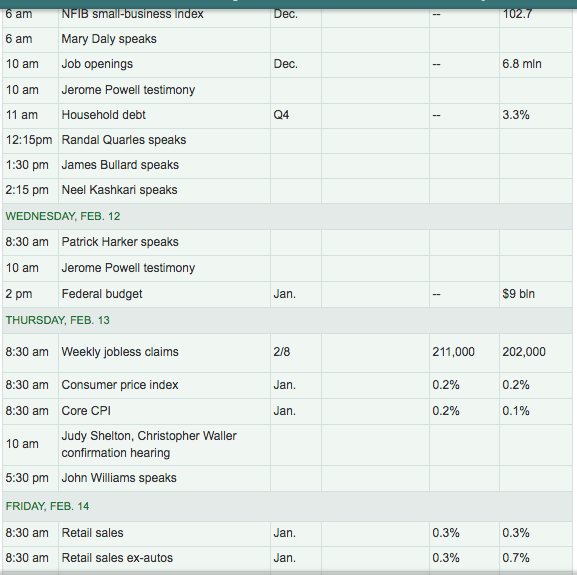
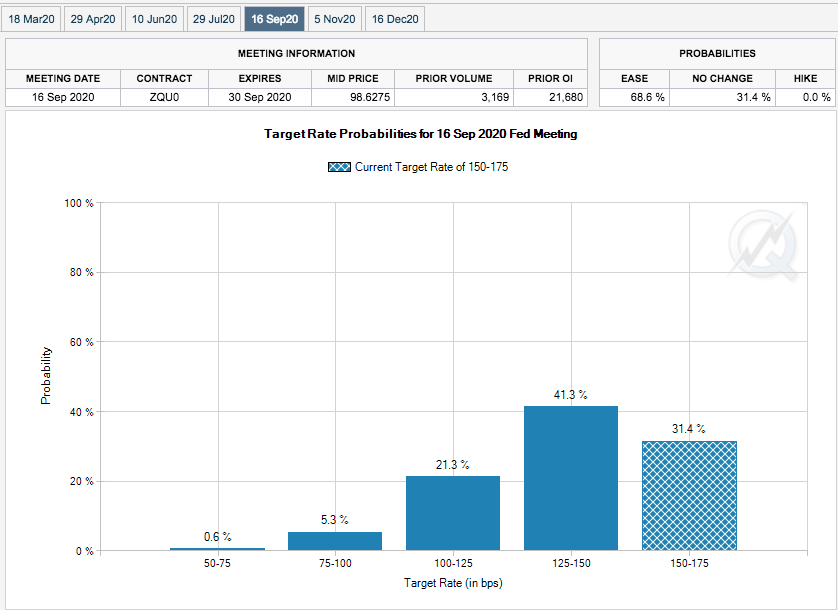
The focus for market participants over the next 48 hours will likely be on Jerome Powell as the economic data calendar proves less relevant until Friday’s release of the monthly retail sales data. Jerome Powell recently outlined the Fed’s dedication to return to it’s inflation target of 2 percent. While the target has proven hellish to achieve over the last decade, Finom Group remains of the opinion that in order to achieve this mandate, the Fed may need to further stimulate economic growth. With growth likely weakening in the Q1 2020 period due to the coronavirus and the bond market signaling the Fed Funds Rate remains to high, the FOMC has all the cover it needs to further reduce rates later this year. The Fed Fund Futures continue to discount this probability, with increasing probability of a Fed rate cut coming in the summer to fall time frame.
The near-term market outlook remains “uneven”, but the bullish trend remains intact and most economists anticipate any economic weakness produced from the coronavirus in Q1 2020 to be met with a pick-up in demand in the out quarters.
Bernstein big investor survey on coronavirus
- Consensus feedback: “We’ve seen this kind of thing before, the authorities are more on top of this situation than they were with SARS, we’ll have a few quarters of a hit to Chinese GDP but it’s not going to be a serious global problem and hopefully any over reaction will present buying opportunities.”
- However, very few investors have made any changes to their portfolio allocations yet.
JPM: We shave off 0.3%-pt off of global growth this quarter due to corona
- That loss is then made up by 3Q20.
- The new forecast puts global growth at 2.3%ar in 1Q, 2.8%ar in 2Q, and 2.6% in 3Q.
GOLDMAN: “The US labor market is going into whatever hit we will see from the coronavirus on a strong note. … Consequently, we still expect the unemployment rate to fall to 3¼% by the end of 2020.” (Hatzius)
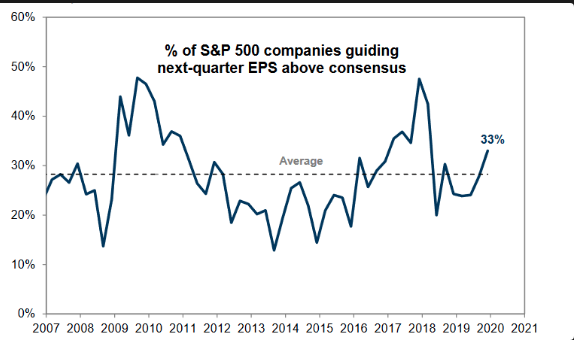
As we continue through the current earnings season, 33% of companies have provided 1Q 2020 guidance above consensus estimates, a net positive and rationale for equity market defiance of the macro issues.
We remind investors/traders of our key reasons for remaining bullish on risk assets in 2020 as follows:
- Monetary policy is easy and the FOMC has stated its likelihood to remain on the sidelines with rates for the foreseeable future. Economic conditions don’t warrant rate hikes, and might be found for a rate cut later in the year due to the Fed’s dual mandate.
- Credit markets remain stable and lending activity remains ebullient.
- A recession does not appear to be on the horizon in 2020 without an economic shock.
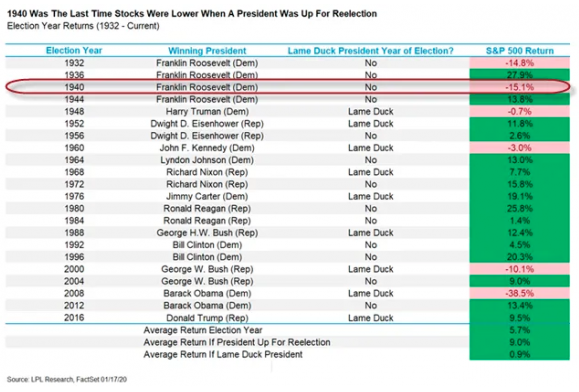
- Election years with an incumbent president seeking re-election tend to produce strong market returns.
- Rates are low, unemployment at record level lows, household balance sheets are at their best levels since the 1960s and post the Great Financial crisis. The list can go on and on….


