

Research Report Excerpt #1

COMPOUNDING is a difficult concept for traders! We dont understand geometric growth as easily as linear growth, because its not intuitive. The chart above helps to depict why, when stocks go up its a win, and when they go down its a longer-term win due to compounding. If you can’t rationalize, that should prices continue to decline near-term it is actually a good thing long-term, I would HOPE the chart above informs. The chart is a picture of what happens to the S&P 500 index long-term when investors buy dips and hold long-term.
Research Report Excerpt #2
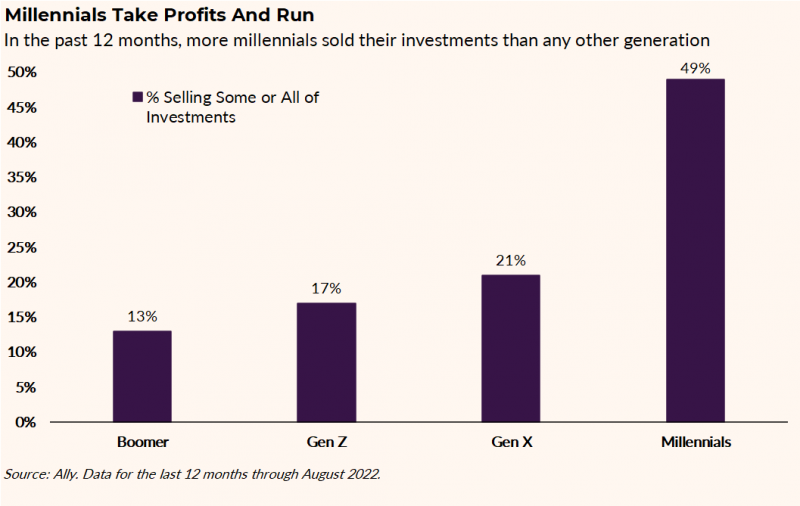
Millennials are jumping ship on stocks faster than any other generation, according to recent data gathered by Ally Invests Lindsey Bell. This is the time when they should be doubling down, she says, and we couldn’t agree more. When value is presented, it’s to the investor’s benefit, not detriment, as proven historically.
Research Report Excerpt #3
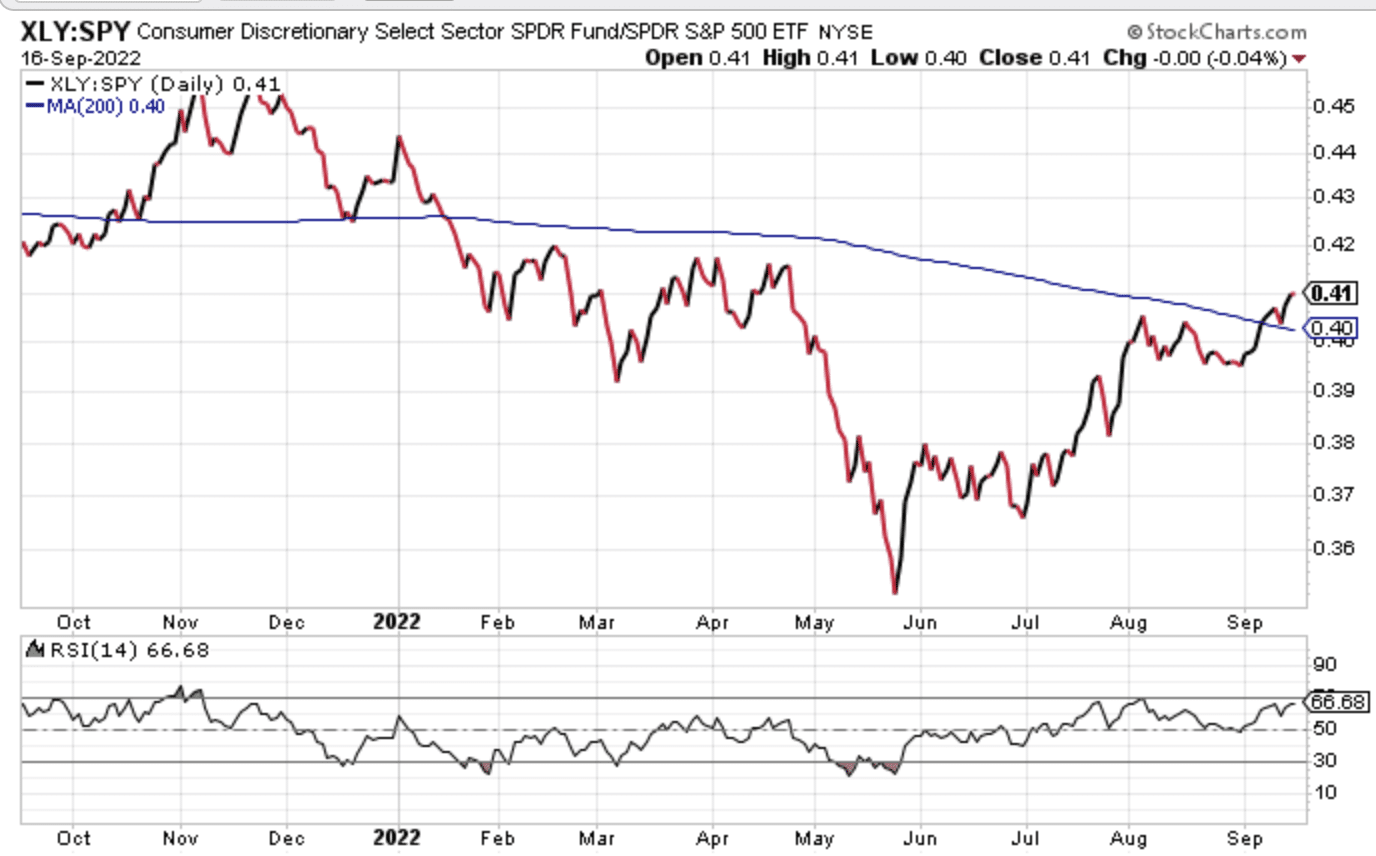
While the breakout held this past week, and moved slightly higher, I’ve added the 200-DMA. The XLY:SPY performance ratio is uptrending and well above its 50-DMA or interim moving average which has curled upward, but the 200-DMA is still descending, even with the performance ratio above this key long-term moving average. So here is what the weight of the evidence suggests in our opinion:
- The interim uptrend and breakout is a net positive. The momentum has confirmed the interim trend. Investors would be wise to remain cautiously optimistic about this performance ratio and how it lends to the overall market’s performance going forward. To validate the uptrend long-term, and become more offensive and cyclically positioned, we would have to see the 200-DMA flatten and curl upward.
- Overall, the trending performance is not something typically associated with bear markets.
Research Report Excerpt #4

Just 2 weeks ago the S&P 500 had a weekly 3.5%+ gain off of the 3,900 level. This past week the index returned that gain, plus an additional 1% or so. By revisiting the 3,900 level for nearly a 5th time since May, it became clear that this level proved key support and just below the 61.8% Fibonacci retractement level (3,909). Unfortunately, with the greater decline this past week, 3,900 was breached to the downside and with a weekly close below this supportive level. The question we should be asking ourselves is whether or not this breakdown could ultimately be another buying opportunity as well as another higher low since June 2022?
Research Report Excerpt #5
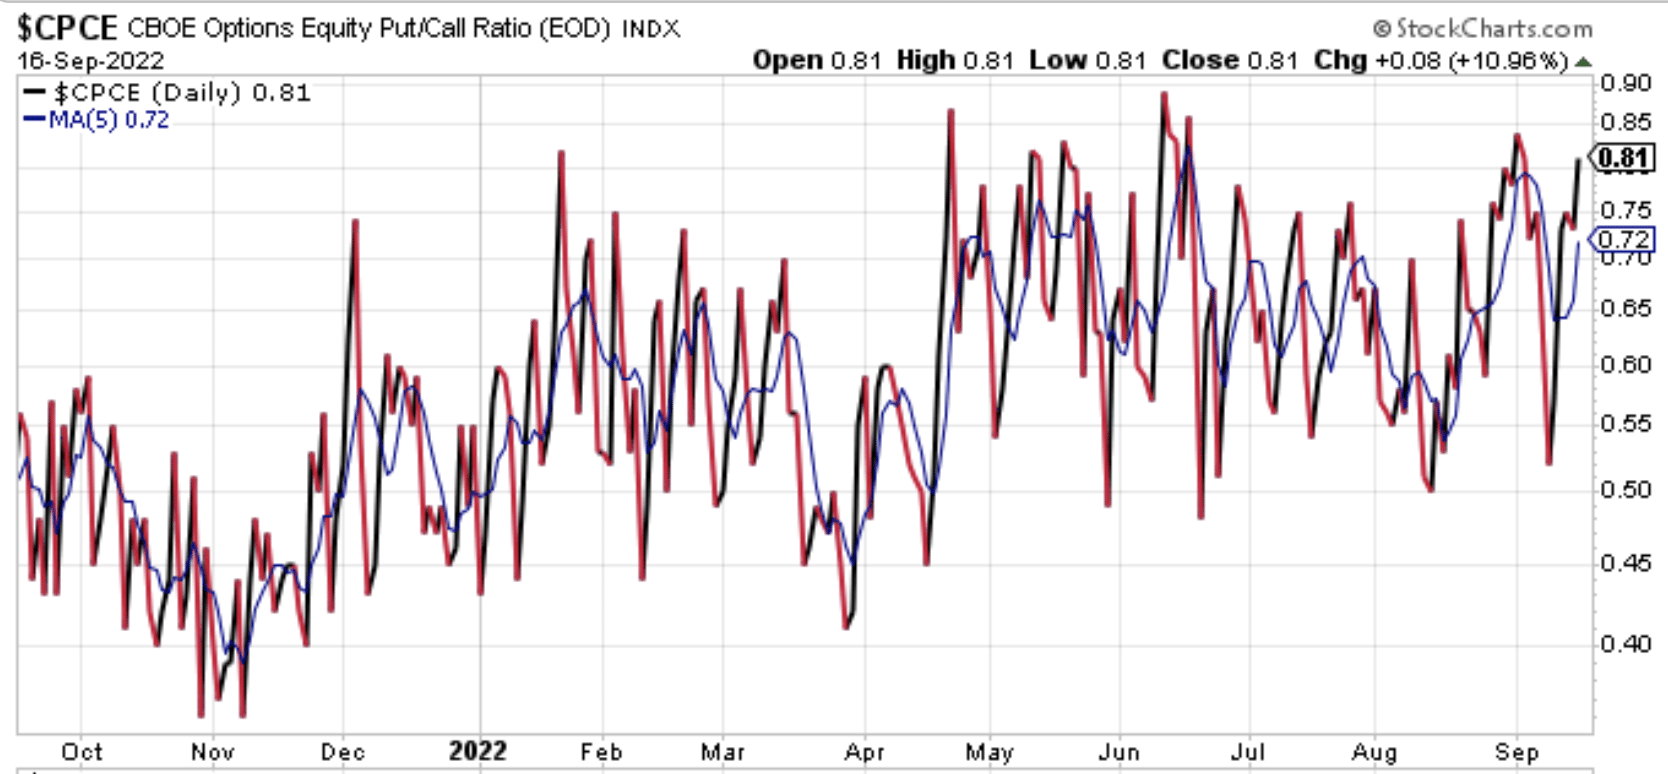
Recall that toward the end of August the 5-DMA of the Equity Put/Call Ratio climbed to .81 with the Put/Call Ratio itself at .85. The S&P 500 has claimed a lower price since then, but the Equity Put/Call Ratio is a lesser .81 with the 5-DMA of the Put/Call Ratio at just .72. We can determine from the chart that there has been lesser hedging or appetite for Put options, even while price has edged lower than 2 weeks ago.
Research Report Excerpt #6
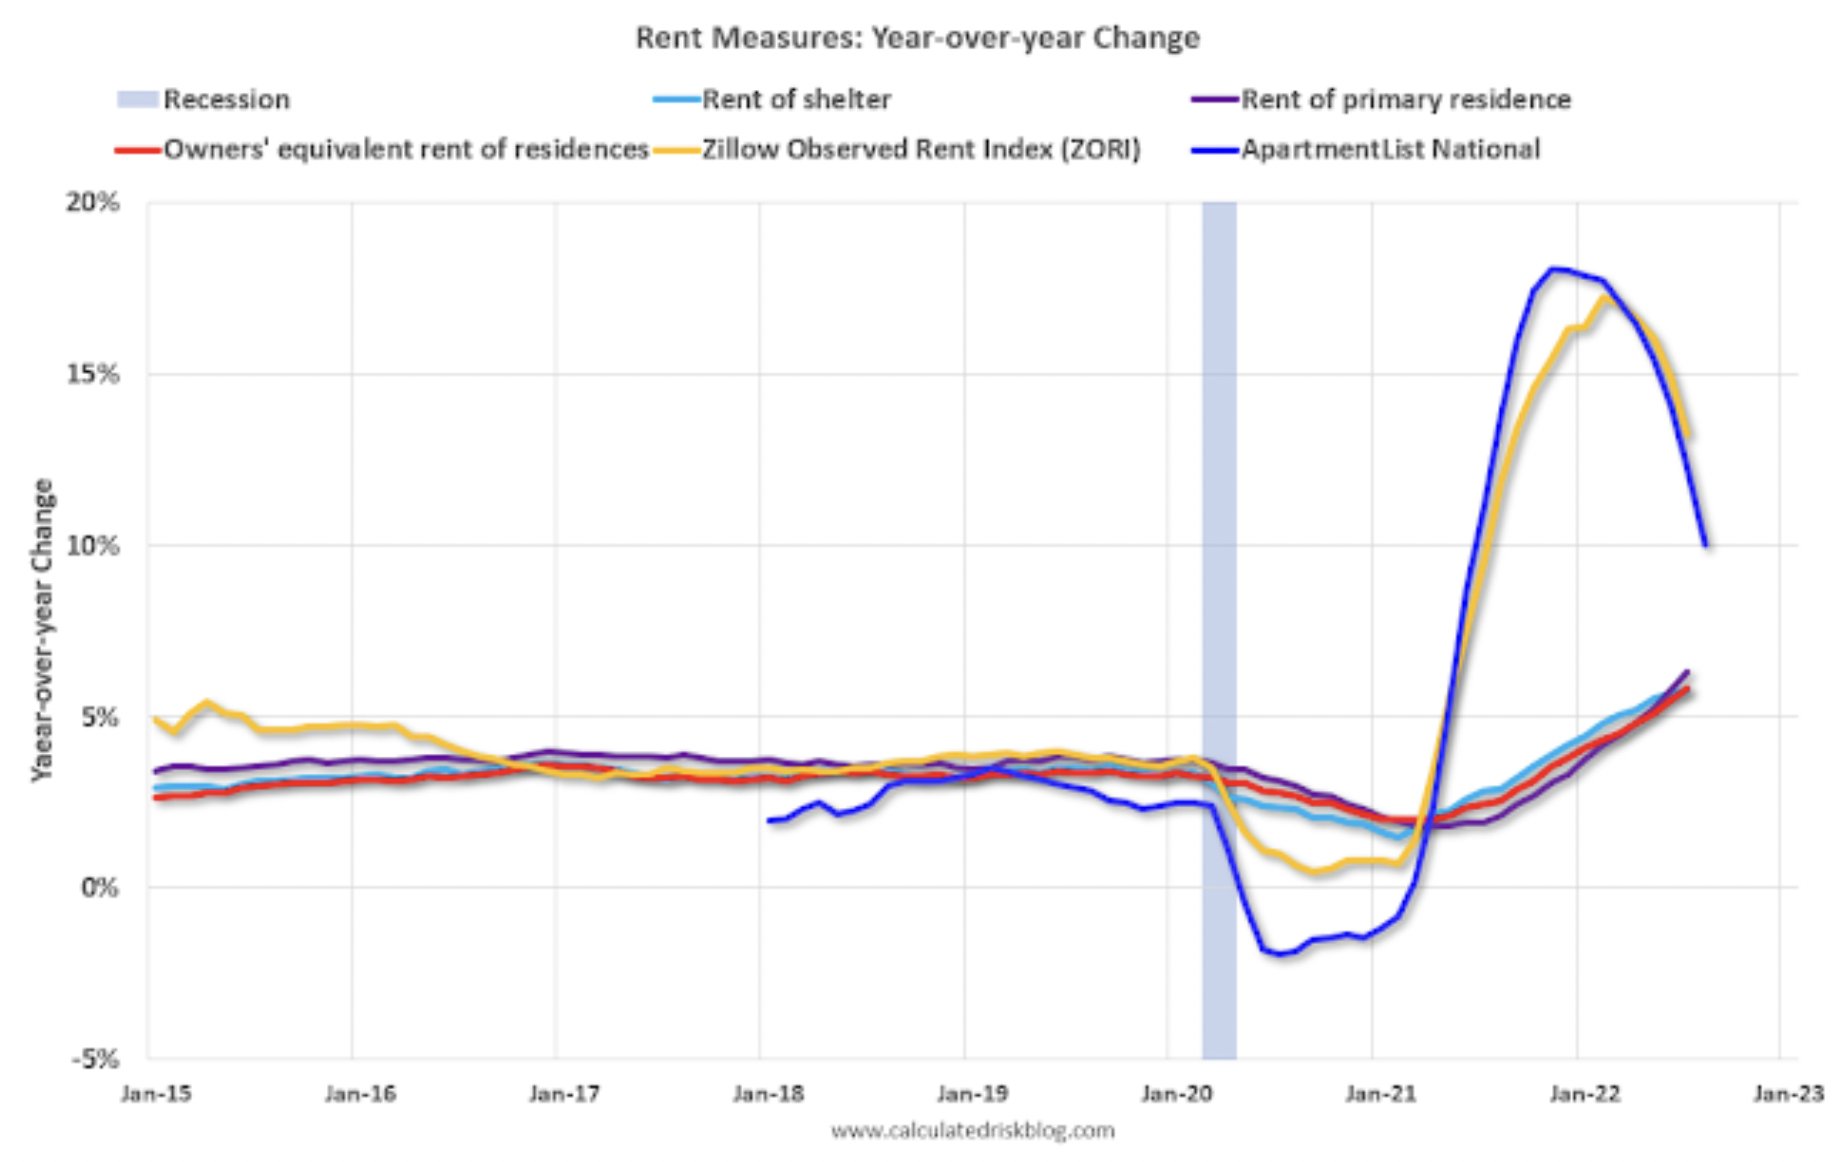
Zillow Observed Rent Index has also been pointing towards OER coming down rapidly in the coming months. Unfortunately again, what we see in real-time may take some time to be recognized in the CPI, which by our estimates suggests recognition in the November to January 2023 time frame. The issues surrounding OER are likely to become elevated in Fed conversations in the weeks ahead, given the divergence between whats being reported by way of CPI and the actual real time data.
Research Report Excerpt #7
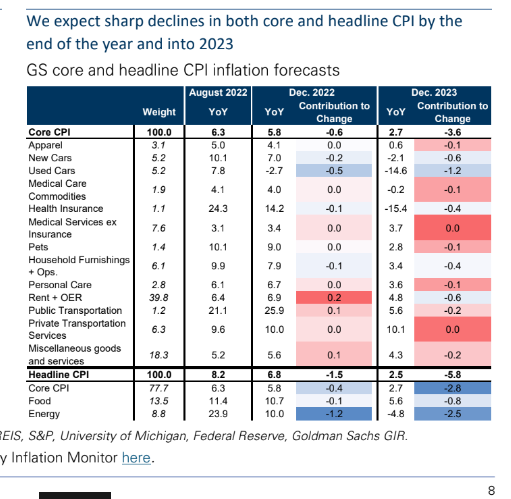
Goldman: “We expect sharp declines in both core and headline CPI by the end of the year and into 2023. Core 2022 CPI 5.8% and Core CPI 2.7% yoy by December 2023.”
Research Report Excerpt #8
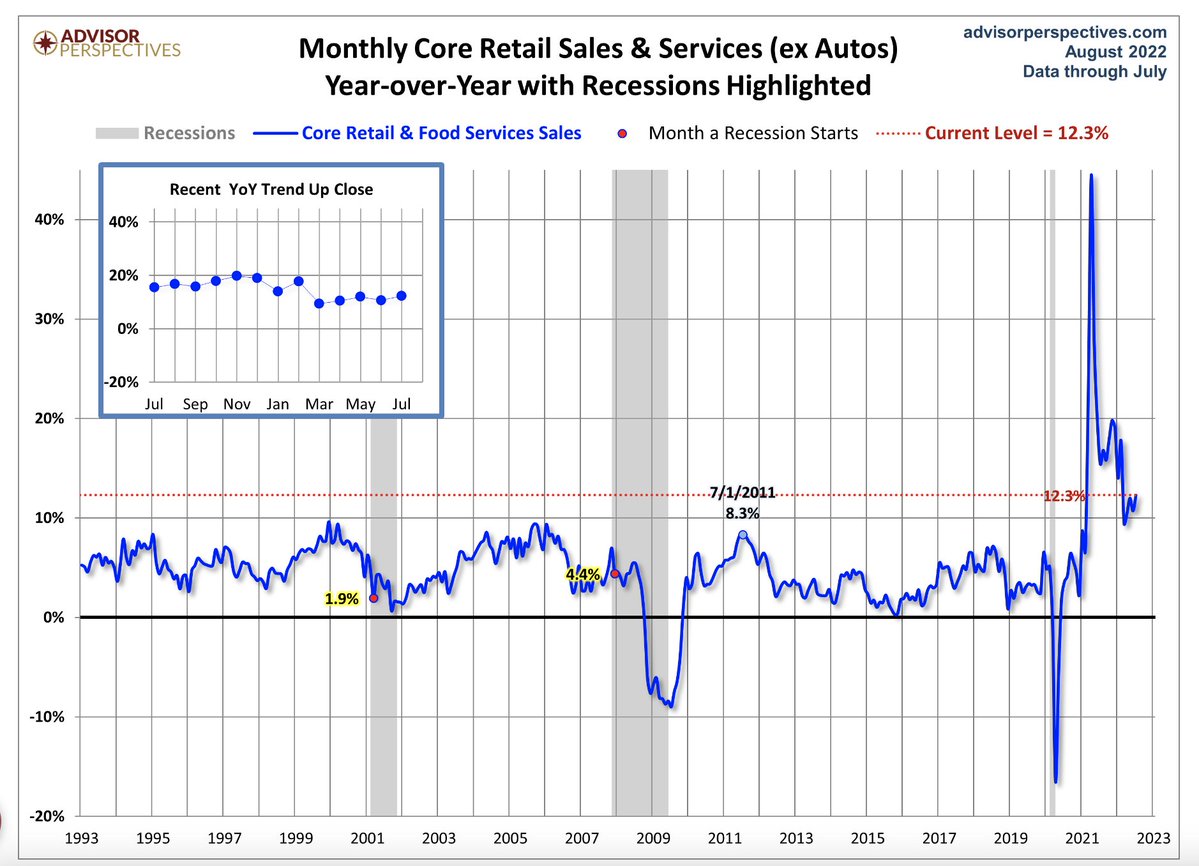
Moreover, as recession fears continue to loom large and given the FedEx CEO commentary this past Friday concerning a slowing global economy and belief a recession will be found, the U.S. has never found a recession, within 12 months, with retail sales growing 8% or greater year-over-year (chart below). The current annualized rate of growth for retail sales is presently 9.3 percent.
Research Report Excerpt #9

The table of S&P 500 returns above speaks volumes, it speaks to compounding gains as well. Why, why are you choosing to focus on the 2000s and 1930s, as I know many will? If that is you, think about the talk you need to have with yourself! Did investors not have any returns during those 2 decades? Just because the S&P 500 didn’t, doesn’t mean the average investor didn’t or wouldn’t if the likeness showed itself again some time in the future. Remember the dollar-cost-averaging math at the onset of this weekend’s Research Report.


