
When it was all said and done for the week, the S&P 500 ended up 0.59% from last Friday and closed the day 0.79% below its record high. The index is up 5.72% YTD (as of Jan. 1), finishing higher in 6 out of the last 7 weeks. This week has an-expected move at $34 for the S&P 500.
Last week, the retail sector earnings dominated trading focus. This week we have a number of major retailers like Kohl’s (KSS), Target (TGT) and others coming out with Q2 results, but the sector’s results thus far have been very, very good. Please see the chart below.
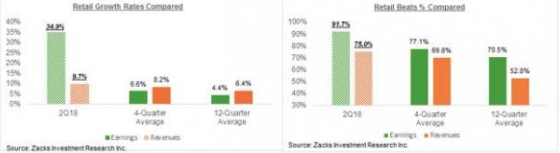
We now have Q2 results from 24 of the 38 retailers in the S&P 500 index that, combined, account for 85.1% of the sector’s total market cap in the index. Total earnings for these Retail sector companies that have reported results are up 34.9% from the same period last year on +9.7% higher revenues, with 91.7% beating EPS estimates and 75% beating revenue estimates, according to FactSet data.
Quickly looking back at some of the economic data released last week, Finom Group chooses to highlight what we believe to be temporary divergences in the data sets. The first data set we choose to highlight is highly important and relevant to the recent Q2 2018 retail reporting season and as it focuses on the consumer. The University of Michigan Preliminary Consumer Sentiment for August came in at 95.3, down 2.6 from the July Final reading. Investing.com had forecast 98.1.
Several factors are playing a role in consumer sentiment presently, none of which should be ignored, but should be understood in their broader historical context. Auto sales are definitively stalling out, as we have seen in the most recent gauge of monthly retail sales. But this is also a factor of more affordable, like-new units with a better value proposition for the consumer. Housing prices are definitively impacting the homebuyer as well, but this is also explained for lacking inventory that has been driving prices higher. Nonetheless, even as durable goods and big-ticket purchases have slowed, consumer discretionary purchases are strengthening. Again, the measure of consumer discretionary strength can be reviewed, in part, via the YOY, 6%+ monthly retail sales trend. Retail sales have increased 6.4% over the past 12 months, close to the long-run average since 1980.
The chart below identifies the dip in consumer sentiment as nothing new and simply part of the economic cycle, even as consumer sentiment remains elevated and at multi-decade highs.

The next piece of economic data comes by way of the latest Conference Board Leading Economic Index (LEI) for July. The LEI increased to 110.7 from 110.0 in June. The Coincident Economic Index (CEI) came in at 104.2, up from 104.0 the previous month. (Full notes)
As we have noted many a time before, LEI is one of Finom Group’s favored data points to follow for each monthly release. It just came in at a very impressive 5.5% YOY in July. Every recession since the early 1970s saw this turn negative YOY ahead of a recession. The LEI hasn’t dropped for an incredible 26 consecutive months. This ties a streak of 26 months that ended in 2011.

The fundamentals that drive a market are quite clear and longstanding in the United States, which is a consumer driven economy. When the consumer has purchasing power, which it does, and spends, which it has/is, the economy grows, which in turn increases corporate earnings, which they are increasing. Believe it or not, that was a grammatically correct sentence.
So let’s put it all together, right? What are the components of a bull market?
- Strong economic conditions as viewed by economic data points
- Strong labor market, with relatively low unemployment
- Strong consumer spending
- Strong retail sales
- Growing corporate earnings
- Fair market valuations during an economic expansion
Of course, the last bullet point is highly subjective and therefore often debatable, but it’s a debate not always worth debating. What is fair value? Whose correlations being used are the right correlations to use? Is history truly our guide for valuations? Any individual investor desiring to fight the economic and market trend is not going to be convinced for the reasons not to be doing so.
The U.S. economy grew at over 4% during the Q2 period and Q2 earnings results are showing near 25% YOY growth. But, perhaps no single company is a better barometer of economic health than Wal-Mart, the country’s largest retailer. In 2016, the company said more than 40 percent of the U.S. population, or 140 million people, shopped at Wal-Mart on a weekly basis. As of the retailers Q2 2018 report, now Wal-Mart’s sales growth is better than at any time in the past decade.
The retailer’s shares closed up 9.3% Thursday after it posted its highest domestic same-store sales growth in more than 10 years for its second quarter. Wal-Mart reported an increase of 4.5% versus the Thomson Reuters estimate of 2.4 percent. While these results are nothing short of spectacular, market pundits will chastise the results and correlate them to a pending bear market indicator from Wal-Mart’s share price surge.
As we near the end of this narrative, we urge investors to be thoughtful with their trading and investing strategies in the 3rd quarter of 2018. This is a quarter for which volatility tends to be greater than that of other quarters.
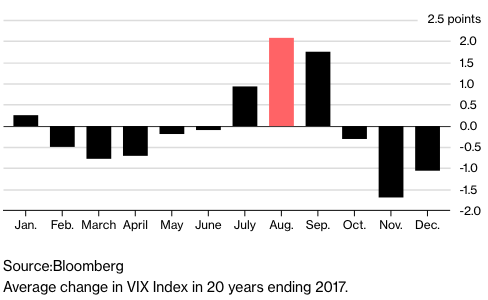
August has already found the VIX below 11 and above 16 in just the first couple of weeks of the trading month. The SKEW index is reading in the mid 140s and the CBOE VIX of VIX Index (VVIX) is above 100 presently. Both are indicators of heightened levels of portfolio protection.
The aforementioned are “market yellow warning” flags, historically. Do all warning flags turn into red flags? No! Nonetheless they should offer investors/traders insight into how they might better position according to the seasonality trends and potential for Q3 to bring about market fireworks.
Have we even mentioned the yield curve as of yet? Getting too wrapped up in a singular narrative is easy for a reader, but we must remember that while markets are driven by a handful of factors over the long haul, the day-2-day trading can be driven by any host of market variables. Fear of the yield curve is just another one of the many variables to be mindful.
The yield curve narrowed to its flattest level since before the financial crisis this past week. The difference between the 2-year and 10-year yield fell to below 24 basis points on an intraday basis Thursday morning, the flattest level since August 2007, two months before the S&P 500 began a steep descent to crisis lows. Any worries a flatter yield curve spells the end of this bull run are premature, says one market watcher.
“The yield curve is rather flat but a flat yield curve is not a message that the rally is over. An inverted yield curve is and we’re just not there yet,” Mark Tepper, president of Strategic Wealth Partners, told CNBC’s “Trading Nation” on Thursday.
As a stand-alone indicator, it’s typically just way early, way premature. It signals the onset of a recession by an average of about 12 months too early and six months before stocks peak.”
While the yield curve continues to flatten and will eventually invert, what is being demonstrated here is that the 3rd quarter has a host of issues that the S&P 500 may not be flagging at the moment, but will after the fact. The Fed is anticipated to hike rates another 25 basis points in September, almost a certainty. Coupled with key global tariff implementation timelines, the upcoming mid-term elections and a possible further development in the Mueller investigation; the S&P 500 could not just hit a new all-time high near term, but shortly thereafter find itself with another 2018 correction.
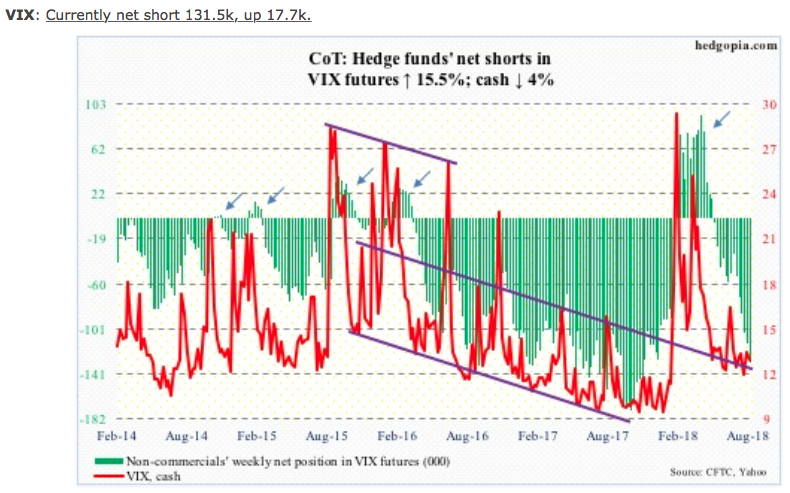
Second to lastly, but also not least! How are hedge funds positioning, right? These are the bigger institutions, the fund flow leaders, so how are they positioned in the S&P 500 and what’s the trend? All good questions so let’s throw up the chart!
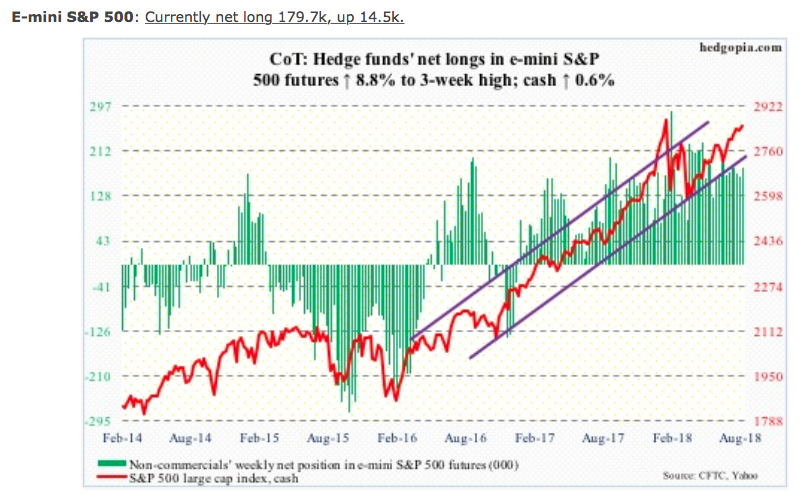
Flows were in full cooperation, as far as S&P 500-focused ETF’s were concerned. In the week to Wednesday, SPY (SPDR S&P 500 ETF), VOO (Vanguard S&P 500 ETF) and IVV (iShares core S&P 500 ETF) respectively took in $1.1 billion, $1.4 billion and $1.5 billion (courtesy of ETF.com). Defending S&P 500 2,800 was in full representation last week. On to our all-important representation of how hedge funds are positioned in VIX futures.
Lastly, is the revised Q2 2018 S&P 500 corporate earnings outlook from Thomson Reuters. As always, earnings the key driver for markets long-term. When making a decision on whether or not to “buy the dip” and how to go about doing so, also factor in to the decision making what the outlook for corporate earnings is projected.
Aggregate Estimates and Revisions
- Second quarter earnings are expected to increase 24.6% from Q2 2017. Excluding the energy sector, the earnings growth estimate declines to 21.6%.
- Of the 467 companies in the S&P 500 that have reported earnings to date for Q2 2018, 79.2% have reported earnings above analyst expectations. This is above the long-term average of 64% and above the average over the past four quarters of 75%.
- Second quarter revenue is expected to increase 9.4% from Q2 2017. Excluding the energy sector, the revenue growth estimate declines to 8.3%.
- 72.1% of companies have reported Q2 2018 revenue above analyst expectations. This is above the long-term average of 60% and above the average over the past four quarters of 72%.
- For Q3 2018, there have been 55 negative EPS preannouncements issued by S&P 500 corporations compared to 33 positive, which results in an N/P ratio of 1.7 for the S&P 500 Index.
- The forward four-quarter (3Q18 – 2Q19) P/E ratio for the S&P 500 is 16.8.
- During the week of Aug. 20, 18 S&P 500 companies are expected to report quarterly earnings.


