
How long is this bull market and where did it begin? This or these questions have given investors a great deal to consider since the media is hyping the longevity of the current bull market. Most media and market analyst types are outlining that “the bull market in U.S. stocks will on Aug. 22 become the longest in history, and optimistic investors argue it has miles to go before it rests.” But the reality of this sentiment is proven inaccurate for defining when a bull market actually began.
The appropriate starting point of this bull market should align with the achievement of reaching and surpassing the former S&P 500 highs. The spring of 2013 marked the beginning of the current bull market under this premise. The reason why setting a new record high is critical when determining a new bull market is that without achieving this milestone, a market is either in a correction or in a bear market depending on the decline from the former all-time high level. Josh Brown, otherwise known as the “reformed broker” explains this logic in his most recent blog/video post.

In 2018, the S&P 500 had its first correction in some time. Did the 12%+ draw down mark a correction or bear market. A bear market is typically defined by a 20% draw down, which was not the case in February-March of 2018 and as such it was merely a significant correction. Also under this scenario, the market has yet to achieve a new all-time high. Given these circumstances, even with the S&P 500 near its January 2018 highs, the index is still in a bull market that is also in a correction or consolidation period. With all that being said, markets have no schedule, timelines and don’t subscribe to any measure of time purported by either bears or bulls. Markets follow the trajectory of earnings over time, point blank and period! Watch the video folks!
While August is typically a poorly performing month for equities, thus far that has not held true; we stress thus far. The fundamental underpinnings of the market, corporate earnings, are relatively strong. The relative portion of the aforementioned statement provides investors with S&P 500 earnings of nearly 25% YOY growth. This is the best growth since 2010. Stephen Suttmeier, a technical research analyst at Bank of America Merrill Lynch, is among those who remain upbeat on the market’s prospects.
The BofAML technician said that the strength in the market’s breadth, as gauged by a record high in the S&P 500’s NYSE Composite Advance-Decline line last week, indicated that stocks have a long way to go before hitting a wall. This indicator has led the U.S. stock market higher this year.
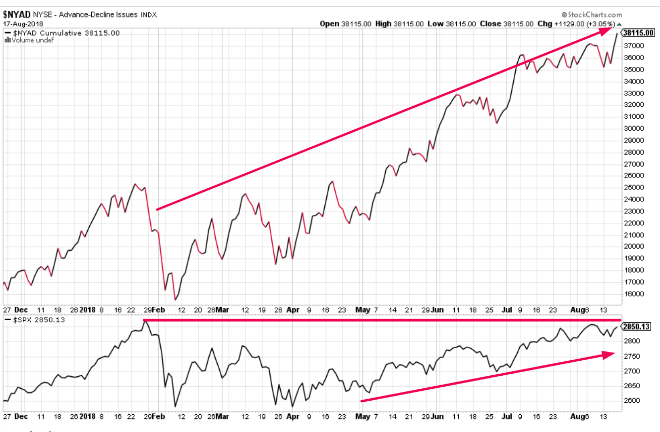
“This suggests market rotation and not a market top. Given the debate about growth topping out relative to value, we find it interesting that the A-D line for both Russell 1000 Growth and Russell 1000 Value hit new highs last week.”
Moreover, the BofAML technician recently commented on more than just the Russell in his dissection of the Dow and Dow Theory. The Dow Theory, which posits that strength in both the Dow Jones Industrial Average and the Dow Jones Transportation Average means strength for the market, also suggests that the bull market is rather strong despite its longevity. There we again, thinking in terms of time rather than more rationally and along the lines of what the market is actually telling us, that the bull market has fundamental and technical room to run.
“The Dow Theory reconfirmed its buy signal on Friday with new highs for both the Dow Industrials and Dow Transports off the lows from February, April, and June.”
It has been a slow grind higher for the markets since the February-March correction, one met with both fear and optimism. J.C. O’Hara, chief market technician at MKM Partners, said market sentiment is just right at present, not too hot nor too cold. Finom Group agrees with this analysis on sentiment and discussed it most recently in our weekly research report. Finom Group drew this conclusion after analyzing the most recent change in the AAII Investor Sentiment Survey for week ending 8/15/18.
“Additionally, we come to find that neutral sentiment has risen more sharply, indicating uncertainty in the market, likely tied to overall market valuation, peak market and geopolitical concerns all bundled together. Finom Group suggests that the survey could best be characterized as… not too hot, not too cold, but just right. A bit of Goldilocks if you will, which has also carried forward the “buy the dip” mentality in recent weeks.”
Finom Group remains optimistic about future S&P 500 returns and the ability of the market to achieve new all-time record levels as well as its stated S&P 500 target for the year. How long is or isn’t the bull market is inconsequential. Having said that, we reiterate that the market will likely remain choppy for the remainder of the year and in kind with the first 7 months. Here is how John Lynch of LPL Financial recently described the firm’s outlook.
“From tariffs to trade wars to inflation to a flattening yield curve to a global economic slowdown, the headlines continue to cast doubt on the sustainability of this economic cycle and bull market. Although we see several potential stumbling blocks, we continue to believe this economy and stock market rally have plenty of fuel left in the tank.”
LPL Financial and John Lynch believe the markets have plenty of room to run, identifying a strong labor market, modest wage growth and strong Leading Economic Indicators as providing the economy and market with further upside. But the firm also touts the current market as having begun with the 2008-09 market crash.
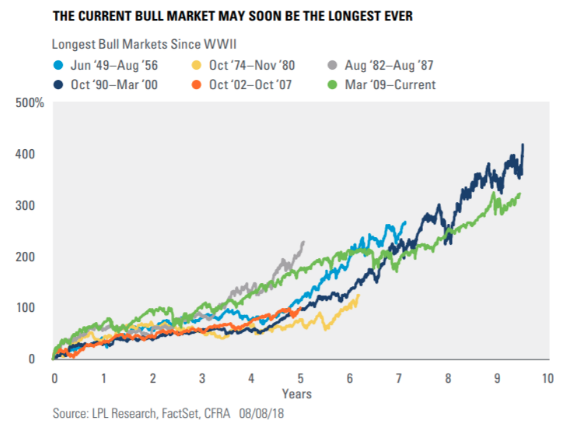
Since March 9, 2009, which marked the low of the financial crisis and which many consider the birth date of the current bull market, the S&P 500 has advanced 320%, the Dow Jones Industrial Average has risen 286% and the Nasdaq has soared 521 percent.
As it pertains to the longevity of the bull market and economic expansion, there is much to debate, but little reason to do so in our opinion. One thing is for certain; most economic expansions are juxtaposed with Fed tightening that underscores the duration of the expansion period. Typically, the latter innings of an economic expansion are “marred” by Fed rate hikes, as the Fed is tasked with cooling an economy that might otherwise overheat. In 2018, the Fed has forecasted 4 rate hikes, the most since 2015.
Next week is the highly touted and scrutinized Jackson Hole meeting. Federal Reserve Chairman Jerome Powell may use his closely watched speech in Jackson Hole to discuss potential trouble spots ahead for the economy and how the central bank might react. Powell is speaking on “monetary policy in a changing economy” on Friday at 10 a.m. Eastern from the central bank’s annual summer retreat in the Grand Teton Mountains. The Jackson Hole meeting comes at a time where the market seemingly has accepted the Fed’s rate hike path and monetary policy, but President Donald Trump has not. Trump criticized Jerome Powell’s Fed, saying that he needed help from the central bank to improve the economy, suggesting that a series of rate hikes by Powell & Co., were undercutting pro-market policies. His continued discontentedness with Fed rate hikes has given investors reasons to consider if his displeasure might impede the Fed’s actions in the future.
While many economists believe the Fed has plotted the appropriate course for monetary policy with respect to its dual mandates, inflation and employment, not all economists are in agreement. In fact, Finom Group’s chief market strategist and admitted pseudo-economists Seth Golden disagrees with the Fed’s course of action. Golden doesn’t believe the economy is expressing true inflation, adjusted inflation or nominal inflation. Whether it is the Personal Consumption & Expenditures or Consumer Price Index data, neither has or is representing nominal inflation on the horizon. Are both metrics running hotter than in previous years, yes! But neither is anywhere near levels of concern or at breakaway speed. In fact, Golden believes the Fed is in agreement with his views as the Fed has recently adopted a “symmetric” approach to its inflation analysis and with respect to its future rate hikes.
“It was also noted that a temporary period of inflation modestly above 2 percent would be consistent with the Committee’s symmetric inflation objective and could be helpful in anchoring longer-run inflation expectations at a level consistent with that objective.”
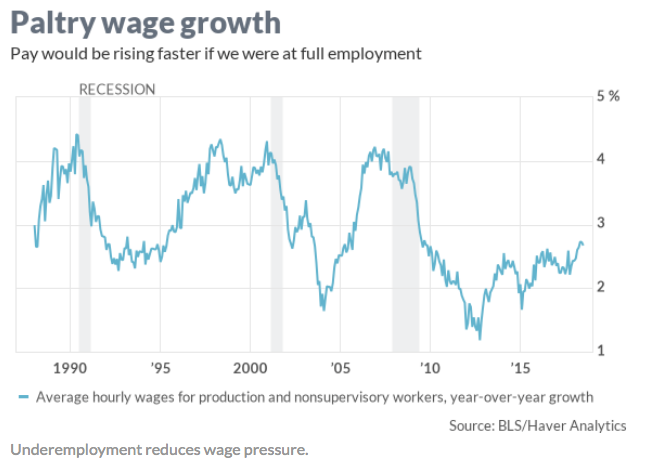
Basically, the Fed acknowledges that after an elongated period of deflation and low rates, a period of higher inflation and higher rates may be necessary or desirable to round out the economy over time. But Golden also believes that the Fed is misunderstanding or outright analyzing the employment picture with error. While the level of unemployment is near record low levels, the reality is that wages are stubbornly disinflationary and growing, but growingly ever so slowly and inconsequential. Moreover, the types of employment have changed, whereby workers are fighting for more hours, suggesting full employment is a misnomer when juxtaposed with unemployment levels. The bottom-line is that the nation is experiencing underemployment, something not readily acknowledged by the Fed as of yet.
In a new paper, David Blanchflower, and David Bell, an economics professor at the University of Stirling, argue that, in the wake of the Great Recession, “underemployment” is a better measure of labor-market health than the unemployment rate. The fact that millions of workers want to work more hours means that the labor market still has plenty of slack.
The paper argues that the Labor Department doesn’t do a good job in measuring underemployment. Its current measure of “part time for economic reasons” does not ask how many hours the underemployed want to work.
“Even though the unemployment rate is at historic lows in many countries this still does not suggest that these country’s labor markets are anywhere close to full employment.”
The pressure on wage growth is nothing new, but lends itself to question why the Fed is raising rates given that there is no real wage inflation. The fact that the unemployment level is so low and seemingly lower for each reporting period, validates the notion of underemployment and its relevance. So for all those economists with constant consternation as to when the unemployment rate will bottom, it’s highly probable they are looking at employment through the wrong lens.
As it pertains to equity markets, given that real wages historically remain capped, the February market correction under the premise of one hot wage metric reporting period was utterly ridiculous. Real wages have been stagnant for the most part of the past 40 years, as shown in the government’s own reporting via the chart below.
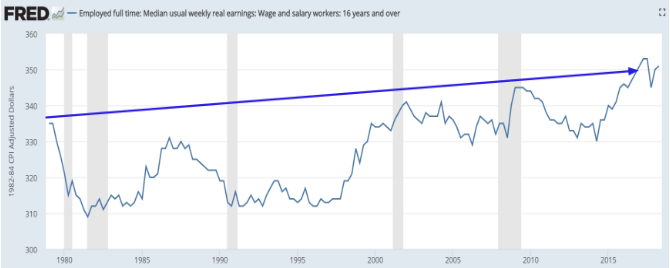
The stock market continues to grow and the stock market continues to go up regardless of wage “inflation”. Why is this you might ask? Because “the economy” is not real GDP per capita. It’s real GDP. In other words, an economy with zero real wage growth can still grow if its population is increasing. Moreover, not all economic growth goes towards wages. A large part of it goes towards corporate profits. Yes, the rich get richer before it trickles down, if it ever trickles down. The last 40 years suggests there is no such thing as trickle down prosperity.
With all of that being said, the S&P has performed spectacularly since the Great Recession of 2009. With the S&P 500 record level of 2,872 in sight, investors are positioning for further upside. The retail sector will conclude the Q2 2018 reporting season as Kohl’s (KSS), T.J. Maxx Corp. (TJX) and Target Corp. (TGT) are all reporting this week. The sector has high expectations with most of these names having run fast and furiously to the upside in recent quarters. Seth Golden, also managing director of Golden Capital Portfolio, owns shares of TGT since $53 last year.
“Assuming Target reports a better than anticipated earnings and sales result, but still pullsback as it has done in 4 of the past 5 reporting quarters, I’d be a buyer on such a pullback.”
With retail reports largely coming in better than expected during the season, the sector remains on fire. Just last night, Jim Cramer discussed the largest name in the sector on his Mad Money show. In speaking to investors, the Mad Money host stated that Wal-Mart shares are poised to move higher.
“Don’t think it is too late to buy some. Last week, I got some sweet vindication” thanks to Wal-Mart’s robust earnings numbers. Given the strength of the fundamentals and what we see in the chart, I think this $96 stock can go to $115 or $120 in the not too distant future. Meaning, Wal-Mart stock is still a buy.”


