
We have a busy reporting week, with more than 170 companies coming out with quarterly results, including 60 S&P 500 companies. The following graphic identifies some of the key reports due out this week by date.

Stocks posted strong gains last week, with the Dow, S&P 500 and Nasdaq all rising more than 1.5 percent. The major indexes have risen as concerns over a trade war between the U.S. and China have eased, despite the escalation in the rhetoric and threats of more tariffs to come. The broader S&P 500 index is up nearly 4% on the year, but down some 2.5% from its record close achieved in January.
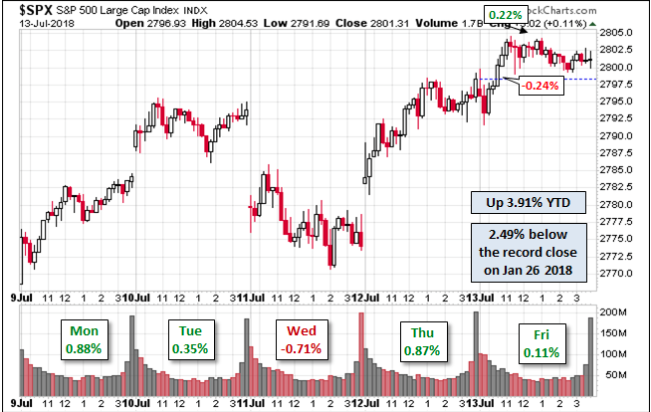
“2,800 has been a significant level both mentally and technically for the market,” said Jeff Kilburg, CEO of KKM Financial. “I think this will be a short-lived move above 2,800, however” as trade concerns and corporate earnings releases keep gains at bay.”
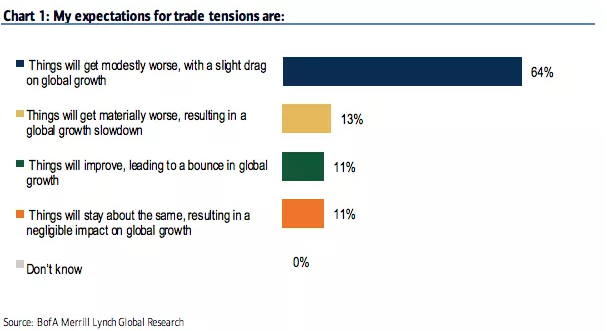
While the markets performed strongly since the U.S. administration outlined the next $200bn in tariffs to be levied against China by September, the fears surrounding a trade war have actually risen. In their latest rates and FX survey conducted on July 11 and representing the views of 58 fund managers responsible for $286 billion in AUM, BofAML found that 64% of respondents believe trade tensions are set to get “modestly worse” resulting in a drag on global growth.
As we look at the performance of the broader market this year, we can’t help but to identify the strength of the FANG and tech sector stocks. The narrative being written for the better part of 2018 is that only a handful of stocks are carrying markets, propping them up from falling in other words. But the narrative simply isn’t fitting with reality.
“The stock market is not currently being driven by just a handful of stocks,” writes Carlson, Ritholtz Wealth Management’s director of institutional asset management. One “tell-tale sign that this isn’t the case” comes from the fact that small-cap stocks are outperforming this year, he says. The smaller Russell 2000 index is up 10% in 2018, beating the S&P’s gain of 4.7 percent.”
Another way to review the breadth of market is by way of the NYSE Advance-Decline Line. Ritholtz offers the chart below that plots that gauge’s moves alongside the S&P’s action.
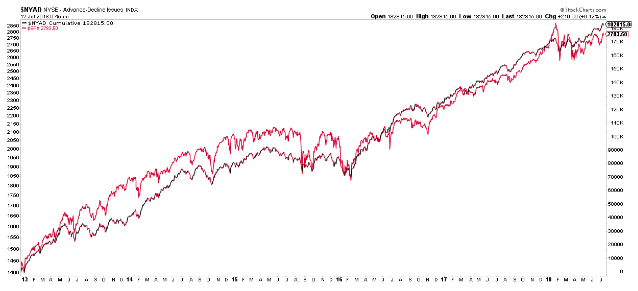
“If there were only a few stocks rising, you would see a large divergence between these lines. Instead, we see the advance-decline fairly in line with the stock market. This tells us that there are far more stocks rising than just a few of the biggest names.”
Earnings should be supportive to the bulls as we largely expect there will be a high “beat rate” of earnings estimates. Having said that, it still remains of great importance to continuously weigh the risks to the market going forward. Those risks include:
- Trade escalation risk
- Yield curve inversion fears
- Tweets from the White House
- Interest Rates moving higher, which may deter credit expansion
- Monetary Policy errors from central bank tightening
- Earnings guidance
- Geopolitical
- Midterm Elections
While a bigger correction may not be on the horizon, no guarantees of course, that doesn’t mean bearish signs for the market are nonexistent. This past Friday Ryan Vlastelica had an interesting article at MarketWatch last week discussing the long “correction” periods akin to the one the market is presently expressing.
“Including Friday, both the Dow and the S&P have been in correction territory for 108 trading days. This matches the longest such stretch since the financial crisis in 2008. Should the two primary market gauges stay in correction through the close of trading on Monday, that will mean they are in their longest such stretch since 1984. In that stretch, it took the S&P 122 days to emerge from correction territory, and the Dow 123 days, according to the WSJ Market Data Group.”
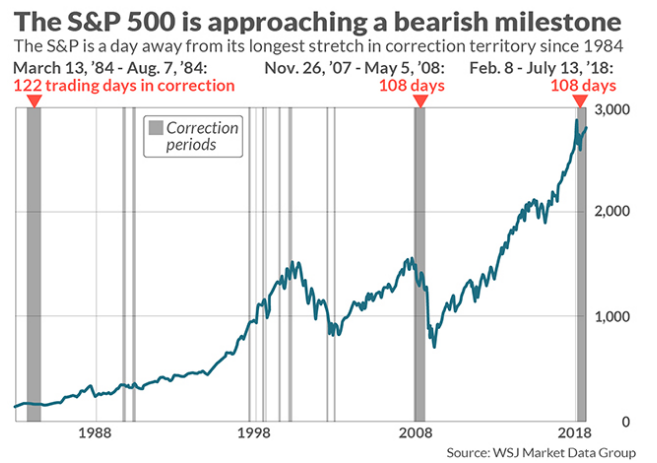
“Despite the bearish record that could be set on Monday, the market is also nearing a more positive milestone. On a total-return basis, the S&P 500 is just days away from its longest stretch above its 200-day moving average in its history.”
In reviewing this article from Ryan, it may be prudent to juxtapose the context with where we are in both the economic and bull market cycle. Do records like these occur at the beginning, middle or ends of cycles? That’s right, they typically occur in the latter innings of a cycle. What also occurs during the latter innings of a market and economic cycle, that’s right, greater Federal Reserve involvement, for better or for worse.
Just this past week, the Federal Reserve told Congress that the rise in inflation witnessed since 2017 was expected and the central bank can continue to raise interest rates gradually.
“Federal Reserve policymakers expected inflation to move higher in 2018. This expectation appears to be on track so far,” the Fed said in its semi-annual report to lawmakers on monetary policy.”
The Fed is forecasting that its favorite measure of inflation, the personal consumption expenditure price index (PCE), will remain at 2.1% this year and in 2019, and 2020. The faster rise in inflation this year reflects higher energy prices, the report said. Given the path the Fed is currently on regarding rate hikes, investors see a 60% chance of four rate hikes this year, according to the CME’s FedWatch tool.
One thing to watch this week is the Federal Reserve’s “Beige Book” that evaluates how the economy is performing in different parts of the country. The economy is strong and has shown signs of accelerating retail sales and consumption since the Q1 2018 period.
In terms of the consumer and the economy, the week ahead will kick-off with critically important monthly retail sales data. Wall Street pros forecast a healthy 0.5% increase after an even larger gain in May. After a dismal reading for retail sales to commence the 2018 calendar year, retail spending has bounced back strongly with a string of positive months. Monday’s release of June retail sales will go a long way to supporting future stock market gains, especially as fears of inflationary impacts on the consumer weigh heavily.
As it pertains to the week ahead, it should prove another interesting week with the banks continue to roll investors deeper into earnings season and as a couple big tech stocks are set to report. Additionally, next week marks options expiration week. VIX options will expire on Wednesday morning, the SPX options will expire on Friday morning, and the SPY options will expire on Friday afternoon. Option expiration events often are accompanied by volatility as the large traders exit or roll their positions in order to maximize profit and purge risk.
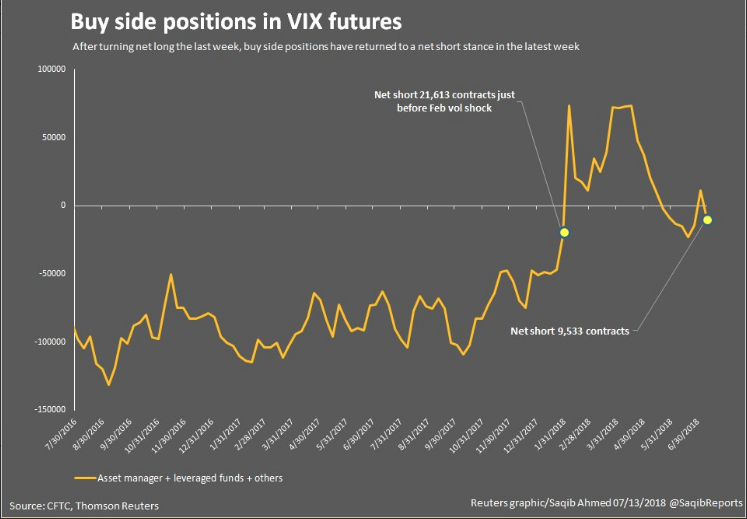
The expected SPX move for the week is less than prior weeks. SPX has only a $29-$30 expected move this week vs. the prior week, which was a $33 move and the week before that was a $40 expected move. With that being said, expected moves are often breached. The realized move in the SPX last week was actually $40, breaching the expected move of $33. With that, we understand volatility is continuing to contract ahead of options expiration week. Additionally, after turning net long VIX futures recently, last week VIX futures returned to a net short position on just over 9,500 contracts as shown in the graphic below from Thomson Reuters.
As we predicted in previous reports, Finom Group believed that once banks started reporting earnings, Thomson Reuters would be forced to raise their forecast for S&P 500 Q2 2018 earnings. That prediction has been met positively with Reuters delivering an updated forecast as follows.
Aggregate Estimates and Revisions
- Second quarter earnings are expected to increase 20.9% from Q2 2017. Excluding the energy sector, the earnings growth estimate declines to 17.1%.
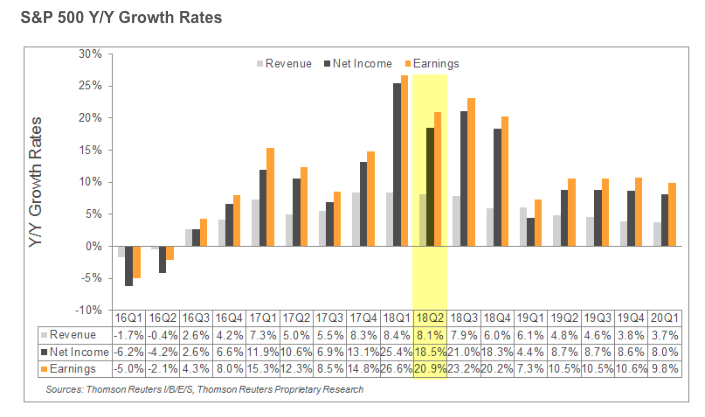
Prior to last week’s bank reporting season commencement, Reuters was forecasting S&P 500 Q2 2018 earnings to grow 20.7% and now that has been revised higher to 20.9%, as shown in the table above. According to FactSet, the forward 12-month P/E ratio for the S&P 500 is 16.6. This P/E ratio is above the 5-year average (16.2) and above the 10-year average (14.4).


