Happy weekend to all and we hope you enjoy and find value in our weekend update that includes our daily Technical Market Recap with Wayne Nelson. Before we get to that, however, it’s not often that you see a market aimed at crushing the options on Friday, but “manalamancha” was that fun to watch with the major indices rising sharply prior to the ISM manufacturing data being released.
The Institute for Supply Management said its survey of top manufacturing executives fell to 54.2% last month from 56.6% in January. Economists surveyed by MarketWatch had forecast the index to total 55.5%.
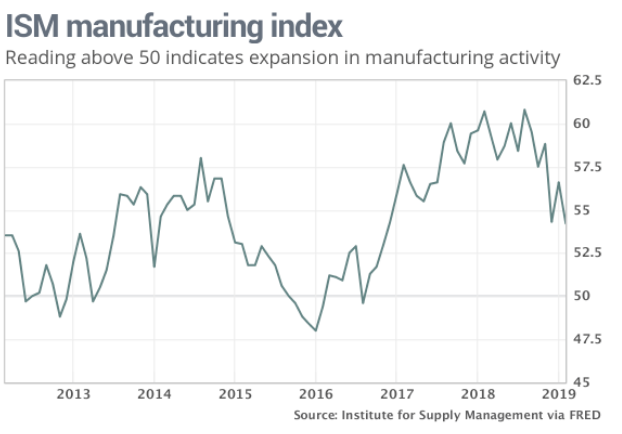
The index for new orders dropped 2.7 points to 55.5%, with production falling a steeper 5.7 points to 54.8%. Employment slipped 3.2 points to 52.3% — also the lowest in two years.
With the negatives out of the way, on a more positive note, the prices companies pay for raw materials and other supplies continued to drop in line with a gradual decline in inflation. What’s more, 16 of the 18 industries tracked by the ISM reported growth. There’s actually another really important way of reviewing the latest ISM data and we’ll offer that in our weekly Research Report to our subscribers. It’s a MUST KNOW perspective.
Probably the biggest data point released on Friday was the Q4 2018 GDP data that surprised to the upside. GDP rose 2.6% in Q4 2018 against the average estimate of 2 percent. Finom Group would be of the opinion that this GDP print gets revised lower and possibly finishes with a 2.3% growth rate when it’s all said in done in the next couple of months.
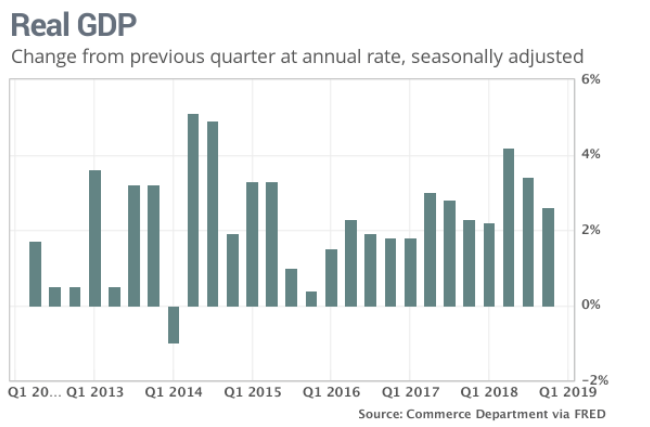
Consumer spending, the main engine of the economy, increased a healthy 2.8% in the fourth quarter. Americans spent more on new cars and trucks, health care and financial help, among other things.
Businesses investment, meanwhile, was stronger than expected. Companies invested more in equipment and product research, offsetting another decline in spending on structures such as drilling rigs or office buildings.
In a big surprise, firms also increased the value inventories by $97.1 billion, even more than in the third quarter. Other reports had suggested inventories would shrink.
The rate of inflation tapered off. The PCE index rose at a 1.5% pace in the quarter, with the core rate that excludes food and energy up 1.7%. Inflation ran about 2% for the entire year, right at the Federal Reserve’s target.
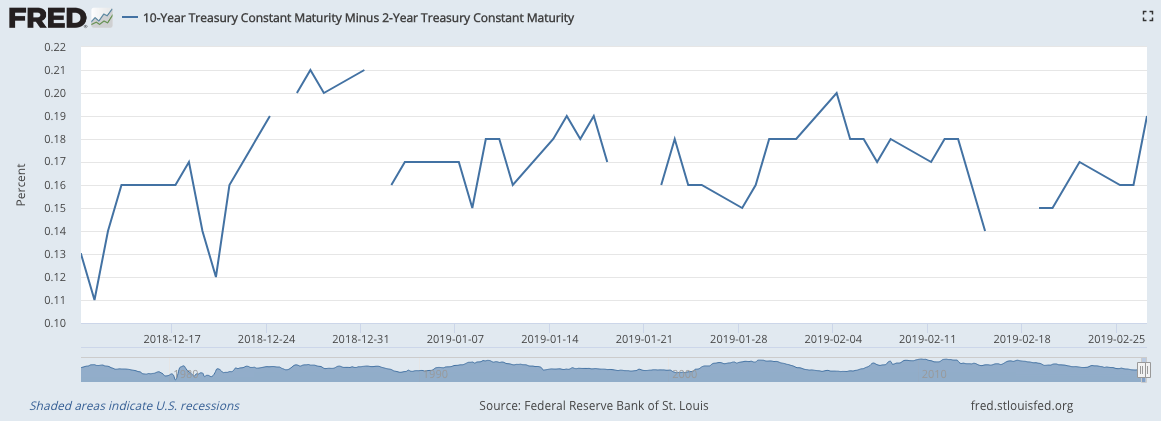
Speaking of inflation, well not really but in terms of the bond market and rising yields Friday also proved eventful. Friday found the spread between the 2-yr. Treasury yield and the 10-yr. Treasury yield above 20 bps for the first time in 2019 as depicted in the chart below.
With the latest GDP results for Q4 2018 out of the way it will prove time to focus on Q1 2019 GDP. The estimates are already widely distributed and we’ll touch on this subject matter as well with subscribers and through our weekly Research Report, so subscribe today. Of course, next week’s big data point will come from the monthly Nonfarm Payrolls report that also includes wage inflation data. This was the precise data point that served to plunge the market in February of 2018. So be aware and be prepared.
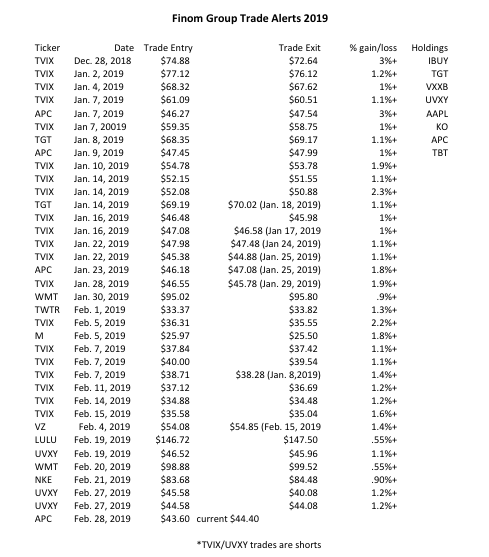
With all that being said and done, the S&P 500 managed to close the week positively once again and above 2,800 for the first time since October 2018. Finom Group rode the wave of volatility since the market sell-off in 2018 and through its rebound in 2019, issuing trade alerts to our subscribers along the way. In 2019, the table below denotes our YTD Trade Alerts for subscribers.
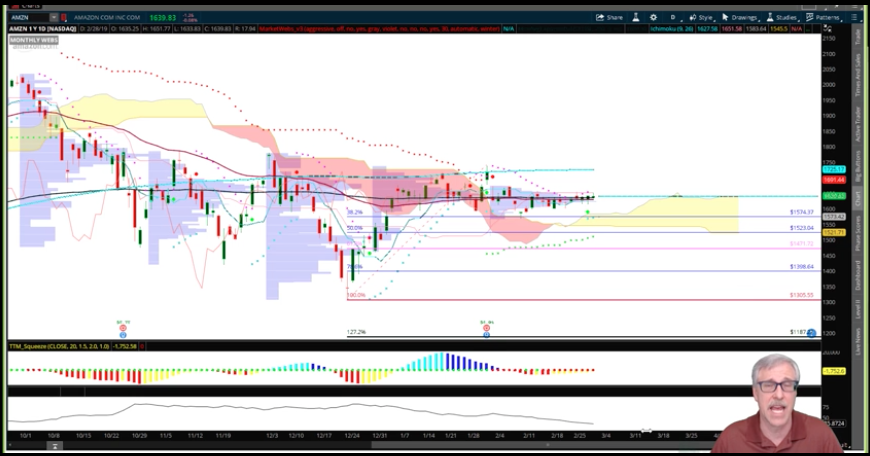
And without further delay, here is our daily Technical Market Recap with Wayne Nelson. Please click the link to review.