
Yesterday’s market activity was moving right along, swimmingly, with the Dow & S&P 500 slightly negative and the Nasdaq positive up until 2:00 p.m. EST. It was then that the major averages all took a sharp leg lower on reports from Bloomberg that President Trump was prepared and readying his administration to go forward with $200bn worth of tariffs on Chinese goods. The news led stocks lower and ended a 4-day winning streak for the S&P 500. The Dow Jones Industrial Average dropped 137.65 points to 25,986.92 while the S&P 500 fell 0.4% to 2,901.13. The Nasdaq Composite declined 0.3% to 8,088.36 after reaching a record high.
Bloomberg News reported that Trump told aides he supports moving forward with proposed tariffs on an additional $200 billion in Chinese goods. The report also said, however, that Trump has not made up his mind on the matter. The White House declined to comment on the report.
In other trade related news, Canada has until Friday to join a trade deal made between the U.S. and Mexico, according to Trump. However, Trump said he was confident an agreement between the two nations was within reach. “I think Canada very much wants to make the deal,” Trump told reporters on Wednesday. “
The headlines surrounding trade on Thursday likely gave the market what it may have very much needed, a pause. While market breadth has been strong through the rally that has persisted since April, an overbought signal had finally been achieved for the S&P 500 on Wednesday.

The 14-day RSI has reached 70 for the first time since late-January 2018 while it remains above its 200 daily moving average. In other words, momentum has returned to the stock market, which tends to indicate a near term topping cycle. The declines in the major averages on Thursday may have given investors the opportunity to buy desired equities at lower prices, even as corporate earnings haven’t changed for the worse. With Asian equity markets largely finishing in the red overnight and European equity markets showing selling pressure, it remains to be seen how U.S. equities rebound on Friday and ahead of a 3-day, holiday weekend.
Also on Thursday, investors received further confirmation of a strengthening U.S. economy with jobless claims rising slightly, but hovering around all-time record low levels and Personal Consumption and Expenditures showing strong consumer outlays. The government said consumer spending climbed 0.4% in July. Incomes rose 0.3 percent. Higher spending and faster economic growth have also fueled creeping inflation. The 12-month increase in the PCE index, the Federal Reserve’s preferred inflation gauge, rose to 2.3% from 2.2 percent. That’s the highest level since April 2012. The savings rate fell a tick to 6.7% from 6.8% as spending outpaced incomes. The savings rate had been as high as 7.4% earlier this year.
“Improving household finances, fueled by solid wage gains and lower personal tax rates, will help bolster consumer spending for the next several quarters,” said James Bohnaker, associate director of U.S. and consumer economics at IHS Markit.”
It’s important to note that with reflation in the economy and the economy still humming along on the heels of consumer spending, consumers will likely have higher borrowing costs going forward, as debt levels rise. The Fed is almost certainly hiking rates by .25 bps come late September which will raise short term borrowing rates as well. Nonetheless, households are better able to manage rising rates and borrowing costs/debt costs. (See chart below)
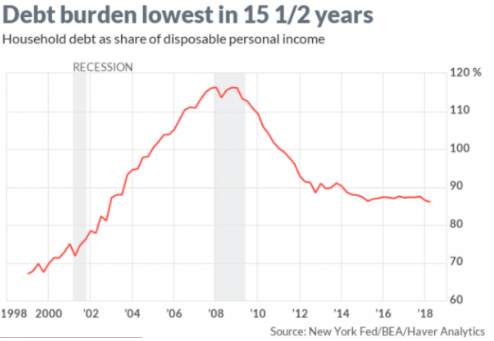
With personal disposable incomes at a $15.46 trillion annual rate in the 2nd quarter, the debt-to-income ratio dipped to 86 percent. That’s the lowest since the fourth quarter of 2002. At the height of the credit bubble in 2008, debts topped at 116% of disposable income. So for all the worries surrounding household debt, it’s simply an unfounded fear and one of the reasons permabears continue to find markets not aligning with their concerns for the level of household debt.
Finom Group’s chief market strategist Seth Golden has been painting permabears into a corner by debunking their confounding market notions for several years. In a research report published on August 12, Golden lifted the bottom end of his S&P 500 2018 target from 2,850 to 2,900, which was achieved this week.
“And to conclude… Finom Group has recently reflected on our 2018 forecast for the S&P 500. We revised our target by bumping up the lower end from 2,850 to 2,900 and maintain our top end of the range at 2,950. We remain of the opinion that August and September will prove turbulent for the market, but ultimately give way to both economic and corporate fundamentals, which are improving. As such, Finom Group will look for opportunities to deploy more capital exposure to equities.”
Golden’s top end S&P 500 target, originally offered in December 2017, remains at 2,950. Furthermore, Golden recently told a Thomson Reuters reporter that it’s likely that current S&P 500 earnings estimates for FY18 may be too low.

In an interview with Trevor Hunnicutt, Golden told the reporter, “Given the beat rate of companies during the first half of the year, the current expectations of 20% S&P 500 earnings growth may be too low, possibly by 4-5% on a quarterly basis and through the back half of 2018. The 4th quarter has the potential for projected Q4 earnings to come in at as much as 8% higher than forecasted. This proposes analysts estimates for S&P 500 earnings to be at the low end, possibly forcing analysts to raise their S&P 500 targets on the year. “
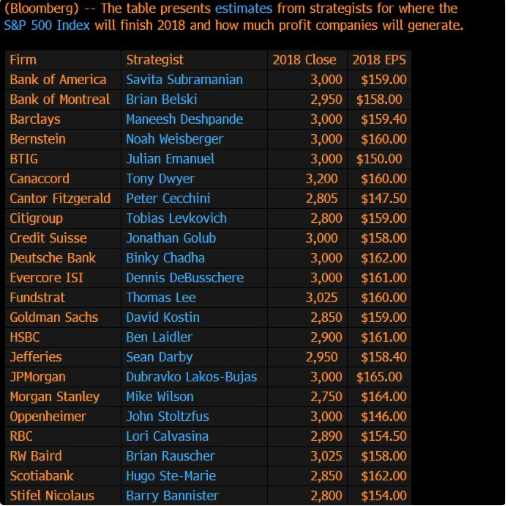
Speaking of S&P 500 earnings, Bloomberg recently released a table of analysts’ S&P 500 targets and earnings estimates for the year, as shown below:
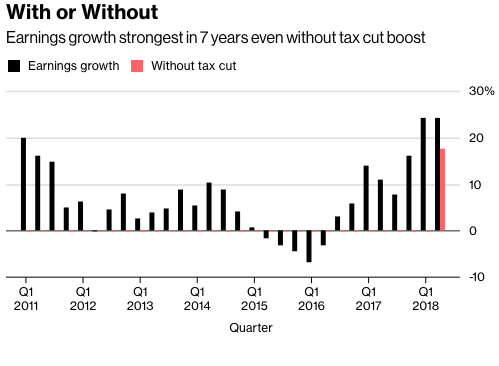
Moreover, Bloomberg also recently reported on where S&P 500 earnings would be absent the highly touted tax cuts.
“Credit Suisse estimates that the lower levies are adding nearly 8 percent to EPS. With trend EPS growth on pace for 25.5 percent in the second quarter, stripping out the tax boost still leaves a 17.6 percent increase, the firm’s chief U.S. equity strategist wrote earlier this month. That’s still the highest since 2011, which obviously predates the overhaul.”
U.S. equity futures are indicating a modestly lower open on Wall Street at the 6:00 a.m. EST hour. One market strategists recently suggested the bull market has plenty of room to run and likes what he sees in the S&P 500 chart.
“Raymond James’ Jeffrey Saut says the S&P 500 just made a key move: The index broke out from a multi-month base. And, he believes it doesn’t get much bullish than that.
“You’ve basically been in an upside consolidation,” the firm’s chief investment strategist said Wednesday on CNBC’s “Trading Nation.”
According to the Wall Street veteran and long-time bull, it’s a chart “worth a thousand words.
That upside consolidation phase tells me that we’re going to be above 3,000 probably by Thanksgiving and probably 3,100 to 3,200 by the end of the year.”
With the S&P 500 forward 12-month PE at roughly 16 times earnings, Saut suggests that if earnings continue to come in better than expected, valuations are not that high. Saut likes all industries except utilities and consumer staples, which he deems as too expensive based on valuations. Right now, he’s highlighting financials as a group that could grab substantial gains.
As we close out the month in the equity markets, for the week, the Dow is up 0.8%, the S&P is up 0.9%, and the Nasdaq is up 1.8 percent. Looking at all of August, the Dow has gained 2.3%, the S&P has risen 3%, and the Nasdaq has climbed 5.4 percent. Going into September, and with the S&P 500 at all-time highs, the market could experience some turbulence after 5 consecutive monthly gains. September is typically the worst month of the year for equities, offering investors the ability to rebalance toward the end of the Q3 2018 period. Happy Trading folks!


