Welcome to another trading week. In appreciation for all of our Basic Membership level participants and daily readers of finomgroup.com content, we offer the following excerpts from within our weekly Research Report. Our weekly Research Report is extremely detailed and has proven to help guide investors and traders during all types of market conditions with thoughtful insights and analysis, graphs, studies, and historical data. We encourage our readers to upgrade to our Contributor Membership level ($14.99/monthly, cancel anytime) to receive our weekly Research Report and State of the Market videos. Have a great trading week and take a look at some of the materials from within this week’s Research Report…
Research Report Excerpt #1
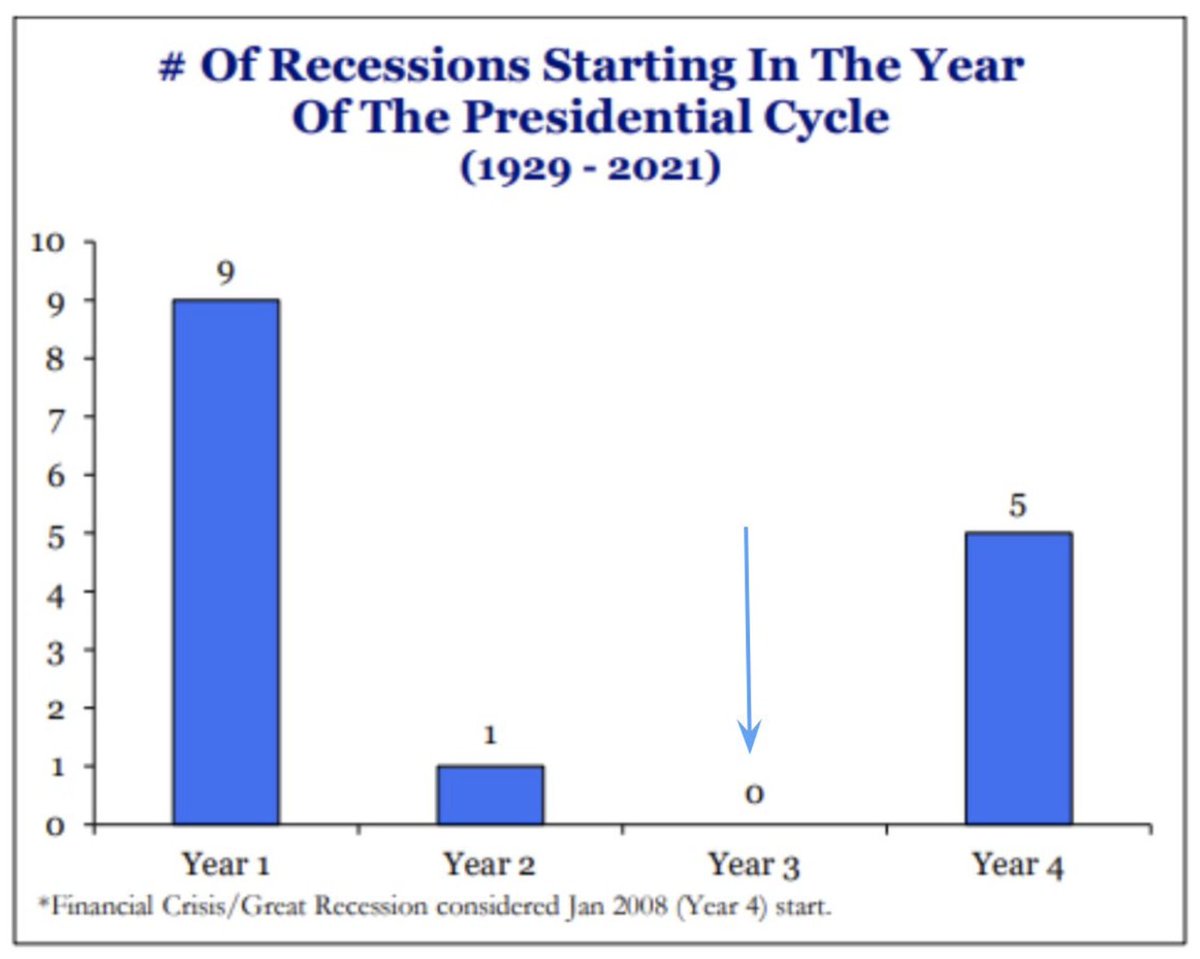
Since 1929, not a single recession began in Year 3 of a 4-year Presidential Cycle, or pre-election year as it is better known. While 2023 could still yet become the first, the probabilities are quantitatively very low. Without a recession materializing by year-end 2022, it would seem as though investors came into 2023 with the aforementioned data in mind, and have been putting money to work, slowly but surely.
Research Report Excerpt #2
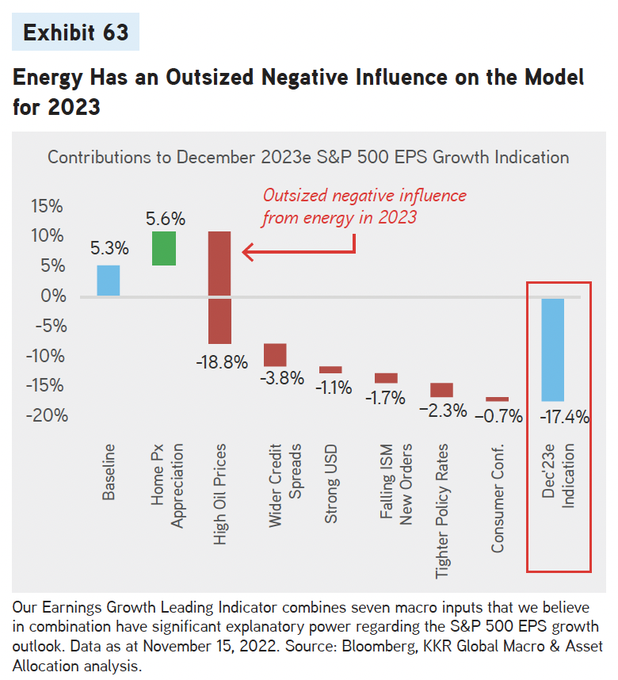
Some of you might recall the above graphic from KKR Financial, disseminated at year-end 2022 and recognizing the many HEADWINDS for S&P 500 EPS in 2023. The biggest detractor from EPS was forecast to be high oil/energy prices. Interestingly enough, energy price deflation has proven one of the biggest supports and tailwinds within the disinflationary trend. While it may detract from EPS within the energy sector itself, it may provide a tailwind for consumers and boost EPS potential in other sectors such as consumer discretionary spending. Have you seen the data on travel and leisure spending, maybe airlines? Also in the graphic was a forecast headwind from a strong  Dollar, but the 2022 strong Dollar has not transitioned with the New Year. In fact, the Dollar hit its lowest level in nearly a year just this past week, with the Dollar Index falling below $100 and to its lowest level since March 2022.
Research Report Excerpt #3
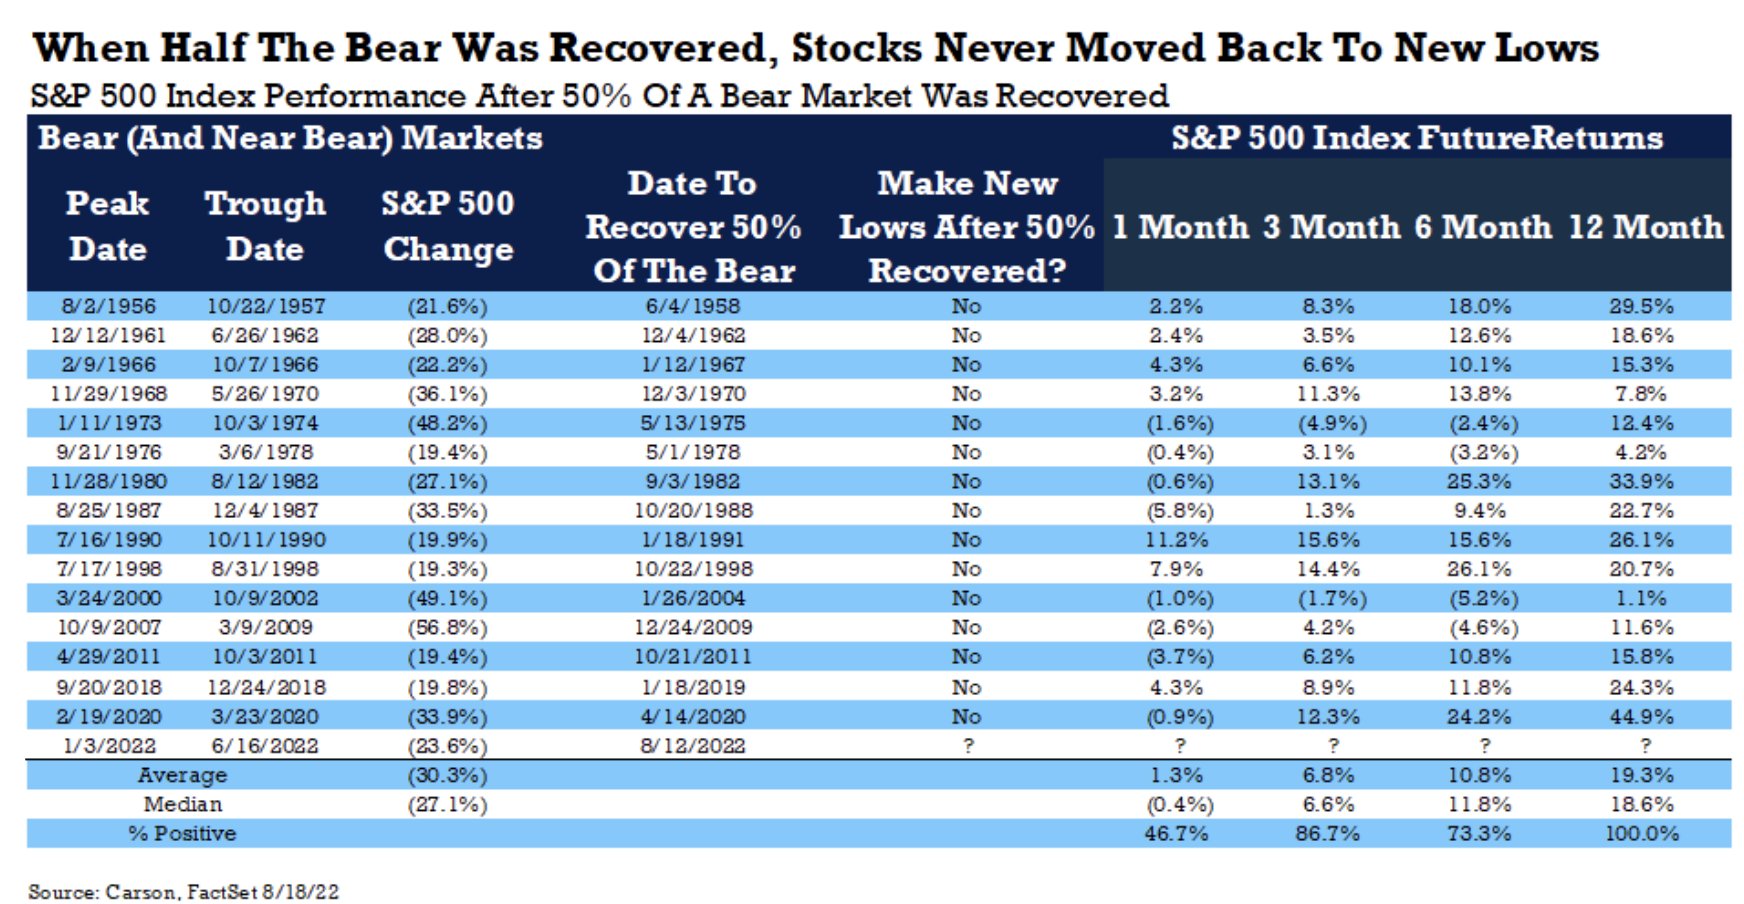
On May 26th, the S&P 500 closed at 4,205 and managed a 50% recovery of the bear market. As shown in the table above, the 3 month forward S&P 500 performance has been positive nearly 87% of the time, with a median gain of 6.6 percent. Nearly 2 months since the 50% retracement date, the S&P 500 has already gained another 7.5 percent. There’s obviously room for consolidation given the 3-month forward median return. Having said that, the positivity percent rate suggests the market will be higher than it was on May 26th by the end of the 3-month forward period.
Research Report Excerpt #4
It is not just real wage growth that proves beneficial to the average household; it’s the ability to supplement wages with high yielding money market funds, to further generate wealth or cement the stability of a household balance sheet. Here is what I mean, and if I hadn’t articulated properly in the past:
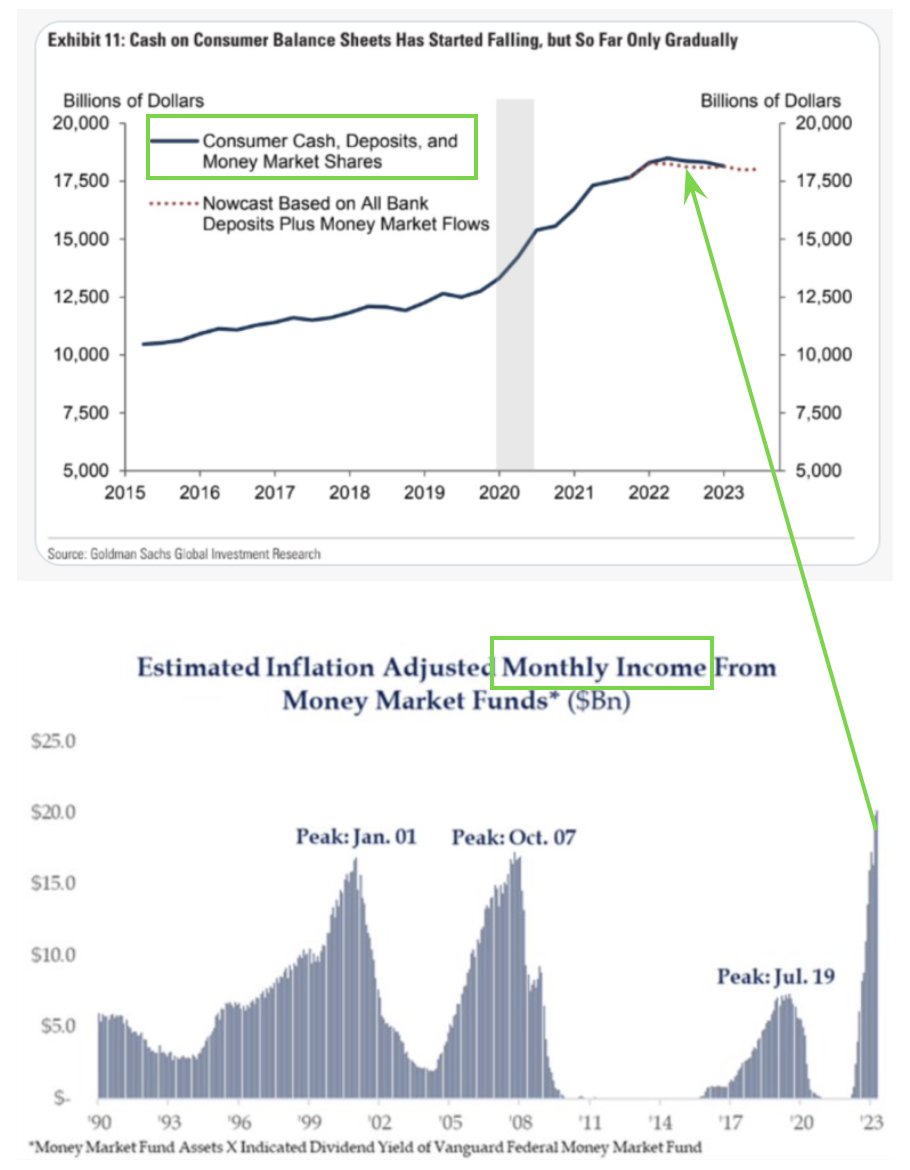
- Raising rates, thereby raising yields for deposits, producing higher Money Market Fund yields, producing more monthly income for households = more cash on household balance sheets. Is this what the Fed intended; self inflicted benefits? Hard to drive a recession this way, let alone sustained demand and profit weakness.
Research Report Excerpt #5

How are the numbers trending to date? The chart above  tells the story. Of the 30 S&P 500 companies that have reported actual earnings for Q2 2023 through July 14, 80% have reported actual EPS above the mean EPS estimate. In aggregate, actual earnings reported by these 30 companies have exceeded estimated earnings by 8.8 percent.
Research Report Excerpt #6
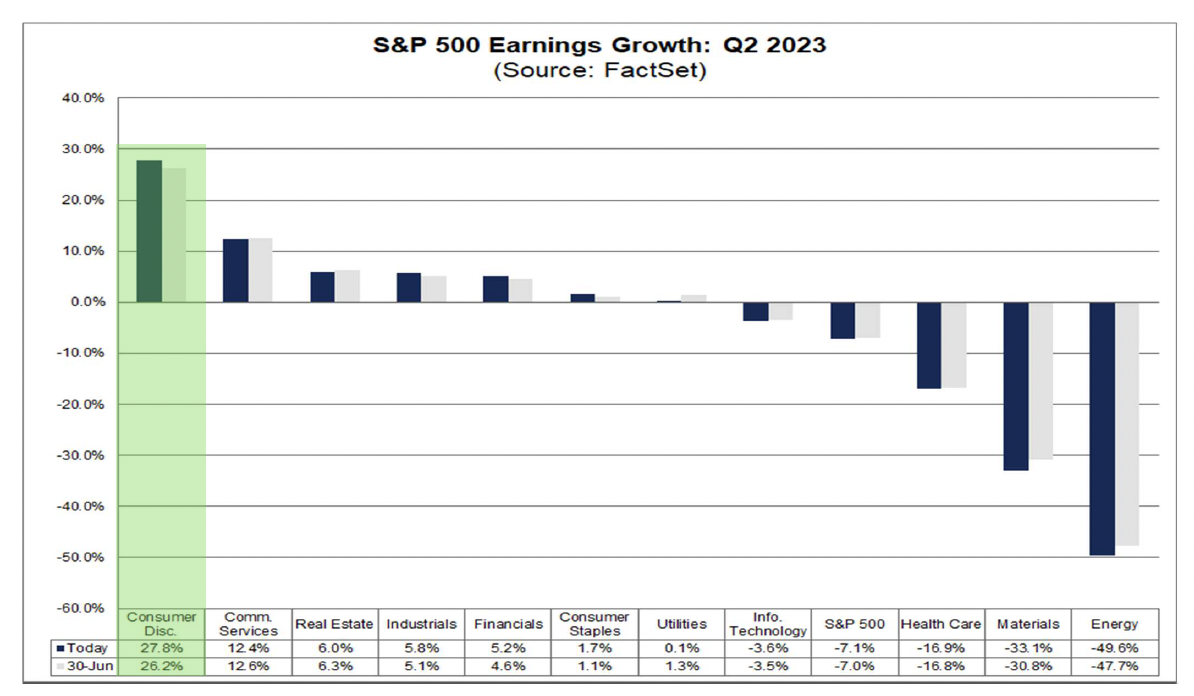
As shown in the chart above, the Consumer Discretionary sector is forecast to have the greatest contribution to positive EPS growth in the Q2 2023 period. At the industry level, the Broadline Retail and Hotels, Restaurants, & Leisure industries are the largest contributors to earnings growth for the sector. If these two industries were excluded, the Consumer Discretionary sector would be projected to report a (year-over-year) decline in earnings of -10.1% instead of year-over-year earnings growth if 27.8%. At the company level, Amazon.com is expected to be the largest contributor to earnings growth for the sector. If this company were excluded, the expected earnings growth rate for the sector would fall to 7.0% from 27.8%.
Research Report Excerpt #7
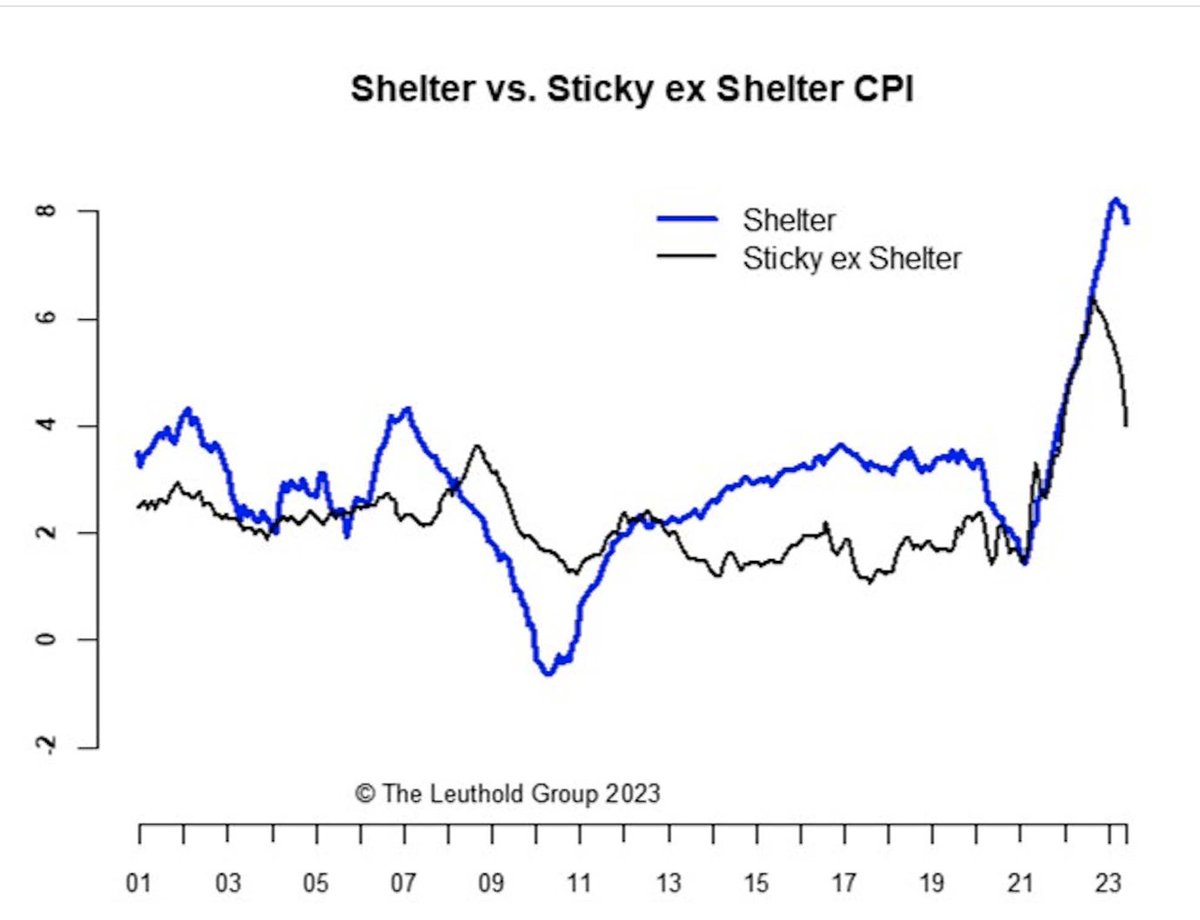
Official rental inflation appears to be turning lower. Rental inflation was averaging a 9% annual pace between June 2022 and February 2023. However, that’s fallen to about 6% over the past 4 months. That’s still higher than the 2018-2019 average of about 3-3.5%. But given what we’re seeing in market rents, we expect housing inflation to continue decelerating and that’s going to pull core inflation down in a big way later this year and into 2024 as well.
Research Report Excerpt #8

The media will convince the masses as to why any and all rallies post a recession and bear markets of any kind is nothing but a bear market rally, and the recession will revive itself again, forming a double-dip recession. This has been an ongoing media, fear-mongering campaign for the last 40+ years. Your job is to recognize that headlines are fleeting, and rarely price what the market prices, earnings. In a ~$20trn economy, the nuances that are headlined about the U.S. economy rarely add up to exact a recession, leading or lagging indicators be darned.
Research Report Excerpt #9
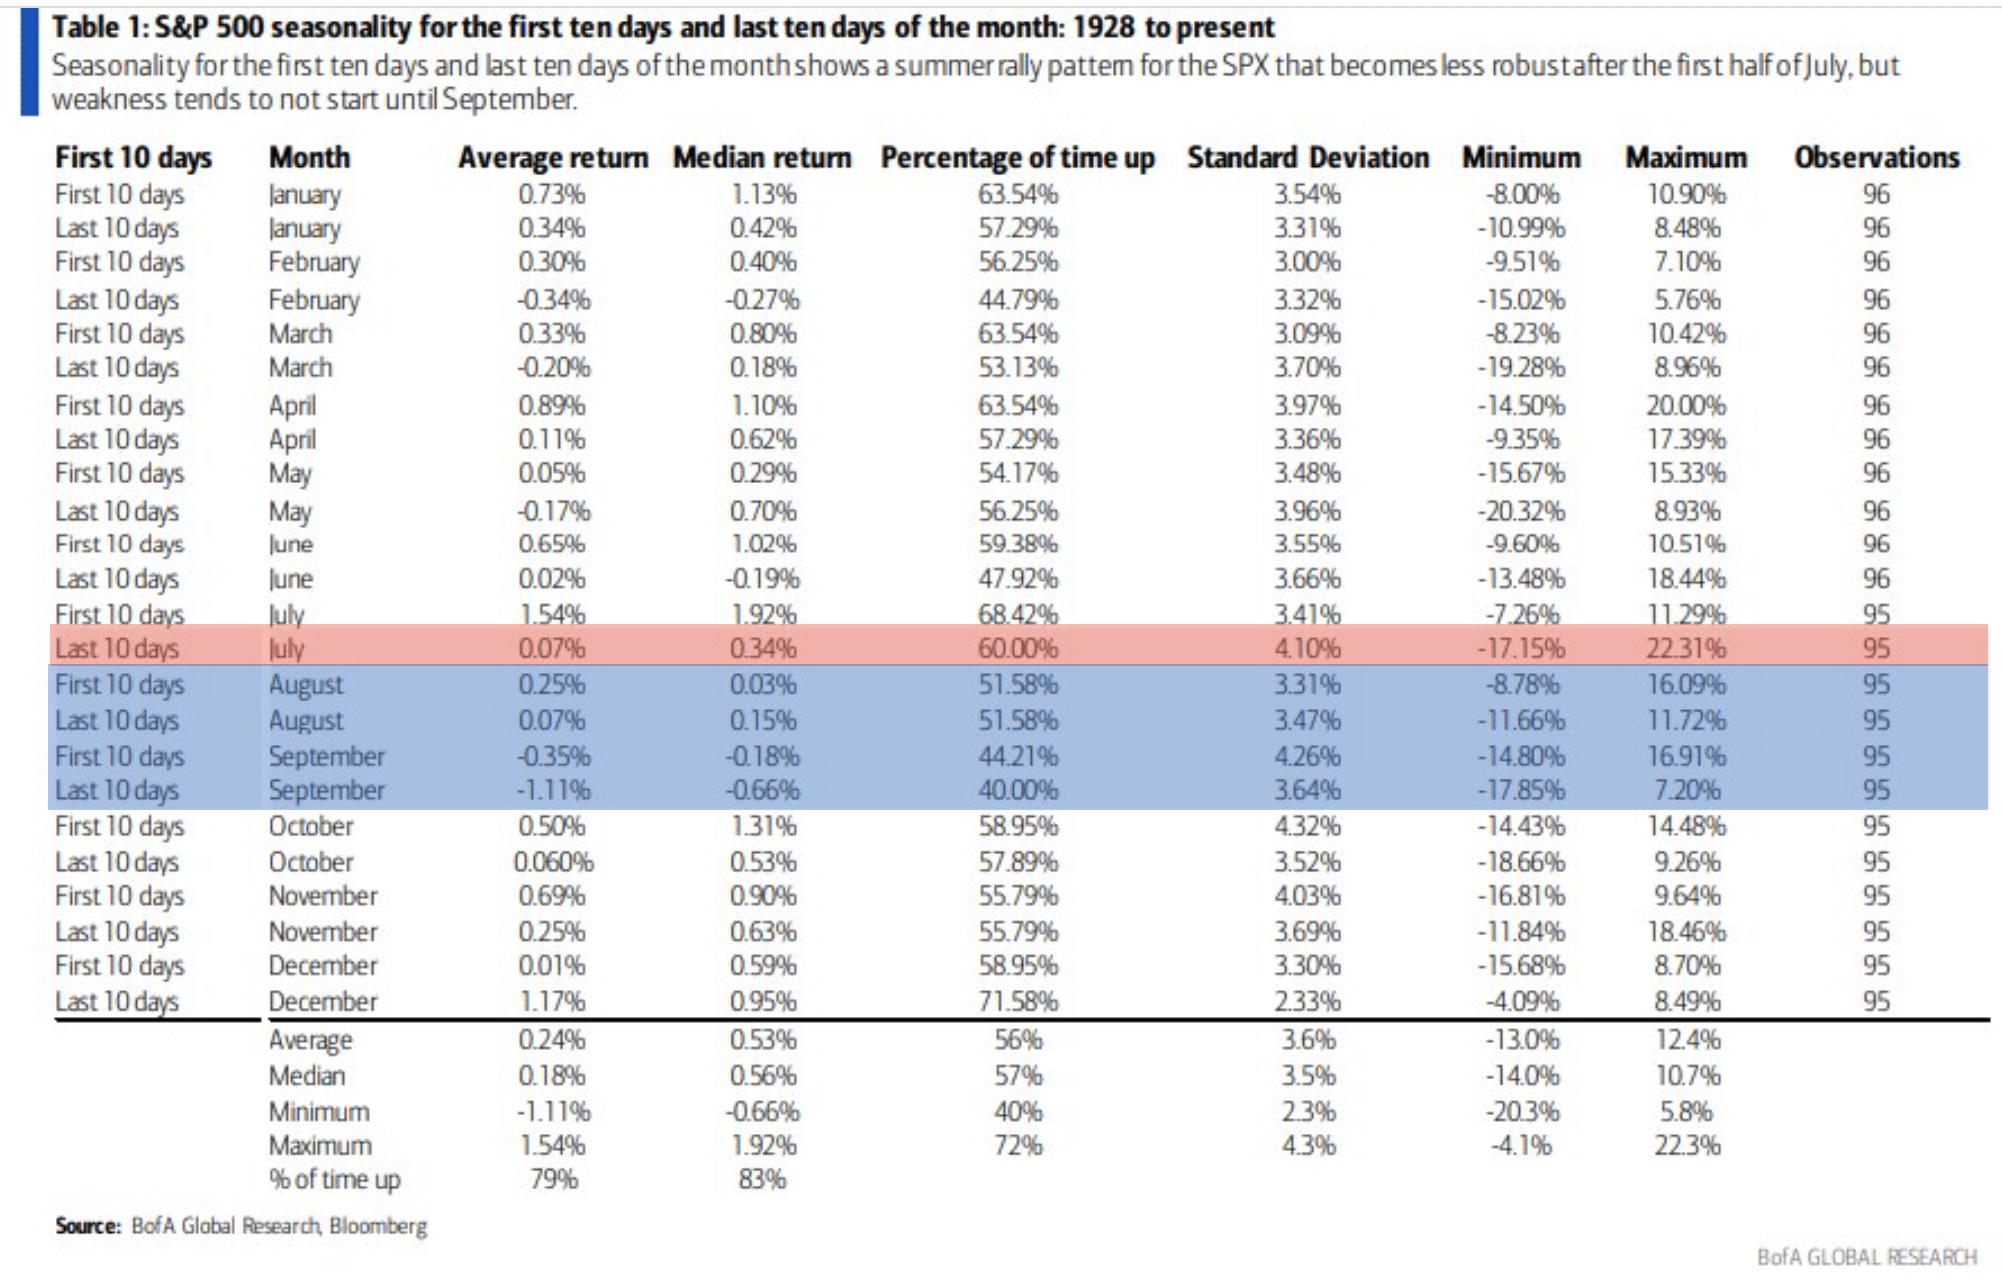
What comes after this historically bullish period noted above, well, most signs point to a historically soft period in the markets. And while that may sound somewhat bearish, as long-term investors it should sound more like opportunity.